HAL Id: hal-02306813
https://hal.archives-ouvertes.fr/hal-02306813
Submitted on 23 Oct 2020
HAL is a multi-disciplinary open access
archive for the deposit and dissemination of
sci-entific research documents, whether they are
pub-lished or not. The documents may come from
teaching and research institutions in France or
abroad, or from public or private research centers.
L’archive ouverte pluridisciplinaire HAL, est
destinée au dépôt et à la diffusion de documents
scientifiques de niveau recherche, publiés ou non,
émanant des établissements d’enseignement et de
recherche français ou étrangers, des laboratoires
publics ou privés.
Distributed under a Creative Commons Attribution| 4.0 International License
To cite this version:
Joaquim Torra, Céline Lafaye, Luca Signor, Sylvain Aumonier, Cristina Flors, et al.. Tailing miniSOG:
structural bases of the complex photophysics of a flavin-binding singlet oxygen photosensitizing
pro-tein. Scientific Reports, Nature Publishing Group, 2019, 9 (1), pp.2428-1-2428-10.
�10.1038/s41598-019-38955-3�. �hal-02306813�
www.nature.com/scientificreports
tailing minisoG: structural bases
of the complex photophysics of
a flavin-binding singlet oxygen
photosensitizing protein
Joaquim torra
1, Céline Lafaye
2, Luca signor
2, Sylvain Aumonier
3, Cristina Flors
4,5,
Xiaokun shu
6,7, santi Nonell
1, Guillaume Gotthard
3& Antoine Royant
2,3miniSOG is the first flavin-binding protein that has been developed with the specific aim of serving as a genetically-encodable light-induced source of singlet oxygen (1o
2). We have determined its
1.17 Å resolution structure, which has allowed us to investigate its mechanism of photosensitization using an integrated approach combining spectroscopic and structural methods. Our results provide a structural framework to explain the ability of miniSOG to produce 1o
2 as a competition between
oxygen- and protein quenching of its triplet state. In addition, a third excited-state decay pathway has been identified that is pivotal for the performance of miniSOG as 1o
2 photosensitizer, namely the
photo-induced transformation of flavin mononucleotide (FMN) into lumichrome, which increases the accessibility of oxygen to the flavin FMN chromophore and makes protein quenching less favourable. The combination of the two effects explains the increase in the 1o
2 quantum yield by one order of
magnitude upon exposure to blue light. Besides, we have identified several surface electron-rich residues that are progressively photo-oxidized, further contributing to facilitate the production of
1o
2. Our results help reconcile the apparent poor level of 1o2 generation by miniSOG and its excellent
performance in correlative light and electron microscopy experiments.
miniSOG (for mini Singlet Oxygen Generator)1 is a 106 amino acid flavin-binding protein that generates 1O 2
under exposure to blue light. It was originally developed by Shu and coworkers for correlative light and electron microscopy (CLEM) as it both fluoresces and catalyzes the photo-oxidation of diaminobenzidine (DAB), provid-ing high-resolution images1. Novel applications are being actively developed since2–5. miniSOG was engineered
from the LOV2 (Light, Oxygen and Voltage) domain of Arabidopsis thaliana phototropin 21. Proteins based on
LOV domains are blue-light photoreceptors that form a light-induced and reversible flavin-cysteine covalent adduct that consumes the energy of the excited state6. Replacement of the cysteine residue by an alanine or glycine
avoids the formation of the covalent bond and leads to a fluorescent protein7,8. miniSOG contains six mutations
as compared to its precursor, two of them involving residues surrounding the chromophore. Its cofactor FMN is ubiquitously found in nature9,10 and generates 1O
2 with high quantum yield (Φ∆)11, but also other reactive oxygen
species (ROS)12.
Close inspection of the photophysical and photosensitizing properties of miniSOG reveals a number of strik-ing observations: (1) its Φ∆ is much lower than that of FMN (0.03 vs. 0.51)11,13,14; (2) the lifetime (τT) of triplet
miniSOG (3miniSOG*) is much shorter than that of FMN in nitrogen-saturated solutions (33.6 µs15 vs 200 µs16);
(3) oxygen quenching is less efficient than for FMN (τTair = 31.3 µs15 vs 3.1 µs in air-saturated solutions); (4) in
1Institut Químic de Sarrià, Universitat Ramon Llull, Via Augusta 390, Barcelona, 08017, Spain. 2Univ. Grenoble Alpes,
CNRS, CEA, IBS (Institut de Biologie Structurale), F-38000, Grenoble, France. 3european Synchrotron Radiation
Facility, F-38043, Grenoble, France. 4Madrid Institute for Advanced Studies in Nanoscience (IMDEA Nanoscience),
Ciudad Universitaria de Cantoblanco, C/Faraday 9, 28049, Madrid, Spain. 5nanobiotechnology Unit Associated to
the National Center for Biotechnology (CNB-CSIC-IMDEA), Ciudad Universitaria de Cantoblanco, 28049, Madrid, Spain. 6Department of Pharmaceutical Chemistry, University of California-San Francisco, San Francisco, California,
94158-9001, United States. 7Cardiovascular Research Institute, University of California-San Francisco, San Francisco,
California, 94158-9001, United States. Correspondence and requests for materials should be addressed to S.N. (email: santi.nonell@iqs.url.edu) or G.G. (email: guillaume.gotthard@esrf.fr) or A.R. (email: antoine.royant@ibs.fr) Received: 2 August 2018
Accepted: 11 January 2019 Published: xx xx xxxx
addition to 1O
2 it also produces superoxide (O2•−)12,14; (5) it undergoes a remarkable transformation upon
expo-sure to light, whereby Φ∆ increases 10-fold (to ~0.3) and τTair shortens by 10-fold (to ~3 µs)13,14. The absence of a
structure of miniSOG so far had prevented to rationalize these observations, which we have attempted here using a combined structural and photophysical approach.
Based on the extensive data present in the literature and the photophysical and structural results presented herein, a mechanism of excited-state deactivation of miniSOG can be proposed that involves three main path-ways (Fig. 1). The shorter lifetime of 3miniSOG* compared to 3FMN* indicates that protein quenching is a major
mechanism of triplet decay (pathway I). Its rate constant kP is largely determined by electron transfer with nearby
electron-rich residues17. Quenching of the singlet state can be safely ruled out since no shortening of the
fluores-cence lifetime or decrease in the fluoresfluores-cence quantum yield are observed relative to free FMN. In the presence of oxygen, a second decay pathway (pathway II) is possible, namely oxygen quenching to produce 1O
2 (energy
transfer) or O2•− (electron transfer), as observed for FMN in solution12. It is also possible to produce O2•− by
reac-tion of oxygen with a radical anion formed during protein quenching in pathway I. Finally, miniSOG undergoes a photoinduced transformation (pathway III, rate constant kPhot), for which we provide here a detailed description
for the first time.
Results and Discussion
High resolution crystal structure of minisoG.
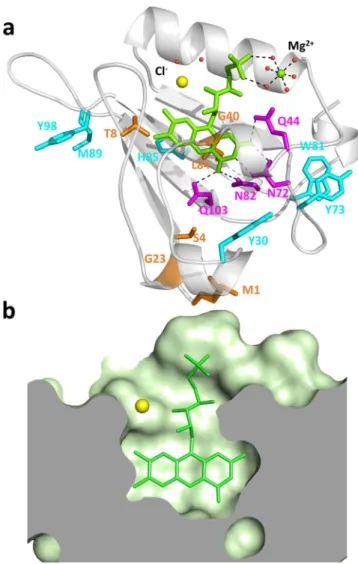
We have solved the structure of miniSOG at 1.17 Å res-olution (Fig. 2a and Supporting Information), which shows an increase in rigidity of the environment of the chromophore compared to that in the LOV2 domain, the location of potential quenchers of the excited states of FMN, and the phosphoribityl tail of FMN lying in a tunnel bridging the bulk solvent and the chromophore encased in the core of the protein (Fig. 2b). The latter hinders oxygen access to the isoalloxazine ring. The pres-ence halfway through the tunnel of a chloride ion, which can be a good mimic of molecular oxygen18,19, suggeststhat oxygen diffusion can occur.
Deactivation mechanism of miniSOG triplet excited state (Pathways I and II).
The values of the relevant rate constants for pathways I and II can be inferred from the 3miniSOG* lifetime measurements.Comparison of the decay rate constant (1/τT) of miniSOG and SOPP3, the miniSOG mutant with the longest τT
reported so far (3.3 ms in nitrogen-saturated solutions)17 allows us to estimate the rate constant for protein
quenching (kP = kTN2 − kTN2,SOPP3, Table 1). SOPP3 is a miniSOG variant, which encases the same chromophore
FMN and, most importantly, lacks most of the electron-rich residues present in the vicinity of the flavin in mini-SOG. Hence, protein quenching of the triplet chromophore in SOPP3 is essentially suppressed, which makes SOPP3 a convenient model for the study of the contribution of protein quenching in miniSOG. Likewise, the pseudo-first order rate constant for oxygen quenching (kO2 = kT
Air − k
TN2) can be estimated from τT data in air-
and nitrogen-saturated solutions (Table 1).
Comparison of kp and kO2 in Table 1 reveals that protein quenching (pathway I) is the main triplet deactivation
pathway, removing 93% of the triplets in air-saturated solutions kP/(kP + kO2). Oxygen only quenches 7% of the
triplets, which limits Φ∆ to 0.6 × 0.07 = 0.042 (Eq. 1), in excellent agreement with the experimental value. It can
therefore be concluded that the modest Φ∆ of miniSOG is due to an unfavorable combination of low kO2 and high
kP values, as proposed previously17.
Φ = Φ × + + ≈ Φ × + Δ k k k k k k k (1) T O p Phot O T O p O 2 2 2 2
Our structural results above suggest that the low value of kO2 is due to the steric hindrance of the ribityl tail within
the tunnel which provides oxygen access to the FMN. Regarding kP, the miniSOG structure shows that six
electron-rich residues are positioned within 8.2 to 10.2 Å from the isoalloxazine ring, namely Tyr30, Tyr73, Trp81, His85, Met89 and Tyr98, and are thus close enough to the chromophore to act as electron-transfer quenchers of
3miniSOG*20. In addition, four hydrophilic residues, Glu44, Asp72, Asp82 and Glu103, form hydrogen bonds
Figure 1. Model of oxygen photosensitization by miniSOG. ΦF: fluorescence quantum yield, ΦT: triplet state
quantum yield, kP: protein quenching rate constant, kPhot: photoproduct formation rate constant, kO2: oxygen
quenching rate constant, ΦΔ: singlet oxygen quantum yield. I, II, III, and IV indicate the three deactivation and
www.nature.com/scientificreports
www.nature.com/scientificreports/
with FMN, and may thus enhance protein quenching and O2•− formation21. Replacing selectively these residues
should lead to a lengthening of the triplet lifetime of miniSOG22 and hence to a higher fraction of triplets being
trapped by oxygen, thus to a higher Φ∆ value. In fact, some of these positions have already been mutated in light
of their capacity of direct electron transfer from the FMN: such miniSOG mutants show considerably longer τT
values (e.g., 196 µs for miniSOG Q103L (SOPP)23, 1.1 ms for miniSOG W81F (Supplementary Fig. S2), and 3.3 ms
for SOPP317 in oxygen-free solutions) and larger Φ
∆ values (0.25, 0.33 and 0.6, respectively), in agreement with
Figure 2. High-resolution crystallographic structure of miniSOG. (a) Secondary structure (white) represented
with FMN (green), chloride (yellow), magnesium (green) and water molecules (red). Represented residues: mutations from LOV2 (orange), residues hydrogen-bonded to the FMN ring (magenta), and potential quenchers of 3FMN* (cyan). (b) Topology of the FMN-binding site.
Parameter in D2O in H2O Pathway References
τS 5.0 ns 4.9–5.5 ns 13,15,43 ΦF 0.43 0.37–0.44 1,14,15,43,44 ΦT 0.6 0.6 15 ΦΔ 0.03–0.04 0.03–0.05 13,14,23,31,44 kTN2 2.41 × 10⁴ s−1 2.98 × 10⁴ s−1 15 kP 2.38 × 10⁴ s−1 2.95 × 10⁴ s−1b I This work kTAir 2.59 × 10⁴ s−1 3.19 × 10⁴ s−1 15 kO2 1.8 × 10³ s−1 2.3 × 10³ s−1 II This work
kPhot 6.0 s−1 — III This work
Table 1. Photophysical properties of miniSOG in D2O- and H2O-based phosphate buffer. D2O was used
to increase the singlet oxygen lifetime, thus boosting the reactions and processes in which singlet oxygen is involved and facilitating its detection45. aAssuming the same value of k
Eq. 1. It is worth noting also that miniSOG produces more O2•− than free FMN12, which indicates that the radical
anion pathway contributes to the production of O2•−. Indeed, SOPP shows an 8-fold higher Φ∆ value than
mini-SOG but only a 1.3 higher yield of O2•−23. Thus, removal of hydrophilic side chains in the vicinity of the
chromo-phore should strongly reduce the relative formation of O2•− vs. 1O2.
Consequences of blue-light irradiation of miniSOG on its FMN chromophore (Pathway III).
In light of Eq. 1, the observed 10-fold decrease in τT and similar increase in Φ∆ upon extended photolysis suggestsevere changes in both kP and kO2. Blue-light (440 nm) irradiation of a miniSOG crystal at 10 W·cm
−2 led to a
five-fold decrease of the fluorescence signal over a 30 min course (Supplementary Fig. S3) and was gentle enough to keep diffraction around 2.0 Å resolution while affecting a sufficient fraction of molecules so that structural alterations could be visualized in electron density maps. A difference Fourier map calculated from non-irradiated and irradiated parts of a crystal revealed the loss of electron density all along the ribityl tail of the FMN (Fig. 3a), strongly suggesting its cleavage. Besides, Electrospray ionisation time-of-flight (ESI-TOF) mass spectrometry performed on irradiated protein samples show (Fig. 3b) the progressive disappearance of the FMN peak at
m/z = 457.1 in favor of a peak at m/z = 243.1.
To get further insights into the photoconversion, we performed additional photophysical investigations. Besides the already-known shortening of τT and increase in Φ∆, exposure of miniSOG samples to light induces
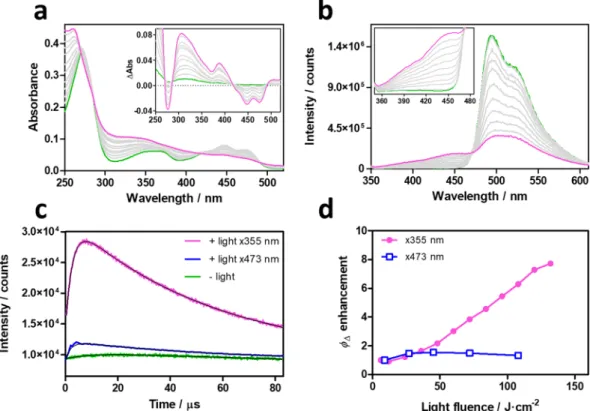
photobleaching of the FMN chromophore and appearance of new absorption and fluorescence bands (Fig. 4a,b). The leaching out of FMN from miniSOG was routinely checked and could be safely ruled out. The quantum yield and rate constant of pathway III could be estimated (Table 1, Supplementary Fig. S1). Noteworthy, the Φ∆ value
increases when the photoconverted miniSOG is excited at 355 nm, but remains essentially constant when probed at 473 nm (Fig. 4c,d).
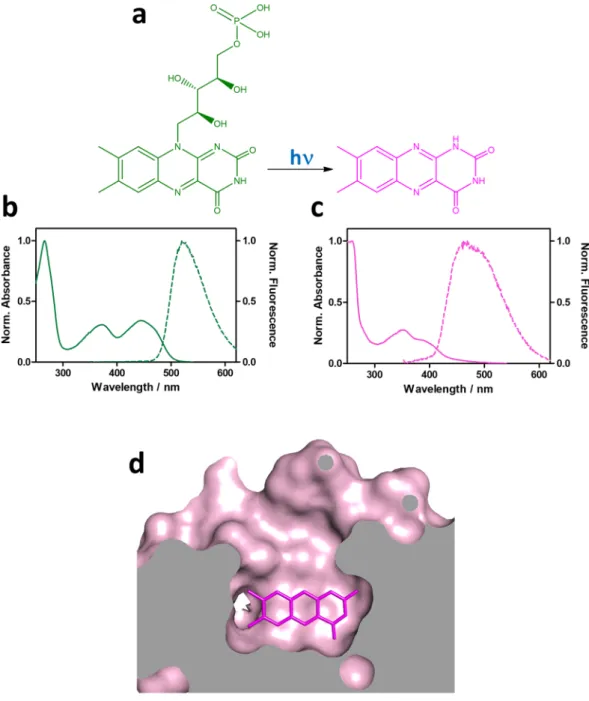
Phototransformation of FMN to lumichrome (LC) is consistent with all of the above observations: (1) LC is a photodegradation product of flavins in aqueous solutions24; (2) the observed mass loss upon irradiation matches
the molar mass difference between FMN (456.3 Da) and LC (242.2 Da); (3) LC absorbs and fluoresces at shorter wavelengths than FMN, (Fig. 5); (4) LC lacks the phosphoribityl tail of FMN, which facilitates the access of molecular oxygen to the isoalloxazine ring, resulting in the increase of kO2 and the decrease of τT; (5) LC is a worse
electron acceptor than FMN, hence protein quenching is less favored. The ΔrG° value for quenching of 3
ribofla-vin* by tryptophan is −86.5 kJ·mol−1 (riboflavin is analogous to FMN except for the phosphate group) while is
more positive for 3LC*, −67.2 kJ·mol−125; (6) finally, LC is also an excellent 1O
2 photosensitizer25–27, hence the
combination of a higher kO2 and a lower kP yield a higher Φ∆ value (Eq. 1) when excited at 355 nm but not at
473 nm, where LC barely absorbs.
Consequences of blue-light irradiation of miniSOG on its amino acid residues (Pathway IV).
We investigated if our structural data could also support a decrease in kP. Indeed, the 2Fobs − Fcalc electron density
map of blue-light irradiated miniSOG reveals the unambiguous oxidation of three surface residues during irradi-ation (Fig. 6a, Supplementary Fig. S4). Tyr73 has been partially converted to a γ-peroxotyrosine. The loss of elec-tron density on Trp81 is compatible with the formation of N-formylkynurenine (NFK), a well-known tryptophan oxidation product28,29. Finally, His85 can be modeled by either a singly, or a doubly oxidized histidine, namely
2-oxo-histidine and 2,4-dioxo-histidine. Mass spectrometry analysis of blue-light irradiated miniSOG samples reveals sequential additions of +16 mass units to the native protein mass of 13882.0 Da, consistent with increasing oxidation steps of the protein (Fig. 6b). All three structural modifications account for six of the eight additional
Figure 3. Blue-light induced structural changes on the chromophore of miniSOG. (a) 2.0 Å resolution
difference Fourier map calculated between non-irradiated and irradiated parts of a miniSOG crystal contoured at a −3.0 σ level (magenta) superimposed on the FMN molecule (green). (b) ESI-TOF mass spectra acquired in the low mass range (m/z < 500) of miniSOG progressively irradiated with blue-light.
www.nature.com/scientificreports
www.nature.com/scientificreports/
oxygen atoms evidenced in the mass spectrometry analysis. The two non-assigned additions could correspond to oxidation of Tyr30, Met89 or Tyr98, although we did not observe unambiguous oxidation of these residues. Oxidation of Tyr73, His85 and Trp81 eliminates potential quenchers of 3miniSOG*, thereby decreasing the value
of kp. According to Eq. 1, this should contribute to an increase in Φ∆. However, since protein oxidation (pathway
IV) occurs simultaneously to FMN → LC transformation, which also increases Φ∆, it is not possible to ascertain
the individual contribution of both effects.
Finally, oxidation of tryptophan into NFK could contribute to the increased Φ∆ value observed at 355 nm since
NFK is a potent singlet oxygen photosensitizer (Φ∆ = 0.17)30. However, the W81F mutant shows a doubled Φ∆ (=0.33)
already before photolysis on account of its lower kp value (Eq. 1), indicating that the potential benefits of producing
NFK as secondary photosensitizer are of minor value as compared to the effect of eliminating a protein quencher.
Conclusion
We have performed an extensive structural characterization of miniSOG in the dark and its photoproduct formed in the presence of molecular oxygen, which led us to explain in structural terms the details of its complex photo-physical behavior. miniSOG is initially moderately efficient towards 1O
2 generation because of a combination of
limited oxygen accessibility and 3FMN quenching by electron-rich side chains. Prolonged irradiation to blue light
leads to several structural alterations of miniSOG, which include photodegradation of FMN into LC and oxida-tion of the quenching side chains. All this results in an increase of Φ∆ when photoconverted miniSOG is excited
at the wavelengths where the formed LC absorbs. Formation of LC liberates the access of molecular oxygen to the alloxazine ring and reduces protein quenching of the triplet state, while oxidized electron-rich side chains cannot quench the triplet state of the chromophore. The competition between oxygen quenching and protein quenching of flavin triplet state seems to be a general feature of flavin-binding proteins31, hence our results will be useful to
guide the evolution of such a protein towards retaining or gaining a specific function. Finally, our results explain the apparent discrepancy between the poor level of singlet oxygen generation by miniSOG, which had been consistently measured at low light fluences, and its efficiency in CLEM experiments, in which the singlet oxygen generation capability of miniSOG is exploited over its whole lifetime.
Methods
Chemical compounds.
Riboflavin-5′-monophosphate sodium salt hydrate (FMN) (Chemochroma), Lumichrome (Santa Cruz Biotechnology), tris(hydroxymethyl)aminomethane (Merck), sodium chloride (Panreac Applichem), imidazole (Merck), L-arabinose (Sigma Aldrich) and ampicillin (Sigma Aldrich) were used as received. Phosphate-buffered saline (PBS) or deuterated dPBS solutions were prepared by dissolving the required amount of a PBS tablet (Sigma Aldrich) in milliQ water or deuterium oxide (Sigma-Aldrich).Figure 4. Spectroscopic characterization of photoconverted miniSOG. Evolution of miniSOG’s absorbance
(a) and fluorescence (b) upon laser irradiation at 355 nm. Insets show the difference absorption spectra before and after irradiation, and a zoomed-in image of the new fluorescence bands. (c) Time-resolved NIR 1O
2
phosphorescence decays of native (green) and photoconverted miniSOG excited at 473 nm (blue) or 355 nm (magenta). (d) Observed ΦΔ enhancement at 473 nm (blue) and 355 nm (magenta).
Expression and purification.
Genes coding for a C-terminal 6xHis-tagged recombinant miniSOG and miniSOG W81F were inserted in a pBad expression vector and over-expressed in Escherichia coli CodonPlus (DE3) RIL Cells (Stratagene) or in TOP10 cells (Invitrogen). Bacterial cells were grown in LB broth medium containing 1 mM Ampicillin. At an OD600 of approximately 0.6, expression of recombinant protein was inducedby the addition of L-arabinose and cells were grown for an additional 24 h at 25 °C. Cells were pelleted by cen-trifugation (4000 g, 4 °C, 30 min), re-suspended in buffer A (20 mM Tris-Hcl pH 8.0, 500 mM NaCl), comple-mented with complete protease inhibitors-EDTA (Roche) and disrupted using a micro-fluidizer. The soluble fraction was recovered by centrifugation (40,000 g, 4 °C, 30 min), and loaded on a 1 mL Ni-NTA superflow col-umn (Qiagen) pre-equilibrated with buffer A. The His-tagged protein was eluted with 150 mM imidazole in buffer
A. Fractions containing purified proteins were pooled and concentrated to a volume of 0.5 mL using Centricon
devices (Amicon 10 kDa cut-off) and loaded onto a size-exclusion chromatography column (Hiload Superdex75 10/300, GE Healthcare) for the final step of the purification procedure. The column was equilibrated with 20 mM Tris-HCl pH 8.0 and the pooled peak fractions were concentrated to 4 mg·mL−1. Protein expression and
purifi-cation was always performed in the dark or under red light. The purity of the protein solutions was confirmed by SDS-PAGE. The final concentration was determined by UV-vis absorption spectroscopy using a molar absorption coefficient of 14 mM−1·cm−1 at 448 nm.
Figure 5. FMN is photoconverted to lumichrome. (a) Photoconversion of FMN (green) to LC (magenta).
Normalized absorption and fluorescence spectra of (b) FMN and (c) LC. (d) Topology of blue-light irradiated miniSOG showing the increased access to the alloxazine ring.
www.nature.com/scientificreports
www.nature.com/scientificreports/
spectroscopic measurements.
All spectroscopic measurements were performed using quartz cuvettes (Hellma) under magnetic stirring and at room temperature. Absorption spectra were recorded on a double beam Cary 6000i spectrophotometer (Varian). Fluorescence spectra were measured on Fluoromax-4 spectrofluorom-eter (Horiba). Time-resolved near-infrared (NIR) phosphorescence signals at 1275 nm were measured using a customized PicoQuant Fluotime 200 lifetime system. Briefly, an AO-Z-473 solid state AOM Q-switched laser (Changchun New Industries Optoelectronics Technology Co., China) was used for excitation at 473 nm, working at 1.0 kHz repetition rate at 473 nm. The average power that reached the sample was conveniently modulated by neutral density filters. For excitation at 355 nm, the frequency-tripled output of a diode-pumped pulsed Nd:YAG laser (FTSS355-Q, Crystal Laser, Berlin, Germany) was used, working at 1 kHz repetition (0.5 mW, or 5 mW, 1 ns pulse width). An uncoated SKG-5 filter (CVI Laser Corporation, Albuquerque, U.S.A.) was placed at the exit port of the laser to remove any NIR component. The luminescence exiting from the sample was filtered by a 1100 nm long-pass filter (Edmund Optics, York, U.K.) and a narrow bandpass filter at 1275 nm (bk-1270-70-B, bk Interfernzoptik, Germany) to remove any scattered laser radiation and isolate the 1O2 emission. A
Figure 6. Identification of protein residue oxidation in blue-light irradiated miniSOG. (a) 2Fobs − Fcalc electron
density maps contoured at a 1.0, 0.6 and 1.0 σ level superimposed on the refined model of residues Tyr73, Trp81, and His85, respectively. (b) Deconvoluted ESI-TOF mass spectra of miniSOG progressively irradiated with blue-light. The peak at 13882.0 Da corresponds to the native protein.
φΔ = φΔ S S (3) protein protein FMN FMN , (0) (0) ,
FMN was taken as reference photosensitizer with Φ∆ = 0.51 in PBS11 and 0.57 in dPBS33.
Transient absorption spectra were monitored by nanosecond laser flash photolysis using a Q-switched Nd-YAG laser (Surelite I-10, Continuum) operating at the 3rd harmonic. The luminescence exiting from the
sam-ple was filtered by a 610 nm long-pass filter (CVI Laser Corporation, NM, USA). Changes in the samsam-ple absorb-ance were detected at 715 nm using a Hamamatsu R928 photomultiplier to monitor the intensity variations of an analysis beam produced by a 75 W short arc Xe lamp (USHIO) and spectral discrimination was obtained using a PTI 101 monochromator. The signal was fed to a Lecroy Wavesurfer 454 oscilloscope for digitizing and averaging (typically 10 shots) and finally transferred to a PC for data storage and analysis. The system was controlled using the in-house-developed LKS software (LabView, National Instruments).
Determination of k
phot.
The rate constant for the photoproduct formation has been determined measuringthe progressive loss of miniSOG in solution as a function of the absorbed light dose at 473 nm using Eq. 4. The slope of the resulting plot yielded the photobleaching quantum yield ΦPhot, from which the rate constant for
pho-tobleaching was calculated as:
τ = Φ k (4) Phot Phot TAir
X-ray crystallography.
Crystallization procedures. miniSOG was concentrated to 4 mg·mL−1. Thecrys-tallization condition consisted of 100 mM Tris-HCl pH 8.0, 20 mM MgCl2, 28% PEG 4000, 0 or 15 mM CoCl2 at
20 °C. Crystals appeared and grew to final size after 1–2 days.
Data collection and processing. X-ray data were collected on beamlines ID23-134 and ID2935 of the ESRF and
were indexed, integrated, merged and scaled using the XDS software package36. Molecular replacement was
car-ried out using the model structure of LOV2 (PDB ID: 4eep) with the program Phaser MR37. Structure refinement
was performed using Refmac538 and manual improvement of the model with Coot39. The native structure of
miniSOG was used as a starting model for model building of bleached-miniSOG. Data collection and refinement statistics are presented in Supplementary Table S1. Structure analysis and representation were performed with
Pymol40.
Preparation of photobleached miniSOG samples.
miniSOG crystals. A single miniSOG crystal wassoaked in a cryoprotectant solution containing 20% of glycerol then harvested with a nylon loop. The crystal was exposed to 440 nm laser (10 W·cm−2) on the ID29S-Cryobench setup41 at room temperature using a HC1
humidity control device42. Spectra were recorded at a 1 Hz rate. After 30 min of total exposure, the crystal was
flashcooled in liquid nitrogen.
miniSOG solutions. Fresh miniSOG or miniSOG W81F solutions in air-saturated deuterated PBS were
illumi-nated at 355 nm (~5 mW·cm−2) or 473 nm (~15 mW·cm−2) for elapsed irradiation times. Absorption and
fluo-rescence spectra as well as time-resolved 1O
2 phosphorescence decays were recorded at different time intervals of
cumulative irradiation.
Liquid chromatography-mass spectrometry (LC-MS).
Liquid Chromatography Electrospray Ionization Mass Spectrometry (LC/ESI-MS) was carried out on a 6210 LC/ESI-TOF mass spectrometer interfaced with a binary HPLC pump system (Agilent Technologies). The mass spectrometer was calibrated in the positive ion mode with ESI-L (low concentration tuning mix, Agilent Technologies) before each series of measurements, the calibration providing mass accuracy <1 ppm in the 100–3200 m/z range. All solvents used were HPLC grade: water and acetonitrile (LC-MS Chromasolv, Sigma-Aldrich); formic acid was from Acros Organics (puriss., p.a.).Data acquisition was carried out in the positive ion mode with spectra in the profile mode and mass spectra were recorded in the 130–2000 m/z range. The mass spectrometer was operated with the following experimental settings: ESI source temperature was set at 325 °C; nitrogen was used as drying gas (5 L/min) and as nebulizer gas (30 psi); the capillary needle voltage was set at 3500 V. Fragmentor value was of 250 V and skimmer of 65 V. The instrument was operated in the 2 GHz (extended dynamic range) mode and spectra acquisition rate was of 1 spectrum/s.
www.nature.com/scientificreports
www.nature.com/scientificreports/
Before analysis, miniSOG samples were diluted to a final concentration of 10 µM in acetonitrile/water/formic acid (50:50:0.1, v/v/v) and infused directly in the mass spectrometer by a syringe pump at a flow rate of 10 μl/min. A blank run was carried out infusing only protein buffer diluted at the same ratio as the protein sample in the same solvent system.
The MS data were acquired and processed with the MassHunter workstation software (Data acquisition v.B.04.00, Qualitative analysis with Bioconfirm v.B.07.00, Agilent Technologies).
Protein Data Bank accession codes.
The structures of non-irradiated and blue-light irradiated miniSOG have been deposited in the Protein Data Bank under entry codes 6GPU and 6GPV, respectively.References
1. Shu, X. et al. A genetically encoded tag for correlated light and electron microscopy of intact cells, tissues, and organisms. PLoS Biol.
9, e1001041 (2011).
2. Ryumina, A. P. et al. Flavoprotein miniSOG as a genetically encoded photosensitizer for cancer cells. Biochim. Biophys. Acta 1830, 5059–67 (2013).
3. Buckley, A. M., Petersen, J., Roe, A. J., Douce, G. R. & Christie, J. M. LOV-based reporters for fluorescence imaging. Curr. Opin. Chem. Biol. 27, 39–45 (2015).
4. Souslova, E. A., Mironova, K. E. & Deyev, S. M. Applications of genetically encoded photosensitizer miniSOG: From correlative light electron microscopy to immunophotosensitizing. J. Biophotonics 10, 338–352 (2017).
5. Makhijani, K. et al. Precision optogenetic tool for selective single- and multiple-cell ablation in a live animal model system. Cell Chem. Biol. 24, 110–119 (2017).
6. Salomon, M., Christie, J. M., Knieb, E., Lempert, U. & Briggs, W. R. Photochemical and mutational analysis of the FMN-binding domains of the plant blue light receptor, phototropin. Biochemistry 39, 9401–9410 (2000).
7. Swartz, T. E. et al. The photocycle of a flavin-binding domain of the blue light photoreceptor phototropin. J. Biol. Chem. 276, 36493–36500 (2001).
8. Drepper, T. et al. Reporter proteins for in vivo fluorescence without oxygen. Nat. Biotechnol. 25, 443–445 (2007). 9. Massey, V. The chemical and biological versatility of riboflavin. Biochem. Soc. Trans. 28, 283–296 (2000).
10. Losi, A. & Gärtner, W. The evolution of flavin-binding photoreceptors: an ancient chromophore serving trendy blue-light sensors. Annu. Rev. Plant Biol. 63, 49–72 (2012).
11. Baier, J. et al. Singlet oxygen generation by UVA light exposure of endogenous photosensitizers. Biophys. J. 91, 1452–1459 (2006). 12. Barnett, M. E., Baran, T. M., Foster, T. H. & Wojtovich, A. P. Quantification of light-induced miniSOG superoxide production using
the selective marker, 2-hydroxyethidium. Free Radic. Biol. Med. 116, 134–140 (2018).
13. Ruiz-González, R. et al. Singlet oxygen generation by the genetically encoded tag miniSOG. J. Am. Chem. Soc. 135, 9564–9567 (2013).
14. Pimenta, F. M., Jensen, R. L., Breitenbach, T., Etzerodt, M. & Ogilby, P. R. Oxygen-dependent photochemistry and photophysics of "miniSOG," a protein-encased flavin. Photochem. Photobiol. 89, 1116–1126 (2013).
15. Westberg, M., Bregnhøj, M., Etzerodt, M. & Ogilby, P. R. Temperature sensitive singlet oxygen photosensitization by LOV-derived fluorescent flavoproteins. J. Phys. Chem. B 121, 2561–2574 (2017).
16. Fritz, B. J., Matsui, K., Kasai, S. & Yoshimura, A. Triplet lifetimes of some flavins. Photochem. Photobiol. 45, 539–541 (1987). 17. Westberg, M., Bregnhøj, M., Etzerodt, M. & Ogilby, P. R. No photon wasted: an efficient and selective singlet oxygen photosensitizing
protein. J. Phys. Chem. B 121, 9366–9371 (2017).
18. Roeser, D., Schmidt, B., Preusser-Kunze, A. & Rudolph, M. G. Probing the oxygen-binding site of the human formylglycine-generating enzyme using halide ions. Acta Crystallogr. D Biol. Crystallogr. 63, 621–627 (2007).
19. Colloc’h, N. et al. Oxygen pressurized X-ray crystallography: probing the dioxygen binding site in cofactorless urate oxidase and implications for its catalytic mechanism. Biophys. J. 95, 2415–22 (2008).
20. Tanaka, F. et al. Donor−acceptor distance-dependence of photoinduced electron-transfer rate in flavoproteins. J. Phys. Chem. B 111, 5694–5699 (2007).
21. Yagi, K., Ohishi, N., Nishimoto, K., Choi, J. D. & Song, P.-S. Effect of hydrogen bonding on electronic spectra and reactivity of flavins. Biochemistry 19, 1553–1557 (1980).
22. Raffelberg, S., Mansurova, M., Gärtner, W. & Losi, A. Modulation of the photocycle of a LOV domain photoreceptor by the hydrogen-bonding network. J. Am. Chem. Soc. 133, 5346–5356 (2011).
23. Westberg, M., Holmegaard, L., Pimenta, F. M., Etzerodt, M. & Ogilby, P. R. Rational design of an efficient, genetically-encodable, protein-encased singlet oxygen photosensitizer. J. Am. Chem. Soc. 137, 1632–1642 (2015).
24. Ahmad, I. & Vaid, F. H. M. Photochemistry of flavins in aqueous and organic solvents. In Flavins Photochemistry and Photobiology (eds Silva, E. & Edwards, A. M.) 13–40 (Cambridge: Royal Society of Chemistry, 2006).
25. Remucal, C. K. & McNeill, K. Photosensitized amino acid degradation in the presence of riboflavin and its derivatives. Environ. Sci. Technol. 45, 5230–5237 (2011).
26. Sikorska, E. et al. Spectroscopy and photophysics of lumiflavins and lumichromes. J. Phys. Chem. A 108, 1501–1508 (2004). 27. Valerón Bergh, V. J., Bruzell, E., Hegge, A. B. & Tønnesen, H. H. Influence of formulation on photoinactivation of bacteria by
lumichrome. Pharmazie 70, 574–580 (2015).
28. Walrant, P. & Santus, R. N‐formyl‐kynurenine, a tryptophan photooxidation product, as a photodynamic sensitizer. Photochem. Photobiol. 19, 411–417 (1974).
29. Fukunaga, Y., Katsuragi, Y., Izumi, T. & Sakiyama, F. Fluorescence characteristics of kynurenine and N’-formylkynurenine. Their use as reporters of the environment of tryptophan 62 in hen egg-white lysozyme. J. Biochem. 92, 129–141 (1982).
30. Krishna, C. M. et al. A Study of the photodynamic efficiencies of some eye lens constituents. Photochem. Photobiol. 54, 51–58 (1991). 31. Endres, S. et al. An optogenetic toolbox of LOV-based photosensitizers for light-driven killing of bacteria. Sci. Rep. 8, 1–14 (2018). 32. Nonell, S. & Braslavsky, S. E. Time-resolved singlet oxygen detection. Methods Enzymol. 319, 37–49 (2000).
33. Rodríguez-Pulido, A. et al. Assessing the potential of photosensitizing flavoproteins as tags for correlative microscopy. Chem. Commun. 52, 8405–8408 (2016).
34. Nurizzo, D. et al. The ID23-1 structural biology beamline at the ESRF. J. Synchrotron Radiat. 13, 227–238 (2006).
35. de Sanctis, D. et al. ID29: a high-intensity highly automated ESRF beamline for macromolecular crystallography experiments exploiting anomalous scattering. J. Synchrotron Radiat. 19, 455–461 (2012).
36. Kabsch, W. XDS. Acta Crystallogr. D Biol. Crystallogr. 66, 125–32 (2010).
37. McCoy, A. J. et al. Phaser crystallographic software. J. Appl. Crystallogr. 40, 658–674 (2007).
38. Vagin, A. A. et al. REFMAC5 dictionary: organization of prior chemical knowledge and guidelines for its use. Acta Crystallogr. D Biol. Crystallogr. 60, 2184–95 (2004).
39. Emsley, P., Lohkamp, B., Scott, W. G. & Cowtan, K. Features and development of Coot. Acta Crystallogr. D Biol. Crystallogr. 66, 486–501 (2010).
We thank Rubén Ruiz-González, Marjolaine Noirclerc-Savoye and David von Stetten for their contribution at an early stage of the project. The ESRF is acknowledged for access to beamlines and facilities for molecular biology
via its in-house research program. AR acknowledges funding from the French Agence Nationale de la Recherche
(project SOxygen, ANR-11-JSV5-0009 and project CrystalBall, ANR-14-CE06-0005-02), from the Spanish Ministerio de Economía y Competitividad (CTQ2016-78454-C2-1-R, MAT2015-66605-P and SEV-2016-0686) and the Fundació la Marató de TV3 (grant No. 20133133). This work used the platforms of the Grenoble Instruct-ERIC Center (ISBG: UMS 3518 CNRS-CEA-UGA-EMBL) with support from FRISBI (ANR-10-INBS-05-02) and GRAL (ANR-10-LABX-49-01) within the Grenoble Partnership for Structural Biology (PSB).
Author Contributions
J.T. performed and analyzed the spectroscopic and photophysical investigations. C.L., S.A., G.G. and A.R. performed and analyzed the structural work. L.S. performed and analyzed the mass spectrometry experiments. C.F. and X.S. participated to the discussion of the data. S.N., G.G. and A.R. designed the study, discussed the data and wrote the manuscript with J.T. and C.F.
Additional Information
Supplementary information accompanies this paper at https://doi.org/10.1038/s41598-019-38955-3.
Competing Interests: The authors declare no competing interests.
Publisher’s note: Springer Nature remains neutral with regard to jurisdictional claims in published maps and
institutional affiliations.
Open Access This article is licensed under a Creative Commons Attribution 4.0 International
License, which permits use, sharing, adaptation, distribution and reproduction in any medium or format, as long as you give appropriate credit to the original author(s) and the source, provide a link to the Cre-ative Commons license, and indicate if changes were made. The images or other third party material in this article are included in the article’s Creative Commons license, unless indicated otherwise in a credit line to the material. If material is not included in the article’s Creative Commons license and your intended use is not per-mitted by statutory regulation or exceeds the perper-mitted use, you will need to obtain permission directly from the copyright holder. To view a copy of this license, visit http://creativecommons.org/licenses/by/4.0/.