HAL Id: hal-01025483
https://hal.archives-ouvertes.fr/hal-01025483
Submitted on 17 Jul 2014HAL is a multi-disciplinary open access archive for the deposit and dissemination of sci-entific research documents, whether they are pub-lished or not. The documents may come from teaching and research institutions in France or
L’archive ouverte pluridisciplinaire HAL, est destinée au dépôt et à la diffusion de documents scientifiques de niveau recherche, publiés ou non, émanant des établissements d’enseignement et de recherche français ou étrangers, des laboratoires
Optical interferometry and adaptive optics of bright
transients
Florentin Millour, Olivier Chesneau, Anthony Meilland, Nicolas Nardetto
To cite this version:
Florentin Millour, Olivier Chesneau, Anthony Meilland, Nicolas Nardetto. Optical interferometry and adaptive optics of bright transients. Hot-wiring the transien Universe 3, Nov 2013, Santa Fe, United States. will be set by publisher. �hal-01025483�
Optical interferometry and adaptive optics of
bright transients
Florentin Millour, Olivier Chesneau, Anthony Meilland, Nicolas Nardetto Lagrange Laboratory, UMR7293, Universit´e de Nice Sophia-Antipolis, CNRS, Observatoire de la Cˆote dAzur, Bd. de l’Observatoire, 06304 Nice, FRANCE.
Send comments to fmillour@ oca. eu
1
Introduction
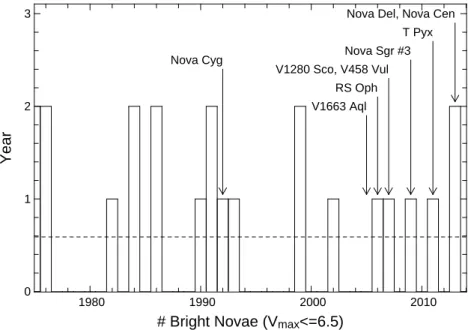
Bright optical transients (i.e. transients typically visible with the naked eye) are populated mainly by novæ eruptions plus a few supernovæ (among which the SN1987a event). Indeed, usually one bright nova happen every two year, either in the North or the South hemisphere (see Fig. 1). It occurs that current interferometers have matching sensitivities, with typically visible or infrared limiting magnitudes in the range 5–7. The temporal development of the fireball, followed by a dust formation phase or the appearance of many coronal lines can be studied with the VLTI. The detailed geometry of the first phases of novæ in outburst remains virtually unexplored. This paper summarizes the work which has been done to date using mainly the Very Large Telescope Interferometer.
We invite the reader to have a look to the extensive review on the topic by Chesneau & Banerjee (2012) for a complete description of the science on transients that can be achieved with optical/infrared long-baseline interferometers. We give a short summary of the content of this paper in the next section.
2
Why observing novæ with optical
interferome-ters?
Optical interferometers represent a breakthrough in terms of spatial resolution, that can provide crucial information related to the nova phenomenon. All targets in the 3-5 kpc range can be potentially resolved by current interferometers (CHARA, VLTI, NPOI).
The VLT Interferometer can provide measurements of the angular diameters of the nova ejecta in continuum and lines, from the near-IR to the mid-IR in the very first moments of the outburst. The primary outcome of these observations is a direct
estimate of the expansion parallax, thus the distance to novæ. Of importance is the possibility to spatially and spectrally resolve different near-IR emission lines to estimate the physical conditions throughout the wind and the ejecta. For those objectives, the medium spectral resolution of the near-IR instrument AMBER is an asset. If the nova appears to form dust (CO novæ ), an in-depth study of the dust forming regions can be carried out with the MIDI instrument. Using a set of flexible observing runs, we shall follow the outburst from the first days up to several months.
Nova Del, Nova Cen T Pyx Nova Sgr #3 V1280 Sco, V458 Vul RS Oph V1663 Aql Nova Cyg 1980 1990 2000 2010 0 1 2 3
# Bright Novae (Vmax<=6.5)
Year
Figure 1: Typical frequency of bright novæ from 1975 to 2013. About one nova every two years occurs, either in the North or South hemisphere2. V1663 Aql & V458 Vul
do not appear in this plot as too faint in V (but bright in K). The average rate per year is plotted as a dashed line. The arrows show Novæ observed with optical interferometers.
3
Nova as a spherical fireball
Up to now, the program of observations has focused on novæ with magnitudes reach-able by the VLTI (South declination & K magnitude ≥ 7). Past observations and
1data from http://www.cbat.eps.harvard.edu/nova_list.html, complemented by data from http://asd.gsfc.nasa.gov/Koji.Mukai/novae/novae.html . Some peak magnitudes were cor-rected using AAVSO data.
2data from http://www.cbat.eps.harvard.edu/nova_list.html, complemented by data from http://asd.gsfc.nasa.gov/Koji.Mukai/novae/novae.html . Some peak magnitudes were cor-rected using AAVSO data.
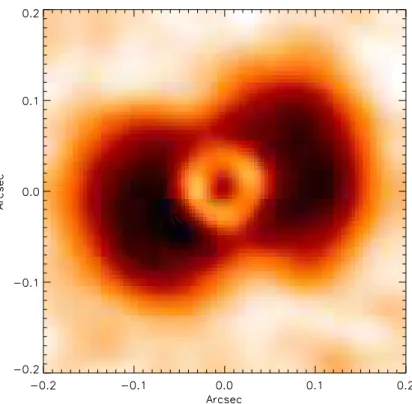
theoretical work on the nova phenomenon have provided a substantial knowledge about the physical nature of these binary systems and the outburst. However, these investigations are naturally limited by the difficulty of estimating the distance, which is usually inferred indirectly and with large errors. Spherical symmetry is a basic tenant adopted in the derivation of relationships that link the non-spatially resolved photometric and spectroscopic observations to the physical parameters of the sys-tem (Gehrz et al. 1998, Table 3). Spherical symmetry is implicitly assumed when the uv coverage is not sufficient to perform a better analysis. This was the case for the Nova V1280 Sco (Chesneau et al. 2008) which was also observed exclusively using 2 telescope recombination. Two years after, observations with the AO system NACO mounted at the UT4 telescope revealed an impressive dusty bipolar nebula (Chesneau et al. 2012, see Fig. 2).
Figure 2: 2010 NACO K band image after a PSF subtraction revealing the impres-sive bipolar nebula. Mid-IR images also show that there is no dust emission in the equatorial plane.
4
A Bipolar fireball from the first blink
An interferometer is mainly sensitive to the angular size of a nova in its early stages. Measuring the size of the fireball in different orientations on-sky allows us to infer the axis ratio and orientation of an individual nova shell. This is relatively easy to obtain for a 3–6-telescopes interferometer. This was the case for the outburst of the recurrent nova RS Oph (Chesneau et al. 2007).
The highly collimated outflow from the RS Ophiuchi has been imaged by the HST (Bode et al. 2007) and in the radio (O’Brien et al. 2006). The AMBER observations showed that the jet was already existing 5.5 days after the discovery, and provided a unique view of radial-velocities which could afterwards complement the expansion rates derived by the HST and radio images (Ribeiro et al. 2009).
The signature of a bipolar jet in interferometric data is now well identified pro-vided that the emission lines are spectrally resolved (R∼1500). The famous nova T Pyx exhibited a spherical appearance in broadband PIONIER data, but the signa-ture of a bipolar kinematics was clearly detected in our spectrally resolved AMBER data (Chesneau et al. 2011). The numerous peculiarities of the T Pyx eruptions can be explained in the frame of recurrent nearly face-on eruptions that launch fast ma-terial in the line-of-sight and slow mama-terial perpendicular to it, building up the slow expansion shell imaged by the HST.
5
Intermediate Luminosity Optical Transients
Intermediate-Luminosity Optical Transients (ILOTs), are eruptive stars with peak luminosity between those of novæ and supernovæ that have been also called Red Novæ or red Transient. The powering processes and whether they are due to binary interaction or are formed through single star evolution are debated. High angular resolution techniques can play a role by tracking bipolarity and the formation of disks. Furthermore, one can also study the remaining central star when a merger is highly suspected, for instance by detecting the deformation due to very high rotational rate.5.1
Sakurai’s object
In 1996, Sakurai’s object (V4334 Sgr) suddenly brightened in the center of a faint Planetary Nebula (PN). This very rare event was interpreted as being the reignition of a hot white dwarf that caused a rapid evolution back to the cool giant phase. From 1998 on, a copious amount of dust has formed continuously, screening out the star that remained embedded in this expanding high optical-depth envelope. Mid-IR interferometry performed in 2008 with the MIDI/VLTI instrument discovered a unexpectedly compact (30 40 milli-arc-second, 105 140 AU assuming a distance of
3.5 kpc), highly inclined, dust disk (Chesneau et al. 2009). The major axis of the disk is aligned with an asymmetry seen in the old PN. This implies that the mechanism responsible for shaping the dust envelope surrounding Sakurai’s object was already at work when the old PN formed, a strong argument for binary interaction.
5.2
V 838 Mon
V838 Monocerotis erupted in 2002, brightening by 9 magnitudes in a series of out-bursts, and eventually developing a spectacular light echo. A very red star emerged surrounded by copious amount of new dust that condensed from the expanding ejecta of the outbursts. V838 Mon is the close-by archetype of the ILOT sources which are triggering very active research currently. MIDI/VLTI observations obtained over the last few months showed that the dust resides in the form of a flattened structure (∼15-50 mas from 8 to 13 µm), i.e. a 90x300 AU flattened structure for a distance of 6.2 kpc (Sparks et al. 2008). The modelling of this extended structure is in progress but it is incomplete without a much better knowledge of the central source which is seen as a very cool M-L type super-giant. AMBER observations were also obtained in 2013 to measure the size of the central source, its shape (since it has potential to be a fast rotator) and study the cool photosphere / dusty disk transition. The AMBER data were essentially acquired with small baselines (≤ 30 m) and are quite noisy (σV2 ≈0.05), leading to an angular size of 3 mas, but with a large uncertainty.
We can basically only set an upper limit to the diameter of the HK-bands object, of 4.7 mas. This would make the HK-bands object smaller than 30 AU. This size (and shape) difference between the HK-bands and N band is striking and reminiscent of super-giant stars dusty disks (Millour et al. 2011; Wheelwright et al. 2012). Further AMBER observations would enable us to pinpoint more precise properties of this intriguing object.
6
Conclusion and prospectives
We presented here a few results from the VLTI campaigns on Novæ and ILOTs. These campaigns present a challenge in terms of scheduling and observatory response but provide unique insights on the early processes at stake when a nova explode. With the upcoming infrared instruments like MATISSE (Lopez et al. 2006) or GRAVITY (Eisenhauer et al. 2005), getting a finer idea of the geometry will be much faster than with current instruments. The development of visible interferometric instruments at the CHARA array or at the VLTI would also be an asset to get the sharpest multi-wavelength picture of these objects a few days after outburst before the advent of the ELT in the mid-2030s which will enable direct snapshot pictures of the fireball at 10’s-milli-arc-seconds resolution for a much larger number of novæ.
References
Bode, M. F., Harman, D. J., O’Brien, T. J., et al. 2007, ApJL, 665, L63
Chesneau, O. & Banerjee, D. P. K. 2012, Bulletin of the Astronomical Society of India, 40, 267
Chesneau, O., Banerjee, D. P. K., Millour, F., et al. 2008, A&A, 487, 223 Chesneau, O., Clayton, G. C., Lykou, F., et al. 2009, A&A, 493, L17
Chesneau, O., Lagadec, E., Otulakowska-Hypka, M., et al. 2012, A&A, 545, A63 Chesneau, O., Meilland, A., Banerjee, D. P. K., et al. 2011, A&A, 534, L11 Chesneau, O., Nardetto, N., Millour, F., et al. 2007, A&A, 464, 119
Eisenhauer, F., Perrin, G., Rabien, S., et al. 2005, Astronomische Nachrichten, 326, 561
Gehrz, R. D., Truran, J. W., Williams, R. E., & Starrfield, S. 1998, PASP, 110, 3 Lopez, B., Wolf, S., Lagarde, S., et al. 2006, in Society of Photo-Optical
Instrumen-tation Engineers (SPIE) Conference Series, Vol. 6268, Society of Photo-Optical Instrumentation Engineers (SPIE) Conference Series
Millour, F., Meilland, A., Chesneau, O., et al. 2011, A&A, 526, A107 O’Brien, T. J., Bode, M. F., Porcas, R. W., et al. 2006, Nature, 442, 279 Ribeiro, V. A. R. M., Bode, M. F., Darnley, M. J., et al. 2009, ApJ, 703, 1955 Wheelwright, H. E., de Wit, W. J., Oudmaijer, R. D., & Vink, J. S. 2012, A&A, 538,