HAL Id: hal-00850570
https://hal.archives-ouvertes.fr/hal-00850570
Submitted on 7 Aug 2013HAL is a multi-disciplinary open access archive for the deposit and dissemination of sci-entific research documents, whether they are pub-lished or not. The documents may come from teaching and research institutions in France or abroad, or from public or private research centers.
L’archive ouverte pluridisciplinaire HAL, est destinée au dépôt et à la diffusion de documents scientifiques de niveau recherche, publiés ou non, émanant des établissements d’enseignement et de recherche français ou étrangers, des laboratoires publics ou privés.
different superplasticizers
Mathieu Neuvile, Georges Bossis, Jacques Persello, O. Volkova, Pascal
Boustingory, Martin Mosquet
To cite this version:
Mathieu Neuvile, Georges Bossis, Jacques Persello, O. Volkova, Pascal Boustingory, et al.. Rheology of a gypsum suspension in the presence of different superplasticizers. Journal of Rheology, American Institute of Physics, 2012, 56 (2), pp.435. �10.1122/1.3693272�. �hal-00850570�
Title of the article:
Rheology of a gypsum suspension in the presence of different superplasticizers.
Authors:
M. Neuville
TOTAL, Solaize Research Center, BP 22, 69360 Solaize Cedex, France
G. Bossis, J. Persello and O.Volkova
LPMC, UMR 6622, University of Nice, Parc Valrose, 06108 Nice Cedex 2, France
P. Boustingory
CHRYSO R&D, 7 rue de l'Europe, 45300 Sermaises, France
M. Mosquet
LAFARGE Centre de Recherche 95 rue du Montmurier - BP 15, 38291 Saint Quentin Fallavier,France
ABSTRACT
In this work, the rheological properties of suspensions of micron-sized gypsum particles dispersed in water were studied in the presence of different fluidizer molecules. The yield stress and the shear moduli were measured versus the volume fraction in the presence of these molecules. Using the same polyelectrolyte with different molecular weights we investigated the dependence of yield stress versus the gyration radius of the polymer; also different sizes of the gypsum particles allowed to check the size dependence of the yield stress. A particular attention was brought to the change of the thickness of the polymer layer with the volume fraction. From a model, which relates the steric interaction between the two polymer layers to the yield stress and shear modulus, we have found an important compression of the polymer layer with the volume fraction. At higher volume fractions we observed a dynamic jamming transition at a critical volume fraction of 0.485 which does not depend on the presence of the fluidizer molecule. Unexpectedly the fluidizer makes this transition to happen at lower shear rates although the yield stress has disappeared.
I. INTRODUCTION
Superplasticizers are polyelectrolytes which adsorb at the surface of the particles and form a soft steric barrier which separates the particles and decreases the attractive forces between them. They are extensively used in cement and plaster formulations. Because of their industrial importance most of the works dealing with superplasticizers are devoted to their inteaction with cement slurries despite the complexity of these systems. In this paper we shall adress the effect of these molecules on suspensions of gypsum particles in water with controlled pH and ionic concentration of calcium. A widely used polyelectrolyte is based on polycarboxylates polymers (PCP) composed of non adsorbing side chains like polyethylene oxide which can extend in the solvent and then give this steric repulsion [Yamada et al.
(2000); Plank et al. (2009)] whereas the polymethacrylate backbone adsorbs by exchanging its sodium counter-ions with the calcium of the gypsum particles. The repulsion force induced by the polyelectrolyte can be measured by AFM technique between a spherical probe and a plate of the same composition. For instance this technique was applied for silica in the presence of polyethylene oxide where electrosatic repulsion was shown to be dominant [Giesbers et al. (1998)] whereas on MgO in the presence of a comb like polyelectolyte, the steric repulsion dominates the electrostatic one [Kauppi et al.
(2005)]. The thickness of the adsorbed layer is a key parameter since a large extension in the solvent should decrease the attractive force between the particles and then facilitate the destruction of the agregates under shear. This thickness, which can be directly measured by AFM, is usually in the range of 2 to 5nm for PCP of different molar mass [Houst et al. (2008)]. The thickness of the adsorbed layer of PCP on the surface of gypsum particles can also be determined by X-ray photo spectroscopy technology (XPS) equipped with Ar-ion etching analyzer [Peng et al. (2005)] but in the absence of the solvent, which can strongly alterate the results. One issue is the constancy of this thickness when the volume fraction increases because, if it shrinks, then its efficiency will decrease at high volume fraction whereas we need exactly the opposite behavior. In concentrated suspensions the thickness of the polymer layer can vary due to the reduction of the free volume between particles. Kapur et al. (1997) introduced a decreasing value of the thickness with the volume fraction in order to fit their experimental results for the yield stress.
Prestidge and Tadros (1988) have deduced the thickness of polyethlene oxide chains grafted on latex particles from a fit of the viscosity with the hard sphere model of Krieger-Dougherty and an effective packing fraction including the thickness of the polymer. In that way, they found an important decrease of the thickness with the volume fraction; nevertheless the hard sphere approximation for the grafted polymer layer is questionable. On the other hand, for metal oxide particles which were electrostatically stabilized, [Zhou et al. (1999)] found that, if the yield stress at different pH was normalized by the maximum yield stress corresponding to the isoelectric pH, then this normalized yield stress did not
change too much with the volume fraction for different pH. Then from Debye-Huckel theory they could deduce a constant separation distance corresponding to the primary minimum of floculation. In the case of sterically stabilized particles, the separation distance between particles is more likely to change with the volume fraction due to the softer repulsive force and to the increase of attractive Van der Waals forces related to the increase of the coordination number.
There is, of course; no direct measurement of the layer thickness at high volume fraction, but it can be deduced from rheological mesurements of the yield stress or of the shear modulus, since these quantities strongly depend on the interaction forces between the particles. The quasi static shear modulus and the high frequency shear modulus are also directly related to the interaction potential [Russel et al. (1989); Tadros et al. (1996) ] but there are very few attempts to link these quantities to the thickness of the adsorbed layer. In this paper we use these models for a polydisperse suspension in order to compare the evolution of the thickness of the polymer layer obtained respectively from the yield stress and of the quasi static shear modulus. In this case the separation distance should be the only parameter of the model, contrary to the model developped by [Flatt and Bowen (2006)] where several parameters can be used but the separation distance was supposed to be constant with the volume fraction.
The materials were based on a suspension of gypsum particles and are described in section I together with the polyelectrolytes. In section II we describe the techniques used to measure the yield stress and the shear modulus. In section III the results concerning the yield stress and the shear modulus versus the volume fraction for different polyelectrolytes are presented together with the evolution of the thickness of the polymer layer deduced from these measurements. The section IV is devoted to the high volume fraction domain where we can observe jamming transitions.
II. EXPERIMENTAL
A. Materials
We started from Lubbenau gypsum particles with an average diameter of 75µm. After being grounded the sizes in volume of the particles are contained between 1 and 20µm as obtained from Malvern mastersizer (cf. Fig.1(a)). We shall see in the next section that the yield stress is evaluated from the surface of contact between particles, so the size distribution in surface (Fig.1(b)) is more important than the surface distribution in volume. As expected the weight of the smallest particles is enhanced in the
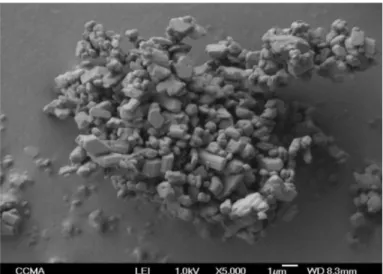
case of the surface distribution. A picture obtained by electronic microscopy (Fig.2) shows that the shapes of the particles are quite irregular with several flat facets; we shall also take this feature into account for the model of Van Der Waals interactions.
We have used three kind of polyelectrolytes. The first one is a polyanion naphtalene sulfonate (PNS) with a molecular weight of 251 g/mol per basic unit and the sulfonate groups in β position on the naphtalene; the counter ion is sodium at 93% and Ca at 7%. The average molecular mass was 10000g/mol. The second one, called PCP, is a comb like polymer with the skeleton made of polymethacrylate and the lateral chains are polyoxyethylene units with a molecular weight of 2000g/l. Its counter ion is sodium at 98% the average molar mass of the molecule is 27000g/mol and in average we have 10 lateral chains per molecule and 55 basic units on the polymethacrylate chain. The last one is a polyphosphonate polyoxyethylene (called PPP) with two charged groups PO3 at one extremity and a polyoxyethylene chain of variable length: PPP88, PPP1000, PPP2000, PPP3000 corresponding respectively to 2, 23, 45, 68 oxyethylene groups.The values of the gyration radii of PNS and PCP where measured by capillary rheometry in the dilute regime, they are respectively 4.5nm at 0.5g/l for the PNS and 7nm at the same concentration for PCP. Note that these values will change with the concentration of the polyelectrolytes and with the calcium concentration, since calcium will exchange with sodium conuter ions. An other important parameter to model the interactions between the adsorbed layer of polymer is the Flory parameter. It is deduced from osmotic pressure measurements in the presence of calcium at the saturation concentration of gypsum. From the slope of Π/ρkT versus ρ we have obtained respectively 0.497 and 0.484 for the PNS and the PCP, showing that water is a better solvent for PCP than for PNS.
B Yield stress measurements
The measurement of yield stress in concentrated supensions is often not very reliable, in particular because of the possible slippage of the paste on the walls of the cell. In order to rule out this problem a special geometry called “vane geometry” can be used; in this geometry which is akin to cylndrical Couette geometry, the internal cylinder is replaced by two blades crossing at right angle in order to mininimize the sliding interface between the paste and the tool. Another popular technique is to make the measurements in the oscillatory regime while increasing the stress; if the strain remains very small (typically less than 0.001) during the stress ramp, the slippage is not effective and the sudden drop of the elastic modulus is associated to the yield stress. More classical ways consist simply in doing a stress ramp in cone and plate or plate-plate geometry and to extrapolate at zero shear rate the stress-shear rate curve. We present in Fig.3 typical curves obtained from these four methods for a suspension
of gypsum at 40% volume fraction. The first curve (Fig.3(a)) is obtained with the Vane geometry and using a technique presented by [Nguyen and Boger (1992)] where a ramp of shear rate is imposed and the stress is followed versus time. In this case the stress will increase during time and then passes through a maximum which corresponds to the yield stress (here 138 Pa). In the case of Fig.3(b) the suspension is placed between two disks and we apply a stress in oscillatory regime; the shear modulus remains constant, at a value of about 106 Pa and then drops suddendly above a stress of 136 Pa. The two last curves (Figs 3(c)-3(d)) are obtained with a ramp of stress for the plane-plane geometry and cone-plane geometry respectively. We remark that the value where the shear rate departs from zero is higher for the plane-plane geometry, but it is only due to the use by the software of a conversion factor between the torque and the stress which is only appropriated for a Newtonian fluid. For a more complex rheology the Mooney Rabinovitch equation should be used and the true yield stress is 3/4 of the one deduced from the stress-shear rate curve produced by the software. Taking into account this correction we get 131 Pa for the plane-plane geometry, to be compared with 133 Pa for the cone-plate geometry where no correction is needed since the shear rate is constant everywhere. Finally we see that the four measurements laid between 131 and 138Pa, so there is no apparent slippage on the wall of the rheometer. In the following all the measurements of yield stress were done with the disk geometry in oscillatory regime at a frequency of 5Hz.
III. Yield Stress - model and experiments
A- Size and gyration radius dependency at fixed volume fraction
The Yield stress of a suspension has its origin in the attractive forces between the particles which can form a percolating network throughout the suspension which will resist to a stress like a solid. The origin of the attractive force is more often the Van Der Waals forces between the particles. For two spheres of different diameters di and dj whose surfaces are separated by a distance, h, the attractive force is: ) d d d d ( h . 12A F j i j i 2 vdw ij =− + (1)
Where A is the Hamaker constant and h the separation between the two surfaces, which can, in a first approximation, be approximated by two times the gyration radius of the polymer adsorbed on the surface of the particles. Each particle is, in average, in contact with K(φ) particles, where K(φ) is the coordination number which depends on the volume fraction. The force appearing in Eq.(1) is a radial
force and, following the derivation of [Kapur et al. (1997)] , we need to consider its surface weighted projection on the axis of traction, which introduces a factor 1/6 ;then considering that we have to separate n particles per unit surface, we come to the following result: τy=n K(φ)F/6 . This number, n, is also the number of straight columns of particles that could be formed per unit surface: n=φ.d/v =(6/π).(φ/d2) where v is the average volume of a particle and d its average diameter. Finally, taking Eq.(1) for monodisperse particles, the yield stress is then given by:
2 y h d 24 A ) ( K πφ φ = τ (2)
We already see from this simple derivation that the yield stress will grow when the average size of particles will decrease. Here it predicts that the yield stress will grow as d-1, but, as we have seen in Fig.2, the particles are far from the spherical shape and present flat facets. If we consider that the interaction between two particles takes place between two flat surfaces with an effective surface of contact Seff rather independent on the size of the particles, then the Van der Waals force reads: F=A Seff/(6πh3) and the yield stress would grow as n, the number of particles that we need to separate per unit surface, that is to say as d-2 instead of d-1. In practice intermediate behaviors, closer to d-2, are often found [Kapur et al. (1997)]. The last point to notice is, of course, that the gap between the surfaces of the particles play a crucial role and that only a careful description of the different forces acting between two particles will allow to predict the yield stress (or inversely some parameters entering into the model can be obtained from the experimental yield stress).
We have carried out measurement of yield stress in order to check this dependence on the average diameter of the particles and also on the average separation distance by taking the same class of polymers (PPP) but with different chains lengths.
Firstly we compared the yield stress of three suspensions in water of the same gypsum particles presenting different average sizes (1.6µm, 2.6 µm, 7µm) obtained with different centrifugation velocities. Three volume fractions were used: 30%, 35%, 40%; the result is shown in Fig.4. The lines represent a power law fit. For the three volume fraction this power is -1 ±0.15 indicating that here the Van-Der Waals interaction between two rounded surfaces is more appropriated than the interaction between two planar surfaces.
Secondly we have measured the yield stress at a given volume fraction for the four different chains of PPP. The radius of gyration of these chains was estimated from the Napper formula: Rg=0.06 α (44n)1/2 where α is a coefficient equals to 1.3 for the polyoxyethylene chaín [Napper (1983); Ramachadran et al. (1998)] and n the numer of monomers. In any event the value of this coeffecient is not important since it is the exponent of the power law that we are looking for. The results are presented in Fig.5 for a volume fraction of 31% and a mass of polymer of 0.13% of the mass of particles. This proportion of polymer is
high enough to be at the adsorption plateau in all the cases. The experimental points are well fitted with a coefficient of 2 giving a dependence in 1/h2 , which, once again, is in agreement with Eq.(2). In this approach, we are at a given volume fraction and we considered that the polymer layer behave as a hard layer which just separates the particles by a given distance. Actually as the polymer layer is soft we can expect that the size of this barrier will decrease wihen the volume fraction will increase.
B Compression of the polymer layer from yield stress results
In industrial slurry the size distribution of particles can be very broad and a generalization of Eq.(2) to polydisperse suspensions is needed. This generalization was worked out by [Kapur et al. (1997)]; they generalized the equation of the monodisperse case by writing:
ij j ij i i y n K F 6 1
1
1
= τ (3)Where ni is the number of particles per unit surface with diameter di and Kij the number of spheres j
coordinated with a sphere i.
The expression for ni remains the same as for the monodisperse case: ni=(6/π).(φi/di2) but now φi=φSi is
the volume fraction of particles having their diameter inside a given interval around di and for Kij they
took the result of the work by [ Suzuki and Oshima (1985)]:
j i 2 j j i j i i ij d d 2 d d d ) d d ( S ) ( K 134 . 0 K + − + + φ = (4)
With Si being the fraction of surface of the solid phase whose diameter is in a given interval around di as obtained
from light scattering (Fig.1(b)). The value of K(φ) =36 φ/π for φ<0.47 is taken from [Suzuki et al. (1981)] In their derivation, Kapur et al supposed that the average separation between two surfaces decreases with the volume fraction and they took an expression derived from their experimental results:
h=9.5 h0 exp(-4.5φ) and introduced this dependence in the Van-Der-Waals expression (Eq.(1).
More recently [Flatt and Bowen (2006); Flatt and Bowen (2007)], on the basis of [Zhou et al. (1999] experimental results, did not consider a change of interparticle separation with the volume fraction but they introduce an effective “lost volume” created by association of pairs of particles. They end up with an expression of the yield stress given by:
) ( ) ( m max max 0 2 1 y Φ − Φ Φ Φ − Φ Φ = τ (5)
In this expression the prefactor m1 is related to the maximum of the attractive force and to the particle
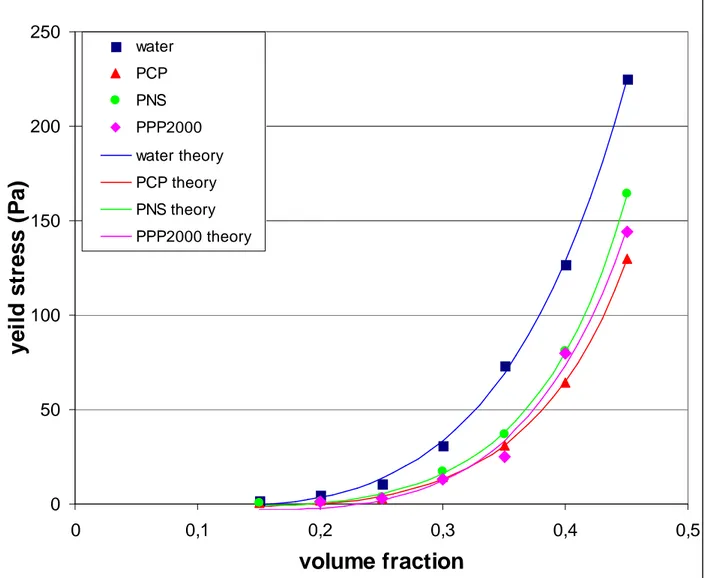
to the square of the separation betwen surfaces. The volume fraction Φmax corresponds to the maximum packing fraction of the powder and Φ0 is a percolation threshold where the yield stress appears. The experimental values of the yield stress versus volume fraction are presented in Fig.6 for a suspension of particles of average diameter 2.6µm .The upper curve corresponds to a suspension without fluidizer, below is the result obtained with PNS, next is PPP2000 and the lower one corresponds to PCP. It appears that the PCP is slightly more efficient than the two other ones to reduce the yield stress. The solid line is a fit of the preceeding equation with the Eq.(5) and the 3 parameters of the fit are reported in Table I. The value of φmax seems reasonable although we could expect a higher value for a polydisperse powder. For the percolating volume fraction, we note a lower value of the percolation threshold in the absence of fluidizer which is understandable since we expect less dense aggregates in the case of a quick and irreversible aggregation. The value of m1 depends on some approximations on the volume associated with pair of particles and we did not try to evaluate this parameter. Actually the approach we are using rests on the idea that it is the change of the separation distance with the volume fraction which explains the deviation of the yield stress or of the shear modulus from a φ2 dependance This is also true for the divergence of the viscosity at a given volume fraction which comes from the divergence of the lubrication force when the separation of two spheres tends to zero. The Van der Waals force (Eq. 1) does not take into account the presence of the polymer layer. In order to introduce the force due to the loss of entropy during the penetration of the two adsorbed polymer layers we follow the analysis of [Vincent et al. (1986)]. They took for the energy of interaction between two homopolymer chains:
6 2 a 4 1 m ) 2 h ( ) 2 1 ( 5 T k d 16 U φ −χ δ− δ ν π = (6)
In this equation d is the average diameter of the particles, χ the Flory parameter, ν1 is the molar volume of the
solvent molecule (in our case water), and δ the thickness of the adsorbed layer that we take equal to the gyration radius. Note that this equation holds if h>δ . Lastly φa is the average volume fraction of the segments of polymer
inside the layer. The total force will be the sum of the attractive Van Der Waals force Eq.(1) and of the repulsive polymer force given by the derivative of Eq.(6) with respect to h. At the equilibrium separation separation, h0, the attractive force equilibrates the repulsive one. When a shear strain is applied the elastic restoring force between the particles will grow and pass by a maximum which corresponds to the yield stress. We call hmax the separation corresponding to the maximum of this restoring force which reads: 22 3 4 55 6 7 + 22 3 4 55 6 7 − − δ χ − φ δ νπ = j i j i 2 max 5 max 2 a 4 1 ij max d d d d h 12A ) 2 h ( ) 2 1 ( 5 T k 96 F (7)
In this last equation we have replaced the average radius d/2 appearing in Eq.(6) by the same average radius as the one appearing in the Wan Der Waals force (cf Eq.(1)). Finally using this force and Eq.(4) for the coordination number, the yield stress (Eq.(3)) can be expressed as:
j i 2 j j i i i i j j j 2 max 5 max 2 a 4 1 y d d 2 d d d d S d S h 12A ) 2 h ( ) 2 1 ( 5 T k 96 ) ( K 011 . 0 + − + 22 3 4 55 6 7 − − δ χ − φ δ νπ φ φ π = τ
1
1
(8)As reported in section II-A, the Flory parameter was respectively equal to 0.497 and 0.484 for the PNS and the PCP. On the other hand for the Hamaker constant of the gypsum we took the value obtained by [Finot (1997)]: A=1.17 10-20 J. Lastly we have to determine φa ; first we fitted the adsorption curve by a
Langmuir model which gave us the energy of adsorption and the gyration radius of the adsorbed molecule; then from the adsorbed mass of polyelectrolyte at the adsorption plateau for a given mass of gypsum and a known surface S=10m2/g we obtained a coverage ratio of the surface by the polymer of 90% both for PNS and PCP that we identify with the value of φa . From the inflexion point of the total force Eq.(7) we can calculate hmax as
a function of δ and then with Eq.(8) the yield stress versus δ ; so knowing the experimental value of τy
we can then deduce the value of δ. The results are reported in Fig.7. We see that we have an important decrease of the thickness of the adsorbed layer from about 3nm at a volume fraction of 0.15 to less than 1nm at φ=0.45. This compression is accelerated in the region between 0.25 and 0.3. Note also that the behavior for the two polymers is very similar.
C. Compression of the polymer layer from shear modulus results
Another way to access to the interaction force between the surfaces of the particles is to measure the shear modulus which reflects the change of interactions forces with the strain. The measurements made at low strain (10-3) correspond to displacement in the nanometric range for particles of micrometric size, so this information is quite sensitive to the shape of the energy well close to its minimum. An expression of the shear modulus is obtained by equating the elastic energy: 0.5 G γ2 -where γ is the shear strain, γ =
δh/d, and G the shear modulus- to the increase of potential energy caused by the displacement δh=h-h0
[Russelet al. (1991)]:
( )
0 0 h h 2 2 2 h h 2 2 2 dh ) h ( U d d V N ) ( K ' G dh ) h ( U d h 5 . 0 ) h ( U = = φ = 8 δ = δ (9)Where N/V= 6 φ/(πd3) is the number of particles per unit volume and d=2a+h0 is the equilibrium distance between
two particles. The potential energy U(h) is the sum of the Van-Der-Waals energy and of the polymer repulsive energy: 6 2 a 4 1 j i j i ) 2 h ( ) 2 1 ( 5 T k d 16 d d d d h 12 A ) h ( U φ −χ δ− δ ν π − + = (10)
Still taking φa=0.9 for the volume fraction occupied by the adsorbed polymer we can calculate the second
derivative of the energy at the minimum of energy as a function of the thickness of the polymer layer,δ, for the average size of the particles (di=dj=d) and then deduce δ from Eq.(9) and the measurement of G’.
We have plotted in Fig.8 the value of the shear modulus G’ for a suspension of average size 2µm witout fluidizer, with PCP and with PNS versus volume fraction. The mass fraction of fluidizer was 0.5%. We have fitted these curves by a power law: G’(φ)=kφα, and we found respectively k=2.2 108, α=0.976 for pure water; k= 9.54 108 ,
α=7.99 for PCP and k=1.257 109 , α=7.78 for PNS. This high power for the increase of shear modulus with the volume fraction was found by other groups; for instance [Tadros (1996)] found a power between 5 and 8.
The values of δ predicted from the measurement of the yield stress are compared to those obtained from the shear modulus in Fig.9 both for PCP and PNS. We can see that the behavior is similar with a quite strong decrease for 0.1<φ<0.3 and a smallest compression at higher volume fraction. If both models gave the same layer thickness at high volume fraction, the shear modulus model predicted higher values at low volume fraction. The gyration radius of PCP measured by capillary rheometry is around 6nm which is coherent with the values obtained from G’ at low volume fraction, but not too much from the yield stress measurement. It is the contrary for the PNS, whose gyration radius is around 3nm and corresponds better to the one obtained from yield stress measurement. Actually at low volume fractions the predictions are more likely to fail because the interactions forces become lower and more sensitive to different factors not taken into account in this model like, for instance, the size distribution of the polymers or the possible inhomogeneity of the adsorbed polymer layer. Nevertheless it is worth noting that the very different behavior of the yield stress (which diverges as 1/(φmax-φ)) and of the shear modulus (which grows
as φα) with the volume fraction can be both represented with the same value of the separation distance between the particles in the range 0.25<φ<0.45 . This conforts the idea that the compression of the polymer with the volume fraction should be taken into account to analyse the change of yield stress or of the shear modulus with the volume fraction.
IV Shear thickening
Increasing the volume fraction not only increases the yield stress due to the increase of the number of contacts between the particles and to the decrease of the thickness of the polymer layer but also usually leads to shear
thickening and/or jamming phenomena.Two different types of shear thickening can be considered: in a first type ,which is quite general, there is a change of regime from shear thinning to shear thickening when hydrodynamic forces overcome Brownian forces, or in other words when the Peclet number becomes much larger than unity ; in this case the viscosity increases towards a limiting viscosity which is the one of a hard sphere suspension without Brownian motion [Brady and Bossis (1985)]. In the second type, we observe a sudden jump of stress at a critical shear rate or a sudden decrease of shear rate while increasing the stress. This kind of behavior, first described by [Hoffman (1982)] was attributed to an order-disorder transition. when the well organized structure of the flowing suspension was suddendly destroyed and transformed in rotating aggregates; it can occur in monodisperse suspensions where particles can arrange in planar layers flowing at different velocities. [Boersma et al. (1990)] have deduced a crirtical shear rate from the equality between a lubrication force (∝ηγ1a2/h) and a repulsive force,
which allows, through the dependency of h on the volume fraction, to relate the critical shear rate to the volume fraction. In polydisperse suspensions this transition is not always related to a clear order-disorder transition but rather to the creation of a network of particles which carries the stress as in a granular médium [Cates et al. (1998)]; these transient solid networks of particles give rise to stress or strain fluctuations which can show a regime with well defined oscillations [Lootens et al. (2003)]. The critical shear rate for which the solid network of particles will fill the cell and generate normal stresses depend on the size of the cell [Fall et al. (2008)].
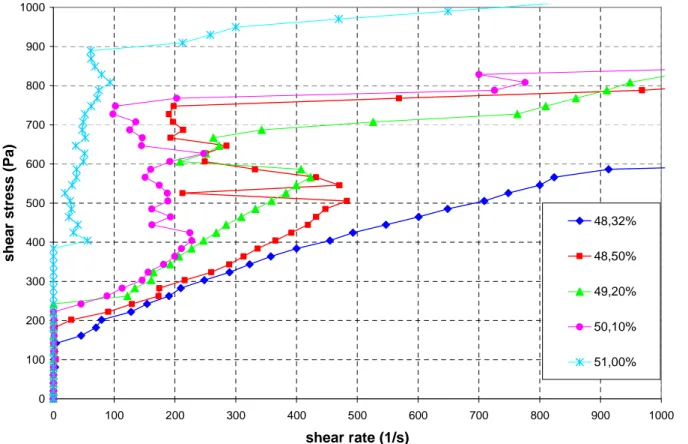
. We have studied this kind of behavior for a suspension of gypsum particles of average diameter 1µm and the shear stress versus shear rate are shown in Fig.10 for different volume fractions and whitout fluidizer molecules. The experiments have been done with a disk of diameter 35mm and a gap of 200µm. We can see in this figure that we can even have a decrease of shear rate although the stress is increasing and ,in some cases, the tool of the rheometer will be blocked and will stop to turn. This is interpreted as a transient jamming state where the particles have formed a percolating agregate on the compression axis which resists to the stress like a solid. This is a kind of yield stress but with the particles forming anisotropic structures which have been caused by the previous flow at higher shear rates. This dynamic jamming situation occurs above a critical volume fraction of 48.5±0.2%. In Fig.12 we have plotted the critical shear rate defined by its maximum before the decreasing regime- versus the volume fraction: it decreases almost linearly with a slope of 200s-1 per 1% volume fraction. It is also quite remarkable that the volume fraction is a more sensitive quantity than the yield stress since, between
φ= 48.3% and φ=50.1%, we pass from a non observable critical shear rate to a value of 500s-1 whereas the yield stress has only increased of 20%. Actually we could expect, that the higher will be the yield stress the lower will be the critical shear rate since attractive forces contribute to the aggregate formation. In general the passage from shear thining to shear thickening is the result of a subtle interplay between long range shear induced forces- which either break the aggregates which are on the extensional side or form them on the compressional side- and the short range forces which do not change of sign during the relative trajectrory of two particles. When Van Der Waals or other attractive forces become important the dynamics of aggregate formation on the compressional side is increased and can form percolating aggregates of particles which are in the primary minimum potential and likely in the conditions of solid friction. The solid friction prevents the sliding relative motion of particles inside these aggregates and favour their linear growing on the compressional axis instead of their compaction. With this
picture in mind for suspensions presenting a yield stress, we can understand that during a ramp of stress, first the aggregates will break, but when the suspension begins to flow, the shear induced forces will help the aggregates to reform and will block again the flow as observed in Fig.10. At constant imposed stress this mechanism will produce oscillations in the shear rate as often observed in these suspensions [Cates et al. (1998)]. The theories aiming to model this kind of rheological behavior usually introduce a dynamic variable whose time evolution is coupled to the stress in an arbritary way [Guillemet et al. (2002)]; this dynamical variable could perhaps be identified to the length of the aggregates whose particles are blocked by solid friction. The importance of solid friction in shear thickening was demonstrated in the work by D.Lootens et al [Lootens et al. (2005)] where they found that silica particles, treated with NaOH in order to increase their roughness, presented a lower critical shear rate than particles covered with surfactant molecules. Along this line we could expect that the addition of the fluidizer molecule will push the critical volume fraction and the critical shear rate of jamming to higher values. Actually it is not the case as can be seen in Fig.11 where we have used a mass fraction of PCP of 0.08% relatively to the mass of gypsum particles which corresponds to the adsorption plateau of PCP. Firstly we see that, thanks to the fluidizer molecule, the yield stress has disappeared for φ=48.5% and φ=50%, but nevertheless the shear thickening appears at the same volume fraction as without fluidizer and worse, the critical shear rate is now lower than without fluidizer. The critical shear rate is reported in Fig.12 for comparison with the absence of PCP; the change with volume fraction is still approximately linear but with a much lower slope. In the presence of PCP, even if the yield stress has disappeared, we are left with a high viscosity (η~5 Pa.s instead of 20mPa.s for hard spheres) which is likely due to sticky contacts between particles and we observe that the jamming at these two volume fractions is total (flow stop) and does not differ qualitatively from the one obtained at φ=54% where there is a high yield stress. We have seen in the previous section that the thickness of the polymer layer, was of the order of 1nm. A possible explanation is that, under flow, the compression of the PCP layer by shear forces, favour the formation of bridges between the two gypsum surfaces by a same polymer. From these observations we can conclude that the existence of a yield stress is not a necessary condition to observe a dynamic jamming but that strong attractive interactions reinforced by shear forces like solid friction or sticky interactions play a key role in this phenomenon.
V Conclusion
The use of different sizes of gypsum particles and of different fluidizer molecules : a comb like polymer: PCP, a polynaphtalene sulfonate (PNS) and four different lengths of the same polymer based on a phosphonate head and different lengths of the polyoxyethlene chain have allowed to confirm that the yield stress was varying as 1/(d.h2) where d is the average diameter of the molecule and h is the separation distance between the surfaces given by the polymer layer. The dependence of the yield stress and of the shear modulus on the volume fraction were modelled by a function φ2f(h(φ)) where the thickness of the polymer layer between two particles h(φ) was deduced from the respective measurement of the yield stress and of the shear modulus. The model of interparticle
force used in this derivation to obtain the function f(h) takes into account the size distribution of particles and the energy of interaction between the adsorbed polymer layers but does not contain any free parameter. Although the behaviour of the yield stress and shear modulus versus the volume fraction was very different from each other, we obtained the same values of h(φ) in the range 0.25<φ<0.45 showing a clear decrease of the separation distance with the volume fraction. In this range of volume fraction the PCP and PNS layers are quite similar and end up with 1nm thickness. At higher volume fraction, we observed a transient jamming at critical shear rates which are a decreasing function of the volume fraction. Adding more PCP does not prevent this jamming which appears at the same volume fraction: φ=0.485 but surprisingly, it appears at lower shear rates in the presence of fluidizer than without. The understanding of the behavior of the fluidizer molecules at high volume fraction still remains a challenge because on one hand the reproducibility of the experiments become more difficult to obtain and on the other hand, the increase of forces between two particles makes the interactions between the two polymer layers much more complex, not speaking about the possibility of polymer desorption or bridge formation between two particles which could be an explanation for the onset of jamming at lower shear rate in the presence of the PCP molecule.
ACKNOWLEDGEMENTS
REFERENCES
Boersma W. H., Laven J., Stein H.N. “Shear Thickening (Dilatancy) in Concentrated Dispersions » AIChE J., 36 (1990) 321
Brady, J. F. and Bossis, G. “The rheology of concentrated suspensions of spheres in simple shear flow by numerical simulation”. J. Fluid Mech. 155, 105-129 (1985).
Cates M.E., Wittmer, J.P., Bouchaud, J.Ph. and Claudin, Ph. Jamming, Force Chains and Fragile Matter.
Phys.Rev. Lett., 81, 1841-1844 (1998)
Fall A., Huang N., Bertrand F., Ovarlez G., Bonn D. “Shear Thickening of Cornstarch Suspensions as a Reentrant Jamming Transition” Phys. Rev. Lett. 100, 268302 (2008).
Finot E., « Mesures de forces intercristallines à l’origine de la prise du plâtre par microscopie à force atomique », Thèse de l’Université de Bourgogne, 1997, 216.
Flatt R.J., Bowen P., Yodel “A Yield Stress Model for Suspensions” J. Am. Ceram. Soc., 89 [4] 1244–1256 (2006)
Flatt R.J., Bowen P. “Yield stress of multimodal powder suspensions. An extension of the YODEL (Yield stress mODEL)” . J.Am.Ceram.Soc. 90(2007) 1038-1044
Giesbers M., Kleijn J.M., Fleer G.J., Cohen Stuart M.A. “Forces between polymer-covered surfaces: a colloidal probe study”, Colloids and surfaces A: Pysicochemal and Engineering Aspects 142 (1998) 343-353
Guillemet P., Adjari A., Bocquet L., Lequeux F. « Simple model for heteregeneous flows of yield stress fluids »Phys.Rev.E 66,051501(2002)
Hoffmann, R.L. “Discontinuous and dilatant viscosity be-havior in concentrated suspensions III. Necessary conditions for their occurrence in viscometric flows”. Advances in Colloid and Interface Sci. 17, 161-184 (1982)
Housta Y., Bowen P., Perche F., Kauppi A., Borget P., Galmiche L., Le Meins J-F, Lafuma F., Flatt R.J., Schober I., Banfill P. F.G., Swift D. S., Myrvold B. O., Petersen B.G., Reknes K. “Design and function of novel superplasticizers for more durable high performance concrete (superplast project)”Cement and Concrete Research 38 (2008) 1197–1209
Kapur P., Scales P., Boger D., Healy P., Yield stress of suspensions loaded with size distributed particles, American International Chemical, Engineering Journal, (1997), 43:1171
Kauppi A., Anderson K.M., Bergstrom L. “Probing the effect of superplaticizer adsorption on the surface forces using the colloidal probe AFM technique, Cem.Concre.Res. 35, (2005) 133-140
Lootens D., Van Damme H. and Hebraud P. “Giant Stress Fluctuations at the Jamming Transition” Phys. Rev. Lett. 90, 178301 (2003)
Lootens, D. Van Damme, H., Hémar, Y., Hébraud, P. “Dilatant flow of concentrated suspensions of rough particles » Phys. Rev. Lett. 95, 268302 (2005).
Napper D., “Polymeric stabilization of colloidal dispersions”, Academic Press, 1983.
Nguyen Q. and Boger D., “Measuring the flow properties of yield stress fluids”, Annual Review Fluid Mechanics, 24 (1992),47
Peng J., Qu J., Zhang J., Chen M., Wan T. “Adsorption characteristics of water-reducing agents on gypsum surface and its effect on the rheology of gypsum plaste3 Cem.Concre.Res. 35 (2005) 527–531
Plank J., Sachsenhauser B. “Exprimental determination of the effective anionic charge density of polycarboxylate superplasticizers in cement pore solution”, Cem.Concre.Res. 39, (2009) 1-5
Prestidge C. and Tadros Th.F., “Viscoelsatic properties of aqueous concentrated polystyrene latex dispersions containing grafted poly(ethylene oxide) chains” J. Colloid Interface Sci., 124 (1988) 660.
Ramachadran V., Malhotra V., Jolicoeur C. and Spiratos N., “Superplasticizers: properties and applications in conrete”, Ed. CANMET, Ottawa, Canada, 1998.
Russel W.B., Saville D.A., Schowalter W.R. “Colloidal dispersions”, Cambridge University Press, 1989 Russel W., Saville D., Schowalter W., Colloidal dispersions, Cambride University Press, Cambridge, UK, 1991.
Suzuki M., Makino K., Yamada M., Iinoya I., “A study on the co-ordination number in system of randomly packed, uniform sized spherical particles”, Int. Chem. Eng., 1981, 21:1-482.
Suzuki M., Oshima T. “Co-ordination number of a multi-component randomly packed, bed of spheres with size distribution”,Powder Technology 44 (1985) 213-218
Tadros Th.F. “Correlation of viscoelastic properties of stable and flocculated suspensions with their interparticle interactions” Advances in Colloid and Interface Science 68 (1996) 97-200
Tadros Th.F. “Correlation of viscoelastic properties of stable and flocculated suspensions with their interparticle interactions” Advances in Colloid and Interface Science 68 (1996) 97-200
Vincent B., Edwards J.S.E., Jones A; “Depletion floculation in dispersion of sterically stabilized molecules(“soft spheres”)” Colloids and Surfaces 18, (1986),261
Yamada K., Takahashi T., Hanehara S., Matsuhisa M. “Effects of the chemical structure on the properties of polycarboxylate-type superplasticizer” Cem.Concre.Res. 30, (2000) 197-207
Zhou Z., Solomon M.J., Scales P.J.and Boger D.V. “The yield stress of concentratedfloculated suspensions of size distributed particles J.Rheol. 43, (1999) 65-71
Figure captions
Fig. 1(a) Size distribution in volume of grounded gypsum particles
Fig. 1(b) Same particles but size distribution in surface
Fig. 2 View of gypsum particles by electronic microscopy
Fig.3. Comparison of different techniques for the measurement of the yield stress of a gypsum suspension with 40% volume fraction: a) Vane tool with a ramp from 0.1 to 100s-1; b) Plane-plane geometry (d=35mm) in oscillatory regime: logarithmic ramp of stress from 0.1 to 500Pa; c) same as b but in stationary regime; d) same as c but with a cone (diameter 35mm, angle 2°)
Fig.4 Yield stress versus average diameter of particles for three volume fractions of gypsum particles in water without fluidizer molecules
Fig.5 Yield stress versus the gyration radius of polymer PPP . The solid particle volume fraction was
φ=31% with an average diameter of 7µm and the mass fraction of polymer 0.13%. The solid curve is a power law fit with exponent -2.03
Fig 6. Yield stress of a suspension of gypsum particles with average diameter 2µm versus volume fraction of particles for fluidizer molecules PNS, PCP, PPP2000. Solid lines are fit of Eq.(5) whose parameters are given in table 1
Fig.7 Evolution of the thickness of the adsorbed layer of polymer (PCP and PNS) with the volume fraction of gypsum particles. The concentration of polymer was 0.5% in mass relatively to the mass of particles
Fig.8 Shear Modulus of a suspension of gypsum particles with average diameter 2.6µm versus volume fraction of particles. losanges: no fluidizer; squares :0.5% g/g PNS; dots: 0.5% g/g PCP
Fig.9 Thickness of the polymer layer versus the volume fraction for the PCP and PNS fluidizers obtained from yield stress measurement and from shear modulus measurement at 0.5% mass fraction of polymer.
Fig. 10. Rheogram of Gypsum particles, average diameter 1 µm, without fluidizer for different volume fractions
Fig.11 Stress ramp for a suspension of gypsum particles of average diameter 1 µm at different volume fractions with PCP (mass fraction 0.08%)
Table I: Parameters for the fit of the yield stress vs volume fraction with Eq.(5) Suspension m1 10 1max Water 328 0.112 0.599 PCP 300 0.196 0.637 PNS 310 0.189 0.613 PPP2000 555 0.233 0.692
Fig. 1(a): Size distribution in volume of grounded gypsum particles
Fig.1(b) Same particles but size distribution in
surface
Fig.3. Comparison of different techniques for the measurement of the yield stress of a gypsum suspension with 40% volume fraction: a) Vane tool with a ramp from 0.1 to 100s-1; b) Plane-plane geometry
(d=35mm) in oscillatory regime: logarithmic ramp of stress from 0.1 to 500Pa; c) same as b but in stationary regime; d) same as c but with a cone (diameter 35mm, angle 2°)
0 50 100 150 200 250 300 350 0 1 2 3 4 5 6 7 8
average particles size (µm)
y
ie
ld
s
tr
e
s
s
(
P
a
)
30% 35% 40% Série4Fig.4 Yield stress versus average diameter of particles for three volume fractions of gypsum particles in water without fluidizer molecules
Fig.5 Yield stress versus the gyration radius of polymer PPP . The solid particle volume fraction was
φ=31% with an average diameter of 7µm and the mass fraction of polymer 0.13%. The solid curve is a power law fit with exponent -2.03
0 50 100 150 200 250 0 0,1 0,2 0,3 0,4 0,5
volume fraction
y
e
il
d
s
tr
e
s
s
(
P
a
)
water PCP PNS PPP2000 water theory PCP theory PNS theory PPP2000 theoryFig 6: Yield stress of a suspension of gypsum particles with average diameter 2µm versus volume fraction of particles for fluidizer molecules PNS, PCP, PPP2000. Solid lines are fit of Eq.(5) whose parameters are in table 1
0 0,5 1 1,5 2 2,5 3 3,5 4 0,1 0,15 0,2 0,25 0,3 0,35 0,4 0,45 0,5 volume fraction δδδδ ( n m ) PNS PCP
Fig.7 Evolution of the thickness of the adsorbed layer of polymer (PCP and PNS) with the volume fraction of gypsum particles. The concentration of polymer was 0.5% in mass relatively to the mass of
1,E+02 1,E+03 1,E+04 1,E+05 1,E+06 1,E+07 0,1 volume fraction 1
G
'(
P
a
)
water PCP PNSFig.8 Shear Modulus of a suspension of gypsum particles with average diameter 2.6µm versus volume fraction of particles. losanges: no fluidizer; squares :0.5% g/g PNS; dots: 0.5% g/g PCP
0 1 2 3 4 5 6 7 0,1 0,15 0,2 0,25 0,3 0,35 0,4 0,45 0,5
volume fraction
δδδδ
(
n
m
)
PNS( from yield stress) PCP( from yield stress)
PNS(from elastic modulus) PCP(from elastic modulus)
Fig.9 Thickness of the polymer layer versus the volume fraction for the PCP and PNS fluidizers obtained from yield stress measurement and from shear modulus measurement at 0.5% mass fraction of polymer.
0 100 200 300 400 500 600 700 800 900 1000 0 100 200 300 400 500 600 700 800 900 1000 shear rate (1/s) sh ear st ress (P a) 48,32% 48,50% 49,20% 50,10% 51,00%
Fig. 10 Rheogram of Gypsum particles,average diameter 1 µm, without fluidizer for different volume fractions
0 200 400 600 800 1000 1200 1400 0 100 200 300 400 500 shear rate (s-1) s tr e s s ( P a ) 54% 50% 48% 48.5%
Fig.11 Stress ramp for a suspension of gypsum particles of average diameter 1 µm at different volume fractions with PCP (mass fraction 0.08%)
0 50 100 150 200 250 300 350 400 450 500 0,48 0,49 0,5 0,51 0,52 0,53 0,54 0,55