The Distribution, Abundance and Ecology of Mixotrophic
Algae in Marine and Freshwater Plankton Communities
by
Andrea Lynn Arenovski
B.S., University of North Carolina at Wilmington (1988)
Submitted to the Joint Committee for Biological Oceanography
in Partial Fulfillment of the Requirements for
the Degree of Doctor of Philosophy
at theMassachusetts Institute of Technology
and the
Woods Hole Oceanographic Institution
September 1994© 1994 Andrea L. Arenovski. All rights reserved.
The author hereby grants to MIT and WHOI permission to reproduce and distribute publicly paper and electronic copies of this thesis document in whole or in part.
Signature
of author... ... ...
Joint Program in Oceanography Massachusetts Institute of Technology/ f~ / Woods Hole Oceanographic Institution
Certified by . ... ... David A. Caron, Thesis Supervisor
Department of Biology Woods Hole Oceanographic Institution
Accepted
by...
... ... ...
. .... ...
Donald M. Anderson, Chairman Joint Committee for Biological Oceanography Massachusetts Institute of Technology/ Woods Hole Oceanographic InstitutionDistribution, Abundance and Ecology of Mixotrophic Algae in Marine and Freshwater Plankton Communities
by
Andrea Lynn Arenovski
Submitted in partial fulfillment of the requirements for the degree of Doctor of Philosophy
ABSTRACT
Mixotrophic algae are algae that combine photosynthesis with phagotrophy to satisfy nutritional requirements. Mixotrophic algae have been found to dominate the nanoplankton assemblage in some aquatic environments, and algal phagotrophy can account for a significant fraction of total bacterivory on occasion. The distribution and abundance of mixotrophic algae have not been widely characterized, however, and the factors that control their abundances and phagotrophic activity in aquatic environments are poorly understood. The vertical distribution and abundance of mixotrophic
nanoplankton was therefore documented in a variety of aquatic environments including the oligotrophic open ocean (Sargasso Sea), nine freshwater seepage ponds (Adirondack Mountains, NY) and three coastal salt ponds (Falmouth, MA) using epifluorescence microscopy and fluorescently labeled prey to trace ingestion by algae. Field experiments designed to examine the influence of prey density, nutrient availability and light intensity on mixotrophic nanoplankton abundances and their phagotrophic activity were also carried out to examine the adaptive significance of phagotrophy for mixotrophic algae in surface waters of the Sargasso Sea and in the epilimnion of one freshwater seepage pond.
Mixotrophic nanoplankton abundances in the Sargasso Sea ranged from less than a few cells ml-1 to more than 140 cells ml-1, and they were more abundant in surface waters. On two occasions mixotrophic algae comprised more than 50% of the total algal nanoplankton assemblage in surface waters. The results of field experiments indicate that phagotrophy may provide mixotrophic algae in surface waters of the Sargasso Sea with major nutrients and may enable them to compete with purely phototrophic algae during periods of low nutrient concentrations.
Mixotrophic nanoplankton abundances comprised a small fraction of the total algal nanoplankton (<5%) in most of the freshwater seepage ponds and in all three coastal salt ponds. Mixotrophic algae in the epilimnion of one freshwater pond,
however, accounted for -25% of the total algal nanoplankton, and Dinobryon dominated the mixotrophic nanoplankton in this pond (-2x10⁴ Dinobryon ml-1). Results from field experiments support the hypothesis that nutrient acquisition is an important secondary function for phagotrophy in Dinobryon, but that the primary function may be to provide essential growth factors.
Thesis Supervisor: David A. Caron, Associate Scientist, Woods Hole Oceanographic Institution
ACKNOWLEDGMENTS
Many people contributed to my growth as a scientist during my six years at WHOI and I am indebted to all of them for their support, guidance and encouragement. In particular, my thesis advisor Dave Caron deserves special thanks. Our discussions over the last three years never failed to provide me with encouragement and new
direction. I will always look back fondly on my graduate experience under his guidance. I am also grateful to my other committee members; Penny Chisholm, Paul Dunlap, Judy McDowell and Bob Sanders. Their comments greatly improved this thesis, and their encouragement throughout was invaluable to my professional development. Thanks also go to Lauren Mullineaux who served as Chair of the thesis defense proceedings and who provided me with the memory of a lifetime, a first hand view of the deep sea through the port holes of DSV Alvin. Brian Howes and John Teal also deserve thanks for guidance early on in my graduate career at WHOI.
Data for this thesis was generated through field sampling which would not have been possible without the assistance of several people. I would like to thank Jim Moffett, who made the work in the Sargasso Sea possible by providing me with laboratory space aboard the RV Endeavor during cruise leg 234. Carla Bold and Dave Hutchins are also thanked for their assistance in water collections during the cruise. Paul Bukaveckas was instrumental in carrying out the work in the Adirondacks. Paul
provided me with access to his study sites and a field laboratory in which to process samples. He also assisted in field experiments and data collection. His assistants, Kim Bowes and Bill Shaw are also thanked for their invaluable help in the field. The work in the coastal ponds would not have been possible without assistance from Brindha
Muniappan. Brindha's friendship and assistance in the field and the laboratory are greatly appreciated.
This thesis would also not have been possible without many, many hours spent filtering samples and enumerating cells in a dark microscope room. I would like to thank Ulrike Berninger and Ee lin Lim for guiding me through laboratory and
microscopy techniques, and for teaching me how to survive the "misery room". Linda Amaral Zettler and Mark Dennett were also very helpful in the lab and their friendship is
greatly appreciated. Members of the Howes' Lab; Susan Brown-Leger, Dave
Schlezinger, Richard Van Etten, Dave White and Tony Millham are also thanked for their friendship during my early years in the Howe's Lab and for assistance with nutrient analyses. Guidance and assistance with statistical analyses from Andy Solow and Vicki Starczak are also acknowledged.
I am deeply indebted to my friends and family. Their unending support and encouragement were essential in maintaining my sanity throughout graduate school. I especially want to thank Steve Shephard for his love and encouragement. I have drawn my strength from his companionship and never-ending confidence in me and for that I am eternally grateful. I also want to express my thanks to my Mom for all her
encouragement and her continuing faith in my abilities. Without her support none of this would have been possible. My brothers, Jay and Dan also deserve special thanks for their understanding and support. My friends provided the fun, exercise, discussion and much of the encouragement that were so necessary for my survival in Woods Hole. I particularly want to thank Liese Siemann, Susie McGroddy, Cheri Recchia and John Kokinos. We went through a lot together as friends, classmates and housemates and the memories will be with me always. Many others deserve mention here as well, but the list is long. I do want to thank my housemates Gary Jaroslow and Deana Erdner. They endured my moods in the final throes of writing and for this they deserve special medals! I also want to acknowledge the friendship of Stacy Kim and Kendall Banks and
everyone at Cape Cod Underwater Hockey. There are many other friends who also deserve thanks. I hope you know who you are!
Finally, I want to express my thanks to John Farrington and Jake Peirson for their guidance and support. Funding for this research was provided by the Education Office of the Woods Hole Oceanographic Institution, the Switzer Foundation, the Ocean Ventures Fund, the Bermuda Biological Station and the National Science Foundation (NSF grants BSR-8919447 & OCE 8818503).
TABLE OF CONTENTS ABSTRACT . ... ...3 ACKNOWLEDGMENTS ...5 LIST OF FIGURES ... ...9 LIST OF TABLES ... 13 CHAPTER 1. Introduction ... 15
References
...
23
CHAPTER 2. Mixotrophic Nanoplankton in Oligotrophic Surface Waters of the Sargasso Sea May Employ Phagotrophy to Obtain Major Nutrients ...27
Abstract
...
29
Introduction
...
30
Methods
. ... 34
Mixotrophic nanoplankton abundances during August 1989 ... 34
Vertical distribution of mixotrophic nanoplankton during April 1992 ... 36
Experimental examination of algal phagotrophy ...37
Results ...
39
Abundances and vertical distributions of mixotrophic nanoplankton ...39
Microbial population responses to manipulations of light, nutrients, and prey density ... 46
Discussion
...
52
Algal phagotrophy in surface waters of the Sargasso Sea ...52
Vertical distribution of mixotrophic nanoplankton in euphotic zone waters of the Sargasso Sea... 56
References
...
58
CHAPTER 3. Distribution and Abundance of Mixotrophic Nanoplankton in Nine Adirondack Seepage Ponds and Three Coastal Salt Ponds ...61
Abstract
...
63
Introduction
...
65
Methods
.
... 68
Study sites ...68
Physical characterization of ponds ... 68
Pigment analyses ... 69
Nutrient analyses ... 70
Determination of microbial population abundances ... 71
Statistics ... 73
R esults .... .... .... .. ...74
Freshwater Seepage Ponds ... 74
Coastal Salt Ponds ... 95
Discussion
...
109
Mixotrophic algae in Adirondack seepage ponds ... 109
Dinobryon in Wheeler Pond... 111
Mixotrophy in coastal salt ponds ... 112
References
...
115
CHAPTER 4. The Importance of Phagotrophy in the Nutrition of Mixotrophic Nanoplankton in an Adirondack Seepage Pond ... 121
Abstract
...
123
Introduction ...125
Methods ...129
Results
...
132
Discussion ... 41
Importance of mixotrophic unidentified solitary and colonial algae ... 141
Importance of phagotrophy in the nutrition of Dinobryon... 142
References ... 146
CHAPTER 5. Summary and Perspe c . tives ...149
References
...
159
LIST OF FIGURES
Figure Page
1.1 Summary of microbial food web trophodynamics ... 18 2.1 Vertical profiles of temperature, salinity, beam attenuation and
fluorescence in the Sargasso Sea at 25050'N, 64030'W on 1 April
and 30026'N, 6430'W on 3 April 1992 ... 41 2.2 Vertical distribution of phototrophic nanoplankton, heterotrophic
nanoplankton, chroococcoid cyanobacteria, bacteria and
mixotrophic nanoplankton absolute and relative abundance in the
Sargasso Sea on 1 April 1992 ...42 2.3 Vertical distribution of phototrophic nanoplankton, heterotrophic
nanoplankton, chroococcoid cyanobacteria, bacteria and
mixotrophic nanoplankton absolute and relative abundance in the
Sargasso Sea on 3 April 1992 ... 43 2.4 Vertical profiles of dissolved inorganic nitrogen and phosphorus
concentrations at the Bermuda Atlantic Time Series station at 31°N,
640W on 18 March and 12 April 1992 ... 45 2.5 Mean population abundances of phototrophic and heterotrophic
picoplankton and phototrophic, heterotrophic and mixotrophic
nanoplankton in all treatments at the end of Experiment I ...48 2.6 Mean population abundances of phototrophic and heterotrophic
picoplankton and phototrophic, heterotrophic and mixotrophic
nanoplankton in all treatments at the end of Experiment II...49 3.1 Vertical profiles of temperature in nine Adirondack seepage ponds
during July 1992 ... 76 3.2 Vertical profiles of light in nine Adirondack seepage ponds during
July 1992 ...77 3.3 Vertical profiles of % oxygen saturation in nine Adirondack
seepage ponds during July 1992...79
3.4 Vertical profiles of chlorophyll a concentration in nine Adirondack
seepage ponds during July 1992 ... 80 3.5 Correlations between DOC concentration and epilimnetic
concentrations of dissolved NH4+, P04- 3and total phosphorus for
nine Adirondack seepage ponds during July 1992 ... 82 3.6 Vertical profiles of bacterial abundance in nine Adirondack seepage
LIST OF FIGURES (continued)
Figure Page
3.7 Correlations between bacterial abundance and temperature, % of subsurface light and % oxygen saturation for nine Adirondack seepage ponds during July 1992...86 3.8 Correlation between bacterial abundance and heterotrophic
nanoplankton abundance for nine Adirondack seepage ponds during
July 1992 ...87 3.9 Vertical profiles of heterotrophic nanoplankton abundance in nine
Adirondack seepage ponds during July 1992 ... 88 3.10 Correlations between phototrophic nanoplankton abundance and
DOC concentration and epilimnetic phototrophic nanoplankton abundance and epilimnetic concentrations of dissolved NH4+, PO4- 3
and total phosphorus for nine Adirondack seepage ponds during
July 1992 ... 89 3.11 Vertical profiles of phototrophic nanoplankton abundance in nine
Adirondack seepage ponds during July 1992 ... 90 3.12 Vertical profiles of unidentified solitary and colonial phototrophic
nanoplankton and Dinobryon abundances in nine Adirondack
seepage ponds during July 1992 ...92 3.13 Vertical profiles of the relative abundance of mixotrophic
nanoplankton in nine Adirondack seepage ponds during July 1992 ...93 3.14 Vertical profiles of unidentified solitary and colonial mixotrophic
nanoplankton abundances and abundances of phagotrophically active Dinobryon in nine Adirondack seepage ponds during July
1992
.
... 94
3.15 Vertical profiles of temperature and salinity in three coastal saltponds in Falmouth, MA, during early summer 1993 ...96 3.16 Vertical profiles of light in three coastal salt ponds in Falmouth,
MA, during early summer 1993 ... 98 3.17 Vertical profiles of % oxygen saturation in three coastal salt ponds
in Falmouth, MA, during early summer 1993 ... 99 3.18 Vertical profiles of chlorophyll a and carotenoid concentrations in
LIST OF FIGURES (continued)
Figure Page
3.19 Vertical profiles of dissolved inorganic nitrogen and phosphorus concentrations in three coastal salt ponds in Falmouth, MA, during
early summer 1993 ... 102 3.20 Vertical profiles of bacterial abundance and heterotrophic and
phototrophic nanoplankton abundances in three coastal salt ponds in
Falmouth, MA, during early summer 1993 ... 104 3.21 Vertical profiles of mixotrophic nanoplankton absolute and relative
abundance in three coastal salt ponds in Falmouth, MA, during early
summer 1993 ... 106
3.22 Vertical distribution and abundance of heterotrophic and
mixotrophic ciliates and profiles of temperature, salinity and light
attenuation in Salt Pond on 17 July 1993 ...108 4.1 Final population abundances of bacteria and heterotrophic and
phototrophic nanoplankton in all treatments ... 136 4.2 Total combined abundance of nanoplanktonic phototrophs from
groups that were not phagotrophic and total abundances of
Dinobryon and unidentified solitary and colonial nanoplanktonic
algae for all treatments on the final day of the experiment ...138 4.3 Final percentages of phagotrophically active Dinobryon and relative
abundances of solitary and colonial nanoplanktonic algae in all
treatments ... 139 5.1 Hypothetical flow of energy and nutrients through a primarily
heterotrophic microbial food chain vs. flow through microbial food chains with mixotrophic nanoplankton or mixotrophic
LIST OF TABLES
Table Page
2.1 Population abundances of phototrophic and heterotrophic picoplankton and nanoplankton and the percent of phototrophic nanoplankton with ingested prey in euphotic zone waters at seven
stations in the Sargasso Sea during 1989 ... 40 2.2 Initial and final mean population abundances of phototrophic and
heterotrophic picoplankton and phototrophic, heterotrophic and
mixotrophic nanoplankton in controls from Experiments I and II ...47 3.1 Freshwater seepage pond and coastal salt pond surface areas, basin
depths and dissolved organic carbon concentrations (freshwater
ponds only) ... 75 3.2 Epilimnetic and hypolimnetic dissolved nutrient concentrations in
nine Adirondack seepage ponds during July 1992 ...83 4.1 Initial and final mean population abundances of bacteria and
heterotrophic and phototrophic nanoplankton in controls...1....33 4.2 Initial and final percentages of phagotrophically active Dinobryon
and relative abundances of unidentified solitary and colonial
mixotrophic nanoplankton in controls ... 34
5.1 Abundances of mixotrophic nanoplankton in marine and freshwater
CHAPTER 1
INTRODUCTION
Over the last two decades we have seen the emergence of a new paradigm of the planktonic food web (Pomeroy, 1974). The new paradigm recognizes a much larger role for minute algae in primary production than was previously thought, and includes an extension of the classical paradigm now known as the microbial food loop. The
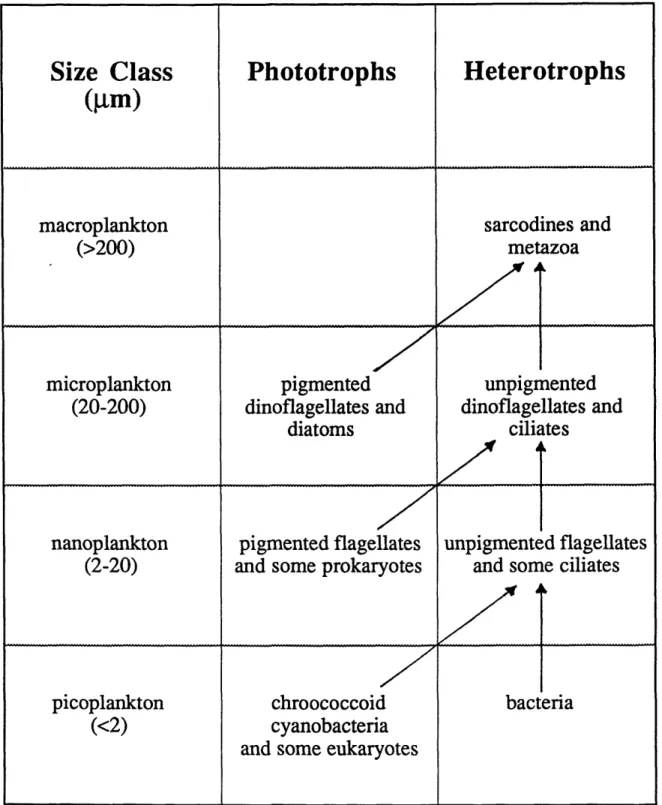
microbial loop incorporates microheterotrophic processes into the classical food web and is considered important in the cycling of energy and nutrients in planktonic ecosystems. It has become customary to summarize the trophodynamics in the microbial food web by clear distinctions between phototrophy and heterotrophy, and size-dependent predator-prey relationships (Fig. 1.1). Picoplanktonic and nanoplanktonic phototrophs
(prokaryotic and eukaryotic algae 0.2-2 gm and 2-20 gm in size, respectively) are now known to dominate the phytoplankton assemblage in many aquatic environments (Ilmavirta, 1982; Davis & Sieburth, 1984; Estep et al., 1984; Davis et al., 1985), and they are believed to account for a significant fraction of primary production (Malone,
1971; McCarthy et al., 1974; Larsson & Hagstr6m, 1982; Hagstr6m et al., 1983; Hannah & Boney, 1983; Joint et al., 1986). It is now believed that as much as 50% of primary production is consumed by picoplanktonic heterotrophs (bacteria 0.2-2 Jim in size), and that a large fraction of this production is converted into bacterial biomass rather than remineralized by the bacteria (Sorokin, 1971; Pomeroy, 1974; Sieburth et al., 1977; Larsson & Hagstr6m, 1979; Fuhrman & Azam, 1980; Williams, 1981; Azam et al.,
1983). Nanoplankton-sized (2-20 l.m) heterotrophic protists (flagellates and ciliates) are believed to be the major consumers of bacterial production (Sieburth, 1979; Sorokin,
1979; Fenchel, 1982c), and are thought to be responsible for much of the
remineralization and recycling of essential nutrients for phytoplankton and bacteria (Azam et al., 1983; Caron, 1984; Caron & Goldman, 1990). These nanoplanktonic bacterivores are grazed by larger protists which, in turn, may be consumed by larger
Size Class
Phototrophs
Heterotrophs
(gm)macroplankton
sarcodines and
(>200)
metazoa
microplankton
pigmented
unpigmented
(20-200)
dinoflagellates and
dinoflagellates and
diatoms
ciliates
nanoplankton
pigmented flagellates unpigmented flagellates
(2-20)
and some prokaryotes
and some ciliates
picoplankton
chroococcoid
bacteria
(<2)
cyanobacteria
and some eukaryotes
Figure 1.1. Summary of microbial food web trophic relationships as defined by size class
and nutritional mode.
I---
I-~~~~~
---,-IIZ
zooplankton thereby returning some fraction of the energy and nutrients from bacteria to the classical food web via flow through the microbial loop (Sherr & Sherr, 1984; Caron,
1991).
This modem view of microbial trophodynamics has provided a basis for better understanding energy and nutrient flow in planktonic systems. However, shortcomings associated with an approach that makes clear distinctions between phototrophy and heterotrophy have become apparent. In particular, it has become increasingly evident that many protists are capable of functioning at more than one trophic level. The rapid differentiation of phototrophic and heterotrophic plankton based on the presence or absence of plastids (Porter & Feig, 1980; Caron, 1983; Sherr & Sherr, 1983; Sherr et al.,
1993) has yielded useful information on the phototrophic abilities of protists, but new methods (Borsheim, 1984; Cynar & Sieburth, 1986; Wikner et al., 1986; Sherr et al.,
1987) have resulted in the discovery (or rediscovery) of planktonic protists that are capable of phagotrophy in addition to photosynthesis, and thus, function at more than one trophic level. Mixotrophy refers to the ability of these organisms to combine phototrophy with phagotrophy to satisfy nutritional requirements for growth and/or survival (Sanders, 1991).
The Sarcodinia and Ciliophora are examples of protistan taxa that have generally been considered to be heterotrophic. It is now known that some sarcodines and ciliates contain highly modified endosymbiotic algae that allow them to function primarily as autotrophs, while other species of sarcodines and ciliates are mixotrophic (Laval-Peuto & Brownlee, 1986; Peuto et al., 1986; Patterson & Diirrschmidt, 1987; Laval-Peuto & Rassoulzadegan, 1988; Stoecker et al., 1988; Rogerson et al., 1989; Stoecker et
al., 1989b). These latter mixotrophic species appear to sequester chloroplasts after
ingesting algal prey. The chloroplasts, which remain functional once inside the cells, allow the protists to function both phototrophically and phagotrophically (Lopez, 1979; Stoecker et al., 1987; Lee et al., 1988).
In addition, numerous species of plastidic flagellates from diverse taxa
(Chrysophyceae, Prymnesiophyceae, Cryptophyceae and Dinophyceae) have been found to be capable of particle ingestion (for summary of references see Sanders & Porter,
1988). The ability of algae to consume particulate organic material (usually bacteria and other small unicellular organisms) has been known for nearly a century. Until recently though, the ecological implications of this behavior have been largely ignored. Algal phagotrophy has gained renewed interest with recognition of the importance of microheterotrophic processes in planktonic food webs (Williams, 1981; Azam et al.,
1983) and methodological developments in the area of microbial ecology that allow direct differentiation of heterotrophic (apochlorotic) protists and phagocytic or nonphagocytic plastidic protists in natural samples.
Some investigations have focused on individual mixotrophic species to determine the role of phagotrophy in their nutrition. These investigations have provided
information to suggest that phagotrophy may play a variety of roles, including the acquisition of carbon, major nutrients (nitrogen and phosphorus) or specific growth factors such as vitamins or essential lipids (Kimura & Ishida, 1989; Sanders et al., 1990;
Caron et al., 1992; Nygaard & Tobiesen, 1993). Species that are capable of acquiring carbon via phagotrophy may experience a selective advantage over purely phototrophic algae in light limiting conditions, while acquisition of major nutrients (N or P) may be particularly advantageous to algae in oligotrophic environments.
Mixotrophic algae have been found to dominate the nanoplankton assemblage in some aquatic environments, and it is clear from a few field studies that algal
phagotrophy can occasionally contribute significantly to total bacterivory (Bird & Kalff, 1986; Porter, 1988; Bird & Kalff, 1989; Sanders et al., 1989; Berninger et al., 1992). Nevertheless, the distribution and abundance of mixotrophic algae have not been widely characterized in aquatic environments, and the factors that control their abundances in these environments are poorly understood. As a consequence, the ecological importance
of mixotrophy in the flow of energy and nutrients through planktonic food webs remains unclear.
The purpose of this dissertation was to further our understanding of the
importance of nanoplanktonic mixotrophic algae in aquatic ecosystems and to attempt to determine what factors influence their phagotrophic behavior in these environments. The dissertation is composed of 3 manuscripts which examine the relationships between the distribution and abundance of mixotrophic algae and physical, chemical and
biological parameters that may influence their abundance and phagotrophic activity in marine and freshwater plankton communities. The vertical distribution and abundance of mixotrophic nanoplankton at several stations in the Sargasso Sea, south of Bermuda, and the importance of phagotrophy in the nutrition of mixotrophic algae in surface waters is discussed based on the results of experimental manipulations are described in Chapter 2. Information on the density of picoplanktonic and nanoplanktonic phototrophs and heterotrophs throughout the euphotic zone at each station is also provided in this chapter.
Relationships between the abundance of mixotrophic algae and physical, chemical and biological parameters in a series of seepage ponds located in the Adirondack Mountains of New York and in a group of coastal salt ponds located in Falmouth, Massachusetts are examined in Chapter 3. The vertical distributions and abundances of mixotrophic algae are determined and their contribution to the total phototrophic nanoplankton is presented. Densities of heterotrophic bacteria and
nanoplankton are also considered in relation to the abundance of mixotrophic algae. In addition, the contribution of mixotrophic ("green") ciliates to ciliate populations in one coastal salt pond are discussed.
Finally, a study conducted in one of the Adirondack seepage ponds examined in the previous chapter is discribed in Chapter 4. Mixotrophic algae were found to be relatively abundant in the epilimnion of this pond. An experiment to determine the
factors that may control the abundance or phagotrophic activity of mixotrophic algae in this pond are discussed in Chapter 3. Specifically, the influence of light, major nutrients (N and P) and prey density on the phagotrophic activity of an abundant mixotrophic chrysophyte, Dinobryon along with other solitary and colonial mixotrophic
nanoplankton was examined.
The results from these studies indicate that mixotrophic nanoplankton can be numerically important in some aquatic environments. In addition, field experiments reported on in Chapters 2 and 4 provide the first evidence from the field to suggest that
REFERENCES
Azam, F., Fenchel, T., Field, J. G., Gray, J. S., Meyer-Reil, L. A. & Thingstad, F. 1983 The ecological role of water-column microbes in the sea. Marine Ecology Progress
Series 10, 257-263
Berninger, U.-G., Caron, D. A. & Sanders, R. W. 1992 Mixotrophic algae in three ice-covered lakes of the Pocono Mountains, U.S.A. Freshwater Biology 28, 263-272 Bird, D. F. & Kalff, J. 1986 Bacterial grazing by planktonic lake algae. Science 231,
493-495
Bird, D. F. & Kalff, J. 1989 Phagotrophic sustenance of a metalimnetic phytoplankton peak. Limnology and Oceanography 34, 155-162
Borsheim, K. Y. 1984 Clearance rates of bacteria-sized particles by freshwater ciliates, measured with monodispersed fluorescent latex beads. Oecologia 63, 286-288
Caron, D. A. 1983 Technique for enumeration of heterotrophic and phototrophic
nanoplankton, using epifluorescence microscopy, and comparison with other procedures.
Applied and Environmental Microbiology 46, 491-498
Caron, D. A. 1984 The role of heterotrophic microflagellates in plankton communities. Ph.D. thesis, Woods Hole Oceanographic Institution and Massachusetts Institute of Technology, WHOI-84-35.
Caron, D. A. 1991 Evolving role of protozoa in aquatic nutrient cycles. In Protozoa
and their role in marine processes vol. 25 (Reid, P. C., Turley, C. M. & Burkill, P. H.,
eds.). Springer-Verlag, Berlin. pp. 387-415.
Caron, D. A. & Goldman, J. C. 1990 Protozoan nutrient regeneration. In Ecology of
marine protozoa (Capriulo, G. M., eds.). Oxford University Press, New York. pp. 283-306.
Caron, D. A., Sanders, R. W., Lim, E. L., Marrasd, C., Amaral, L. A., Whitney, S., Aoki,
R. B. & Porter, K. G. 1992 Light-dependent phagotrophy in the freshwater mixotrophic
chrysophyte Dinobryon cylindricum. Microbial Ecology 25, 93- 111 Cynar, F. J. & Sieburth, J. M. 1986 Unambiguous detection and improved quantification of phagotrophy in apochlorotic nanoflagellates using fluorescent
microspheres and concomitant phase contrast and epifluorescence microscopy. Marine
Ecology Progress Series 32, 61-70
Davis, P. G., Caron, D. A., Johnson, P. W. & Sieburth, J. M. 1985 Phototrophic and apochlorotic components of picoplankton and nanoplankton in the North Atlantic: geographic, vertical seasonal and diel distributions. Marine Ecology Progress Series
21,
Davis, P. G. & Sieburth, J. M. 1984 Differentiation and characterization of individual phototrophic and heterotrophic microflagellates by sequential epifluorescence and
Estep, K. W., Davis, P. G., Hargraves, P. E. & Sieburth, J. M. 1984 Chloroplast
containing microflagellates in natural populations of North Atlantic nanoplankton, their identification and distribution; including a description of five new species of
Chrysochromulina (Prymnesiophyceae). Protistologia 20, 613-634
Fenchel, T. 1982 Ecology of heterotrophic microflagellates. IV. Quantitative
occurrence and importance as bacterial consumers. Marine Ecology Progress Series 9, 35-42
Fuhrman, J. A. & Azam, F. 1980 Bacterioplankton secondary production estimates for coastal waters of British Columbia, Antarctica, and California. Applied and
Environmental Microbiology 39, 1085-1095
Hagstrim, A., Andersson, A. & Oquist, G. 1983 Algal and bacterial production in a coastal area (Norrbyn) of the Bothnian Sea. Aquilo Ser Zool 22, 131-137
Hannah, F. J. & Boney, A. D. 1983 Nanophytoplankton in the firth of Clyde, Scotland: seasonal abundance, carbon fixation and species composition. Journal of Experimental
Marine Biology and Ecology 67, 105-147
Ilmavirta, V. 1982 Dynamics of phytoplankton in Finnish Lakes. Hydrobiologia 86,
11-20
Joint, I. R., Owens, N. J. P. & Pomeroy, A. J. 1986 Seasonal production of photosynthetic picoplankton and nanoplankton in the Celtic Sea. Marine Ecology
Progress Series 28, 251-258
Kimura, B. & Ishida, Y. 1989 Phospholipid as a growth factor of Uroglena americana, a red tide Chrysophyceae in Lake Biwa. Nippon Suisan Gakkaishi 55, 799-804
Larsson, U. & Hagstr6m, A. 1979 Phytoplankton exudate release as an energy source for the growth of pelagic bacteria. Marine Biology 52, 199-206
Larsson, U. & Hagstrom, A. 1982 Fractionated phytoplankton primary production, exude release and bacterial production in a Baltic eutrophication gradient. Marine
Biology 67, 57-70
Laval-Peuto, M. & Brownlee, D. C. 1986 Identification and systematics of the Tintinnina (Ciliophora): evaluation and suggestions for improvement. Annales de
L'institut Ocdanographique 62, 69-84
Laval-Peuto, M. & Rassoulzadegan, F. 1988 Autofluorescence of marine planktonic Oligotrichina and other ciliates. Hydrobiologia 159, 99-110
Laval-Peuto, M., Slavano, P., Gayol, P. & Greuet, C. 1986 Mixotrophy in marine planktonic ciliates: ultrastructural study of Tontonia appendiculariformis (Ciliophora, Oligotrichina). Marine Microbial Food Webs 1, 81-104
Lee, J. J., Lanners, E. & Ter Kuile, B. 1988 The retention of chloroplasts by the foraminifer Elphidium crispum. Symbiosis 5, 45-60
Lopez, E. 1979 Algal chloroplasts in the protoplasm of three species of benthic foraminifera: taxonomic affinity, viability and persistence. Mar. Biol. 53, 201-211
Malone, T. C. 1971 The relative importance of nannoplankton and netplankton as primary producers in tropical oceanic and neritic phytoplankton communities.
Limnology and Oceanography 16, 633-639
McCarthy, J. J., Taylor, W. R. & Loftus, M. E. 1974 Significance of nanoplankton in
the Chesapeake Bay estuary and problems associated with the measurement of nanoplankton productivity. Marine Biology 24, 7-16
Nygaard, K. & Tobiesen, A. 1993 Bacterivory in algae: A survival strategy during nutrient limitation. Limnology and Oceanography 38, 273-279
Patterson, D. J. & Diirrschmidt, M. 1987 Selective retention of chloroplasts by algivorous Heliozoa: fortuitous chloroplast symbiosis? European Journal of
Protistology 23, 51-55
Pomeroy, L. R. 1974 The ocean's food web, a changing paradigm. Bioscience 24, 499-504
Porter, K. G. 1988 Phagotrophic phytoflagellates in microbial food webs. Hydrobiologia 159, 89-97
Porter, K. G. & Feig, Y. S. 1980 The use of DAPI for identifying and counting aquatic microflora. Limnology and Oceanography 25, 943-948
Rogerson, A., Finlay, B. J. & Berninger, U.-G. 1989 Sequestered chloroplasts in the freshwater ciliate Strombidium viride (Ciliophora: Oligotrichida). Trans. Am. Microsc. Soc. 108, 117-126
Sanders, R. W. 1991 Mixotrophic protists in marine and freshwater ecosystems.
Journal of Protozoology 38, 76-81
Sanders, R. W. & Porter, K. G. 1988 Phagotrophic phytoflagellates. Advances in
Microbial Ecology 10, 167-192
Sanders, R. W., Porter, K. G., Bennett, S. J. & DeBiase, A. E. 1989 Seasonal patterns of bacterivory by flagellates, ciliates, rotifers, and cladocerans in a freshwater planktonic community. Limnology and Oceanography 34, 673-687
Sanders, R. W., Porter, K. G. & Caron, D. A. 1990 Relationship between phototrophy and phagotrophy in the mixotrophic chrysophyte Poterioochromonas malhamensis.
Microbial Ecology 19, 97-109
Sherr, B. & Sherr, E. 1983 Enumeration of heterotrophic microprotozoa by epifluorescence microscopy. Estuarine and Coastal Shelf Science 16, 1-17
Sherr, B. F. & Sherr, E. B. 1984 Role of heterotrophic protozoa in carbon and energy flow in aquatic ecosystems. In Current Perspectives in Microbial Ecology (Klug, M. J. & Reddy, C. A., eds.). American Society of Microbiology, Washington, DC. pp.
412-423.
Sherr, B. F., Sherr, E. B. & Fallon, R. D. 1987 Use of monodispersed, fluorescently
labeled bacteria to estimate in situ protozoan bacterivory. Applied and Environmental
Sherr, E. B., Caron, D. A. & Sherr, B. F. 1993 Staining of heterotrophic protists for visualization via epifluorescence microscopy. In Current Methods in Aquatic Microbial
Ecology (Kemp, P., Cole, J., Sherr, B. & Sherr, E., eds.). Lewis Publishers, pp. 213-228.
Sieburth, J. M. 1979 Sea Microbes. Oxford University Press, New York.
Sieburth, J. M., Johnson, K. M., Burney, C. M. & Lavoie, D. M. 1977 Estimation of in
situ rates of heterotrophy using diurnal changes in dissolved organic matter and growth rates of picoplankton in diffusion culture. Helgolander wiss. Meeresunters. 30, 565-574 Sorokin, J. I. 1971 On the role of bacteria in the productivity of tropical oceanic waters.
Int. Revue ges. Hydrobiol. 56, 1-48
Sorokin, Y. I. 1979 Zooflagellates as a component of eutrophic and oligotrophic communities of the Pacific Ocean. Okeanologiya SSSR 3, 476-480
Stoecker, D., Michaels, A. E. & Davis, L. H. 1987 Large proportion of marine planktonic ciliates found to contain functional chloroplasts. Nature 326, 790-792 Stoecker, D. K., Silver, M. W., Michaels, A. E. & Davis, L. H. 1988 Obligate
mixotrophy in Laboea strobila, a ciliate which retains chloroplasts. Marine Biology 99, 415-423
Stoecker, D. K., Silver, M. W., Michaels, A. E. & Davis, L. H. 1989 Enslavement of algal chloroplasts by four Strombidium spp. (Ciliophora, Oligotrichida). Marine
Microbial Food Webs 3, 79-100
Wikner, J., Andersson, A., Normark, S. & Hagstrom, A. 1986 Use of genetically marked minicells as a probe in measurement of predation on bacteria in aquatic environments. Applied and Environmental Microbiology 52, 4-8
Williams, P. J. 1. 1981 Incorporation of microheterotrophic processes into the classical paradigm of the planktonic food web. Kieler Meeresforsch. 5, 1-28
CHAPTER 2
Mixotrophic Nanoplankton in Oligotrophic Surface Waters of the
Sargasso Sea May Employ Phagotrophy to Obtain Major Nutrients
ABSTRACT
The vertical distribution and abundance of mixotrophic nanoplankton was examined in an oligotrophic open ocean plankton community. Fluorescently labeled bacteria and cyanobacteria were used as tracers of ingestion in experiments designed to determine abundances of mixotrophic nanoplankton during two cruises to the Sargasso
Sea south of Bermuda. Phagotrophic nanoplanktonic (2-20 gm) algae ranged from undetectable to more than 100 ml-1, and were more abundant near the surface (up to 140 ml-1) than in the deeper euphotic zone. On two occasions 50% of the phototrophic nanoplankton in surface waters were observed with ingested fluorescent tracers. The contribution of mixotrophic algae to the total phototrophic nanoplankton assemblage in the deep chlorophyll maximum, however, did not exceed 0.5%. It is possible that mixotrophic algae were more abundant in the DCM, but were not phagotrophically active.
Two four-day experimental incubations were subsequently carried out to
determine the adaptive significance of phagotrophic behavior for algae in surface waters of the Sargasso Sea. Experiments were designed to examine the influence of light, nutrients and prey density on the phagotrophic behavior of mixotrophic nanoplankton. Greater mixotrophic nanoplankton abundances were observed in treatments that received no nutrient inputs and were limited by the availability of inorganic nutrients during the experiments. A decrease in the abundance of mixotrophic algae or a decrease in their phagotrophic activity occurred with nutrient enrichment. Based on the experimental results we suggest that phagotrophy was a mechanism by which these algae
supplemented nutrient acquisition during periods of low dissolved nutrient
concentrations. Higher abundances of mixotrophic nanoplankton observed in the upper 50 m of the Sargasso Sea may have been due to the generally low nutrient concentrations in these waters.
INTRODUCTION
Mixotrophic algae are algae that combine autotrophic and heterotrophic modes of nutrition. In many microalgae this trophic behavior is characterized by a combination of photosynthesis and the ingestion and digestion of preformed organic material (usually bacteria and other small unicellular microorganisms; Fenchel, 1982b; Sanders & Porter, 1988; Andersson et al., 1989; Caron et al., 1990; Sanders et al., 1990; Sanders, 1991). The ability to ingest particulate material by unicellular algae has been known for many years (Pascher, 1911; Pringsheim, 1952; Pringsheim, 1955). Only recently, though, have ecologists begun to recognize the potential significance of this behavior for algal growth and survival, and elemental flow through aquatic food webs (Bird & Kalff, 1989).
Phagotrophic activity by algae has important implications for algal growth and survival. Phagotrophy may serve as a mechanism for obtaining carbon, major nutrients (nitrogen or phosphorus) or specific growth factors that may be necessary to satisfy the nutritional requirements of the algae. Some facultative mixotrophic species, or
amphitrophs (Schnepf & Elbrachter, 1992) are primarily heterotrophic and rely on phagotrophy to obtain most or all of the organic carbon used for metabolism and growth. Photosynthesis in these species appears to be used as a mechanism for survival only under poor heterotrophic conditions (i.e., low prey abundance). For example, phagotrophy was found to be the dominant source of nutrition in the freshwater
chrysophyte Poterioochromonas malhamensis (Caron et al., 1990; Sanders et al., 1990; Lewitus & Caron, 1991). This alga ingested prey and grew rapidly in a range of light regimes, including continuous darkness if bacteria were present in the culture medium in sufficient numbers. When bacterial abundances were reduced below a grazing threshold of 106 bacteria ml-1, however, the alga's growth rate slowed considerably, but continued
patterns of grazing, photosynthesis and growth have been observed in some species of
Ochromonas (Fenchel, 1982a; Andersson et al., 1989).
Other species may be obligate mixotrophs that require both photosynthesis and phagotrophy to sustain growth of the algae. In these species phagotrophy may play a different role. For example, it has been suggested that phagotrophy may be employed by some algae to acquire specific growth factors (i.e. vitamins, lipids) required for
phototrophic growth. While phycologists have used the term "auxotroph" to refer to algal species with specific organic requirements (Morris, 1980) phagotrophy as a mechanism for obtaining those growth factors has been demonstrated in few instances. Kimura and Ishida (1986) demonstrated that phagotrophic behavior by the mixotrophic freshwater red tide chrysophyte Uroglena americana was necessary to sustain growth of the alga. Laboratory studies with U. americana revealed that bacteria provided a
specific phospholipid that the algae were unable to synthesize (Kimura & Ishida, 1989). Acquisition of a growth factor has also been suggested as one possible explanation for phagotrophic activity in another freshwater chrysophyte, Dinobryon cylindricum (Caron
et al., 1992).
Phagotrophy may also be used by some mixotrophic algae to acquire major nutrients (nitrogen and phosphorus). There are very few laboratory data to support this hypothesis, however (Veen, 1991; Nygaard & Tobiesen, 1993). Photosynthesis would presumably be the primary energy source for these mixotrophs while phagotrophy would
allow these algae to successfully compete with non-phagotrophic algae (and bacteria) for growth-limiting nutrients. Such a strategy for growth might be particularly useful in well-lighted oligotrophic waters.
While the examples given above indicate that phagotrophic behavior may
provide mixotrophic algae with a considerable selective advantage over non-mixotrophic species, relatively few data actually exist on the abundance or activity of mixotrophic species in nature. A few studies have demonstrated that mixotrophic algae are abundant
in freshwater environments and occasionally comprise a large percentage of the
phytoplankton community. Bird and Kalff (1989) reported that mixotrophic algae were responsible for sustenance of a metalimnetic phytoplankton peak in Lac Gilbert, Quebec. They determined that phagotrophy might have accounted for nearly 80% of the algal community carbon assimilation in this peak on an overcast day. Berninger et al. (1992) found that over-wintering phytoplankton populations in a Pennsylvanian lake were dominated by mixotrophic (phagotrophic) chrysophyte algae. These species were also common in the phytoplankton bloom that takes place in the lake at the time of ice-out (Siver & Chock, 1986). Beminger et al. (1992) suggested that the inoculum for the bloom may be maintained, in part, by phagotrophy of these algae under the ice.
Several species of mixotrophic algae have been observed and/or cultured from oceanic environments (Fenchel, 1982a; Estep et al., 1986; Andersson et al., 1989; Nygaard & Hessen, 1990; Bockstahler & Coats, 1993) but the overall importance of mixotrophic algae in marine plankton communities remains unclear. The use of phagotrophy to acquire major nutrients has been proposed for some marine species of mixotrophic algae. Over the past several years, toxic blooms of algal flagellates occurred in the coastal waters of Norway. These blooms were associated with low inorganic phosphate concentrations in the water column (Dahl et al., 1989).
Interestingly, the blooms were dominated by algal flagellates capable of phagotrophy (Borsheim et al., 1989; Johnsen & Lein, 1989). Nygaard and Tobiesen (1993) examined bacterivory by several species of these marine mixotrophic flagellates in P-limited and non-limited cultures. Based on experiments performed in the laboratory, they
hypothesized that phagotrophic behavior may permit these species to form blooms when phosphate becomes limiting to other algae.
The present study was designed to determine the abundance of mixotrophic algae in an oligotrophic open ocean plankton community and to examine experimentally the influence of light, nutrients and prey density on their phagotrophic behavior. Analyses
of water samples collected in the euphotic zone of the Sargasso Sea during a cruise in August 1989 demonstrated the presence of significant but variable numbers of
nanoplanktonic mixotrophs. A more detailed examination of the vertical distribution of mixotrophic nanoplankton (MNAN) conducted in early April 1992 yielded a range in abundances of mixotrophs from <1 MNAN ml-1 just below the deep chlorophyll maximum to greater than 30 MNAN ml- near the surface. Experiments conducted to
examine the reasons for phagotrophic activity by algae in surface waters during this study support the hypothesis that mixotrophic algae in surface waters of this oligotrophic oceanic system were ingesting bacteria in response to nutrient stress.
METHODS
Mixotrophic nanoplankton abundances during August 1989
Estimates of mixotrophic nanoplankton abundances in euphotic zone waters of the Sargasso Sea were obtained in August 1989 as a part of the ZOOSWAT program (R/V Gyre). These measurements were obtained during experiments designed to estimate the ingestion rates of phagotrophic protists (<20 Pm in size) using the FLB uptake method (Sherr et al., 1987). Samples were collected in 0.1 N HC1-rinsed Niskin bottles from two depths at seven closely spaced stations during August 1989 south of Bermuda (28-320N, 63-780W). Water samples were collected from a depth between 1
and 5 m (surface) and from a depth coincident with the deep chlorophyll maximum (DCM) as determined by in situ fluorometry using a CTD-fluorescence instrument package attached to a Niskin rosette sampler. Subsamples were removed and preserved immediately with gluteraldehyde at a final concentration of 1% for microscopic
determination of bacteria and chroococcoid cyanobacteria abundances (<2 gm), and phototrophic and heterotrophic nanoplankton abundances (microalgae and protozoa 2-20 g.m in size, respectively). All population counts were performed by epifluorescence microscopy at 1000x magnification (Porter & Feig, 1980; Caron, 1983; Waterbury et al.,
1987; Sherr et al., 1993).
Grazing experiments were conducted using fluorescently labeled cultured microorganisms as tracers of natural prey that were prepared according to methods outlined in Sherr et al. (1987). Grazing experiments were conducted using fluorescently labeled cultured microorganisms as tracers of natural prey (Sherr et al., 1987).
Fluorescently labeled cyanobacteria (Synechococcus sp., clone WH8012) were used extensively in these experiments. This cyanobacterium maintains a small size (-0.8-0.9 gm in diameter) when grown in laboratory cultures and thus is representative of the size
of naturally occurring cyanobacteria and some heterotrophic bacteria. Fluorescently labeled minicells ( FLM) of the bacterium Escherichia coli were also used (Pace et al.,
1990), but the usefulness of FLM for examining protistan ingestion was compromised by clumping and fading of these cells.
One liter subsamples from each depth were placed in 1.2 L clear polycarbonate vessels and inoculated with fluorescently labeled prey within one hour of collection. Immediately after the addition of fluorescently labeled prey the containers were gently swirled to distribute the tracer, and samples were removed and preserved to establish the initial numbers of labeled prey and to provide a "time zero" sample for examining ingestion. The abundances of labeled prey used in these experiments were chosen such that they could be readily counted, but did not dramatically increase the abundance of natural prey of the same size (generally 10-30% of the natural prey abundance). Incubations were conducted in duplicate in an on-deck Plexiglas incubator. Seawater was continuously pumped through the incubator to maintain the water temperature at ambient surface water temperature. Light intensity was attenuated to the approximate intensities at the two sampling depths using neutral density screening. After 24 hours of incubation a second set of samples was removed and preserved to establish the
abundance of mixotrophic nanoplankton.
More than 400 individual phototrophic nanoplankton (chloroplast-bearing cells 2-20 gtm in size) in each sample were observed for ingested fluorescently labeled prey as they were encountered during the microscopical examinations. Mixotrophic
nanoplankton (MNAN) were operationally defined as cells containing autofluorescent chloroplasts and ingested fluorescently labeled prey. The relative abundance of mixotrophic nanoplankton was determined as a percentage of the phototrophic nanoplankton. The percentages were then converted to absolute abundances of
mixotrophic nanoplankton based on the abundances of phototrophic nanoplankton in the samples. This method for determining the abundances of mixotrophic nanoplankton is
based on two assumptions: (1) fluorescently labeled prey are ingested at the same rate as natural prey, and (2) all MNAN actively phagocytize prey during experiments. This method therefore provides a lower limit estimate of the actual abundances of
mixotrophic nanoplankton present in a water sample because some mixotrophic cells may not phagocytize prey during experiments. While these latter mixotrophic individuals will be undetected by this method, at present, there is no other way to establish the presence of mixotrophs in natural samples.
Vertical distribution of mixotrophic nanoplankton during April 1992
Vertical profiles of mixotrophic nanoplankton abundance were determined at two stations south of Bermuda in the Sargasso Sea at 25059'N, 64030'W on April 1 and
30026'N, 64030'W on April 3, 1992 during R/V Endeavor cruise leg 234. Samples were collected as described above from five depths including the surface mixed layer and deep chlorophyll maximum. Duplicate 1 L subsamples from each depth were prepared and incubated as described. Fluorescently labeled bacteria (FLB) were prepared from cultures of Pseudomonas halodurans (-0.8-1.0 gm average cell size) according to the method of Sherr et al. (1987) and used as prey. FLB were added to samples at 30 to 50 percent of the natural prey abundance. The samples were incubated as described above for 6 hours starting in late afternoon. Subsamples were removed prior to incubation and at the end of the 6 hour period and preserved to establish microbial population
abundances (bacteria, chroococcoid cyanobacteria, heterotrophic and phototrophic nanoplankton), the initial densities of the labeled prey and the abundance of mixotrophic nanoplankton.
Experimental examination of algal phagotrophy
An experiment was designed to determine the influence of light, nutrients and prey density on phagotrophic behavior by algae in surface waters of the Sargasso Sea. Whole seawater samples were subdivided and treated, and microbial populations including mixotrophic nanoplankton were monitored for their responses to the addition of inorganic nutrients, labile organic carbon, and changes in light intensity. Water collection was conducted at approximately the location of the Bermuda Atlantic Time Series (BATS) station at 310N, 640W. One experiment (Expt. I) was carried out between 27 and 31 March
1992 with water collected from a depth of 10 m. The experiment was repeated (Expt. II) between 5 and 9 April 1992 using water collected from a depth of 20 m.
Water for the experiments was collected in several 0.1 N HCl-rinsed 5 L Niskin bottles using a rosette sampler. Water was pooled in acid-rinsed carboys and subsamples were removed and preserved with gluteraldehyde prior to filling incubation vessels in order to establish the initial microbial population abundances. Within 1 hour of
collection duplicate clear 4 L polycarbonate vessels were filled with 3.5 L of sample and placed in an on-deck Plexiglas incubator with running seawater to maintain water at ambient surface water temperature. Light was adjusted with neutral density screening to approximately 50% incident light. The experimental treatments (described below) were incubated over a 4 day period.
C Control, untreated seawater
G Seawater with daily additions of glucose (10 gM C) NP Seawater with daily additions of NH4+ (5 jgM) and
P04- 3 (0.5 gM)
GNP Seawater with daily additions of glucose, NH4+
and P04- 3 at above concentrations
LL Seawater at low light intensity (<5 % incident light) without inorganic or organic additions
LLGNP Seawater at low light intensity with daily additions of glucose, NH4+ and PO43- at above concentrations
The purpose of adding glucose alone was to stimulate the bacterial assemblage and thereby cause an increase in their uptake of dissolved nutrients. This was expected
to increased competition for nutrients with the phototroph assemblage. Lower
concentrations of dissolved inorganic nutrients were hypothesized to favor mixotrophic algae that may be able to acquire nutrients by consumption of bacteria. Combining additions of glucose and inorganic N and P was expected to increase bacterial abundances without also causing a reduction in nutrient concentration, so that competition for nutrients would not be increased. This treatment would presumably favor mixotrophic algae that are able to take advantage of higher prey abundances. N and P were added alone to stimulate the growth of phototrophs. It was hypothesized that primarily heterotrophic species of mixotrophs and obligate photophagotrophs would continue to consume bacteria in these enclosures. Finally, the purpose of reducing light intensity was to decrease photosynthetic rates, while nutrients and glucose were added to
stimulate the heterotroph assemblages in these enclosures. Mixotrophic algae that are able to supplement photosynthetic carbon by consuming bacterial C would presumably be favored in light limiting conditions, and primarily heterotrophic algae would be expected to do well in the presence of higher bacterial abundances resulting from added carbon and nutrients.
Subsamples (750 ml) were removed from each experimental treatment vessel immediately after initiation of the experiment and incubated with FLB in 1.2 L polycarbonate vessels for 6 hours. These incubations were conducted using
fluorescently labeled P. halodurans added at a concentration equal to 50% of the natural bacterial abundance. Following these incubations, preserved samples were examined by epifluorescence microscopy, as described earlier, to establish the abundances of
mixotrophic nanoplankton and other microbial assemblages. This procedure was repeated on days 2 and 4 of the 4 day experimental incubation.
RESULTS
Abundances and vertical distributions of mixotrophic nanoplankton
Labeled cyanobacteria were observed in the food vacuoles of
chloroplast-containing nanoplankton in surface water samples on all seven sampling dates in August 1989 (Table 2.1). Five of these surface water samples contained detectable but low abundances of algae with ingested labeled prey (<5% of phototrophic nanoplankton). However, on 15 and 16 August, we observed abundances of 144 mixotrophic
nanoplankton ml-1 and 70 mixotrophic nanoplankton ml-1representing 53% and 50% of
the total phototrophic nanoplankton in the respective surface water samples (Table 2.1). These mixotrophic nanoplankton were 2-5 m in diameter. Considering only the phototrophic nanoplankton in this size range, 74% and 80% of the algae in the two surface water samples on 15 and 16 August contained ingested prey. These latter percentages are typical of percentages that might be observed for some species of bacterivorous heterotrophic nanoflagellate populations growing exponentially in
laboratory cultures (Sieracki et al., 1987; Nygaard et al., 1988). This result indicates that an abundant and very active phagotrophic algal population was present in these two surface water samples. In contrast, ingested prey were not observed in any of the nanoplanktonic algae from samples collected in the deep chlorophyll maximum during
August 1989.
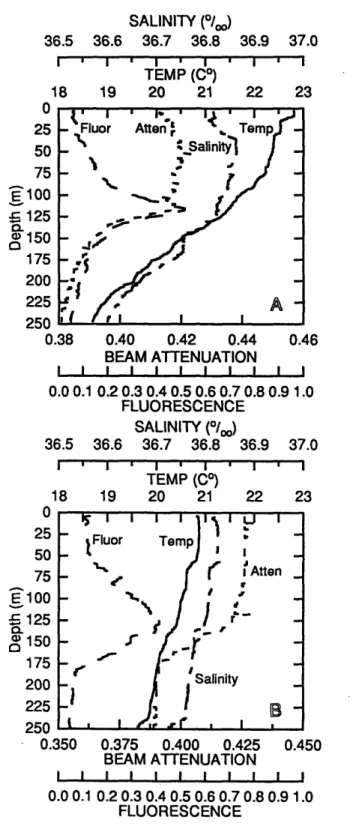
Detailed vertical profiling conducted in early April 1992 indicated the presence of mixotrophic nanoplankton. The water column was weakly stratified during sampling
in 1992 (Fig. 2.1), and there were pronounced peaks in chlorophyll concentration at 118 m on 1 April and at 132 m on 3 April. Coinciding with these deep chlorophyll maxima
were peak abundances of photosynthetic nanoplankton (PNAN) of 1.2x10³ PNAN mi-1 on 1 April (Fig. 2.2a) and 1.1x10³ PNAN ml-1on 3 April (Fig. 2.3a). Changes in
+ ~D ~ + Z ) + + 5
o
- o
C,, 0V )oo Oo in cq ci O0 ci cn ci +1 +1 +1 Cs ON r-i cfc d+ Z
Z oZ
:D 'n >: 'n > -46
+1 +d00 d
-+ -+ + +1 -H -H -- 00 m -
ee
-tl -4 o. c ci N N N W'f ln N · i + +; l !l !?I $' 00
tN
00 O
- b00 oo t m - - 0 ci - -\0 C\ cN V~~N ->0 \ 0 0 Nt On n +1 +1 +1 +1 +1 +1 +1 +1 1 +1 +1 \ n CN M o t 0 00 N \0n o-4 ' t O N ON-C
Ci-
ci
ci
-ci
c-
_
I
C.
.i, .
.
0 00.
.0
0 0.
Nc N-i- ci _ ci a) a) o ) a o a) a a) C, c~~
C) O cO C: C. cO C.) cO C. c Ct col W) CA n CA v cn I O O -4 0 O O r C% O O O C oo o M 00 oo O'/ Ci00
- t00 00 00 00
cis
-* t
-N I,
cn \£o M en \4D m "C m \10 o00
o o O C) n -0 r;0 0
C1 M 7)o o
o C\ C\ o oh o\ C oo oo oo oo oo oo oo bo bO b bD bD bO ) oo o - t n M o "C o 0.0C.) a) E -5*.. o.)oc
*
C o Ce I Z 0 c, V -O Cn 0 a) p -c- -Hoo C L __o : C r~C oa . o * 0 . 0 ~t
0
" 0a) -UCm.,<¢ _OO a cmSALINITY (o) 36.5 36.6 36.7 36.8 36.9 I ' I ' I ' I TEMP (C°) 18 19 20 21 U 25 50 75 E100 - 125
a.
(0 150 175 200 225 9tAn 0.38 0.40 0.42 0.44 BEAM ATTENUATION I I I I I I I I 22 37.0 I I' 22 23 0.46 I I 0.9 1.0 37.0 23 0.0 0.1 0.2 0.3 0.4 0.5 0.6 0.7 0.81 FLUORESCENCE SALINITY (0/oo) 36.5 36.6 36.7 36.8 36.9 I . I . I . I TEMP (C°) 18 19 20 21 U 25 50 75 E 100 = 125 Q 150 175 200 225 250 0.350 I.J i I Atten Q~te 0.375 0.400 0.425 BEAM ATTENUATION I I I I I I I I 0.450 I 0.0 0.1 0.2 0.3 0.4 0.5 0.6 0.7 0.8 0.9 1.0 FLUORESCENCEFigure 2.1. Vertical profiles of temperature, salinity, beam attenuation and fluorescence determined at 25059'N, 64030'W (A) sampled on 1 April 1992
and 30026'N, 64030'W (B) sampled on 3 April 1992.
- - - -~~~~~~~~~~~~I I L . . . . - - - -.-.-.-. .... .. . i... I -. I A I , I , ,A.. r ! I
PNAN DENSITY (cells mr') 0 500 1000 1500 2000 0 50 El 00 a 150 w 200 250
CYAN DENSITY (cells mr1)
0 2000 4000 6000 8000 10000
HNAN DENSITY (cells mr')
0 500- 1000 1500 2000
BACT DENSITY (x 105 cells ml-')
0 1 2 3 4 0 50 !-E 100 Q 150 200 250
MNAN DENSITY (cells ml1')
0 5 10 15 20 25 30 35
5
RELATIVE ABUNDANCE OF MNAN (% of PNAN) 0 2 4 6 8 U 50 100
I
u 150 200 950Figure 2.2. Vertical distribution of phototrophic nanoplankton (A), heterotrophic
nanoplankton (B), chroococcoid cyanobacteria (C), bacteria (D) and mixotrophic nanoplankton absolute (E) and relative abundance (F) on 1 April 1992.
0 50 100 150 200 250 0 50 100 150 200 250 0 50 100 150 200 250 E I-L w
0
EI-a
w EI
0 11 C]l . I I I I .I ' ' i i _ n1 IPNAN DENSITY
0 500 1000
(cells m[') 1500 2000
HNAN DENSITY (cells ml-1)
0 500 1000 1500 2000 0 50 100 150 200 0 50 E I - 100 a_ 0 150 200 0 50 100 150 200 0 E I a: -0 LU W 50 100 150 200
CYAN DENSITY (cells ml-'1)
0 5000 10000 15000 20000
MNAN DENSITY (cells ml-')
0 10 20 30 4 0 E I - 100 0 150 200 0 I I I ' B
BACT DENSITY (x 105cells mt1)
0 1 2 3
. I ' 'D[D I
RELATIVE ABUNDANCE OF MNAN (% of PNAN) 0 1 2 3 4 0 50 E
"-I
LL 0 100 150 200Figure 2.3. Vertical distribution of phototrophic nanoplankton (A), heterotrophic nanoplankton (B), chroococcoid cyanobacteria (C), bacteria (D) and mixotrophic nanoplankton absolute (E) and relative abundance (F) on 3 April 1992.
I
LU 0 I' I i I - ~A I I I I I I I ' ' EI
a. LU 0 0 1 -Ibacterial abundances were less dramatic than changes in PNAN abundances. Bacterial abundances (BACT) peaked at 60 m on 1 April at 4.0x10⁵BACT ml-1 (Fig. 2.2d). On 3
April a maximum bacterial abundance of approximately 5x10⁵BACT ml-1occurred at
132 m (Fig. 2.3d). Chroococcoid cyanobacteria (CYAN) abundances had subsurface maxima of 5.1x10³ CYAN ml-1 and 1.1x10⁴ CYAN ml-1 at 23 m on 1 April (Fig. 2.2c)
and approximately 79 m on 3 April (Fig. 2.3c), respectively. The vertical distributions of heterotrophic nanoplankton (HNAN) were relatively uniform during this cruise. Their abundances ranged from 6x10²to 9x10²HNAN ml- on 1 April (Fig. 2.2b) and from
5.3x10² to 9.4x10² HNAN ml-1 on 3 April (Fig. 2.3b).
The relative abundance of mixotrophic nanoplankton was greatest in the
shallower water samples at both stations, but overall, the density of MNAN represented a relatively small contribution to the total phototrophic nanoplankton assemblage at these depths (-6%, Fig. 2.2f and <4 %, Fig. 2.3f). A maximum density of 25 MNAN ml- was
observed at 23 m on 1 April (Fig. 2.2e), and on 3 April, a maximum density of 38
MNAN ml-1 occurred at a depth of 79 m (Fig. 2.3e). On both sampling dates mixotrophic nanoplankton abundances in the DCM were at or below the limit of
detection (<3 MNAN ml-1).
Dissolved inorganic nutrients concentrations were low in surface waters during the study period. According to profiles of inorganic nutrient concentrations determined as a part of the BATS station sampling program on dates that bracketed the study period (18 March and 12 April 1992; Fig. 2.4), nitrogen was undetectable (<0.05 WM) in surface waters down to a depth of 40 m while phosphorus concentrations were <<0.1 M
throughout the euphotic zone. Below 40 m to approximately 200 m, dissolved inorganic nitrogen concentrations were between 0.4 and 1.0 gM.
CONCENTRATION (mo L'-1 0 1 2 3 45 5
E
E 10 I-15 20 25 U 50 E 100I'
a.150
0
200 250 CONCENTRATION (mol L'-1 0 1 2 3 4 5Figure 2.4. Vertical profiles of dissolved inorganic nitrogen and phosphorus
concentrations at the Bermuda Atlantic Time Series station (31 N, 640W) on 18 March 1992 (A) and 12 April 1992 (B). Data kindly provided by BATS
Microbial population responses to manipulations of light, nutrients, and prey density
Most microbial assemblages responded to the experimental manipulations during the 4 day period. Trends generally were apparent at day 2 but were not significantly different from day 0 values for some treatments. Analyses were therefore conducted using the results from day 4, and treatments were contrasted to controls using
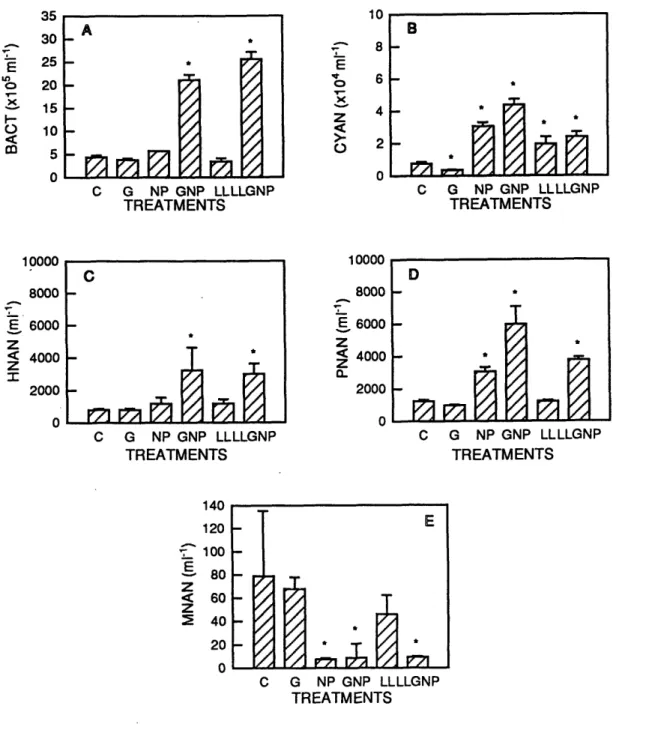
transformed data to homogenize the variances. Significant differences were determined at the 0.05 significance level. The abundances of all microbial populations, except MNAN, did not change significantly in controls over the 4 day experimental period (Table 2.2). Absolute MNAN abundances decreased in controls during Expt. I and increased in controls during Expt. II. As a result, MNAN abundances in controls at the end of Expt. I were almost an order of magnitude lower than abundances in controls on day 4 of Expt. II even though day 0 abundances in both experiments were similar. Results from Expt. I, however, were similar to results from Expt. II with regard to the change in MNAN abundance in each treatment as compared to the control (Figs. 2.5e;
2.6e).
Bacterial abundances were significantly greater than controls on day 4 in the GNP and LLGNP treatments in both Expt. I and Expt. II (Fig. 2.5a; 2.6a). In these two treatments bacterial abundances reached values of 2x10⁶ and 3x10⁶BACT ml-1,
respectively. Abundances in controls were < 5x10⁵BACT ml-1. Heterotrophic
nanoplankton abundances in Expt. I did not increase significantly in the GNP or LLGNP treatments. HNAN abundances in the NP and GNP treatments, however, did appear to be slightly elevated in comparison to controls, although not significantly. These small increases may have been due to HNAN preying primarily upon members of the
phototroph assemblages which increased significantly in these two treatments during Expt. I (see below). HNAN abundances in Expt. II were significantly greater than controls on day 4 in the GNP and LLGNP treatments (Fig. 2.6c). Presumably, this
* * * * O0 N n tn C) o7\ c5 c:5 c5 ,-+1 +1 +1 +1 N Co '-4 N; l ~ +1 +1 +1 +1 N N m 0 +1 -I +1 +1 00 \ ' 00 "C \0 N C) +1 + +1 +1 M t ~ )O C) C) +1 +1 +1 +1 C \0 00 0
0A
o =Z CZ 0't°
o
.~o
1'
0
.E-.i0
a) L S~r oo,
Cj
'-4 +a 0- C-l C)cd E i:0 ou.0
o
a:D ._4v U _ C Y Ct ?d C's 0 . C,,0 ct C aC 0 -0
Cc t)
o 4.) cn cdC O CO Cc)~ xc~C G NP GNP LLLLGNP TREATMENTS 10 E
o
z
0
8 6 4 2 0 10000 Ez
z
CL 8000 6000 4000 2000 0 C G NP GNP LLLLGNP TREATMENTS C G NP GNP LLLLGNP TREATMENTS C G NP GNP LLLLGNP TREATMENTS 25 Ez
Zz
20 15 10 5 0 E C G NP GNP LLLLGNP TREATMENTSFigure 2.5. Mean population abundances (+1 SD) of bacteria (A), chroococcoid cyanobacteria (B), phototrophic nanoplankton (C), heterotrophic nanoplankton (D), and mixotrophic nanoplankton (E) in controls (C), glucose (G), nitrogen+phosphorus (NP), glucose+nitrogen+phosphorus (GNP), low light (LL) and low light with glucose+ nitrogen+phosphorus (LLGNP) treatments at the end of a 4 day experimental
incubation conducted from 27-31 March 1992 with water collected from a depth of 10 m at 25°59'N, 64030'W in the Sargasso Sea. Significant differences between treatments and controls are indicated by "*" (P-value = 0.05). See text for details of treatments.
35