HAL Id: hal-02536332
https://hal.umontpellier.fr/hal-02536332
Submitted on 8 Apr 2020HAL is a multi-disciplinary open access archive for the deposit and dissemination of sci-entific research documents, whether they are pub-lished or not. The documents may come from teaching and research institutions in France or abroad, or from public or private research centers.
L’archive ouverte pluridisciplinaire HAL, est destinée au dépôt et à la diffusion de documents scientifiques de niveau recherche, publiés ou non, émanant des établissements d’enseignement et de recherche français ou étrangers, des laboratoires publics ou privés.
sympatric Eschweilera species in French Guiana
Myriam Heuertz, Henri Caron, Caroline Scotti-Saintagne, Pascal Petronelli,
Julien Engel, Niklas Tysklind, Sana Miloudi, Fernanda Gaiotto, Jérôme
Chave, Jean-François Molino, et al.
To cite this version:
Myriam Heuertz, Henri Caron, Caroline Scotti-Saintagne, Pascal Petronelli, Julien Engel, et al.. The hyperdominant tropical tree Eschweilera coriacea (Lecythidaceae) shows higher genetic heterogeneity than sympatric Eschweilera species in French Guiana. Plant Ecology and Evolution, Botanic Garden Meise and Royal Botanical Society of Belgium, 2020, 153 (1), pp.67-81. �10.5091/plecevo.2020.1565�. �hal-02536332�
The hyperdominant tropical tree Eschweilera coriacea
(Lecythidaceae) shows higher genetic heterogeneity
than sympatric Eschweilera species in French Guiana
Myriam Heuertz
1,*, Henri Caron
1,2, Caroline Scotti-Saintagne
3, Pascal Pétronelli
2,
Julien Engel
4,5, Niklas Tysklind
2, Sana Miloudi
1, Fernanda A. Gaiotto
6, Jérôme Chave
7,
Jean-François Molino
5, Daniel Sabatier
5, João Loureiro
8& Katharina B. Budde
1,91Univ. Bordeaux, INRAE, Biogeco, FR-33610 Cestas, France 2INRAE, Cirad, Ecofog, GF-97310 Kourou, French Guiana 3INRAE, URFM, FR-84914 Avignon, France
4International Center for Tropical Botany, Department of Biological Sciences, Florida International University, Miami, FL-33199, USA 5Université de Montpellier, IRD, Cirad, CNRS, INRAE, AMAP, FR-34398 Montpellier, France
6Universidade Estadual de Santa Cruz, Centro de Biotecnologia e Genética, Ilhéus, BR-45662-901, Bahia, Brazil 7Université Paul Sabatier Toulouse, CNRS, EBD, FR-31062, Toulouse, France
8University of Coimbra, Centre for Functional Ecology, Department of Life Sciences, PT-3000-456 Coimbra, Portugal
9Present address: University of Copenhagen, Forest, Nature and Biomass, Rolighedsvej 23, DK-1958 Frederiksberg C, Denmark *Corresponding author: myriam.heuertz@inrae.fr
REGULAR PAPER
Background and aims – The evolutionary history of Amazonia’s hyperabundant tropical tree species, also
known as “hyperdominant” species, remains poorly investigated. We assessed whether the hyperdominant Eschweilera coriacea (DC.) S.A.Mori (Lecythidaceae) represents a single genetically cohesive species, and how its genetic constitution relates to other species from the same clade with which it occurs sympatrically in French Guiana.
Methods – We sampled 152 individuals in nine forest sites in French Guiana, representing 11 species of
the genus Eschweilera all belonging to the Parvifolia clade, with emphasis on E. coriacea. Samples were genotyped at four simple sequence repeat (SSR) markers. We delimited gene pools, i.e., genetically coherent putative taxa, using STRUCTURE software and principal component analysis. We compared the genetic assignment of individuals with their morphological species determination and estimated genetic diversity and differentiation for gene pools and species. We also estimated genome size using flow cytometry.
Key results – SSR profiles commonly displayed up to four alleles per genotype, suggesting that the
investigated Eschweilera species bear a paleopolyploid signature. Flow cytometry suggested that the studied species are diploid with haploid genome sizes of 871–1046 Mbp. We detected five gene pools and observed a good correspondence between morphological and genetic delimitation for Eschweilera sagotiana Miers and the undescribed morphospecies E. sp. 3 (which resembles E. grandiflora (Aubl.) Sandwith), and to a lesser extent for E. decolorans Sandwith and E. micrantha (O.Berg) Miers. Eschweilera coriacea was the most genetically diverse species and included individuals assigned to each gene pool.
© 2020 Myriam Heuertz, Henri Caron, Caroline Scotti-Saintagne, Pascal Pétronelli, Julien Engel, Niklas Tysklind, Sana Miloudi, Fernanda A. Gaiotto, Jérôme Chave, Jean-François Molino, Daniel Sabatier, João Loureiro, Katharina B. Budde.
This article is published and distributed in Open Access under the terms of the Creative Commons Attribution License (CC BY 4.0), which permits use, distribution, and reproduction in any medium, provided the original work (author and source) is properly cited.
Plant Ecology and Evolution is published by Meise Botanic Garden and Royal Botanical Society of Belgium
INTRODUCTION
Neotropical rainforests are the world’s most diverse terres-trial ecosystems, harbouring 90 000–110 000 species of seed plants, which represents ca. 37% of all seed plants worldwide (Gentry 1982; Barthlott et al. 2007; Antonelli & Sanmartín 2011; Eiserhardt et al. 2017). The relative abundances of plant species and their geographic distribution ranges vary strongly in these forests (Peters et al. 1989; Pitman et al. 2001; Macía & Svenning 2005; ter Steege et al. 2013). In Western Amazonia, small sets of common and abundant spe-cies, known as oligarchies, are an ubiquitous feature of tree communities at local, landscape and regional scales (Pitman et al. 2001, 2013; Arellano et al. 2014, 2016). Across low-land Amazonia, a similar pattern is observed, with only 227 species with estimated population sizes of > 3.7 × 10⁸ trees
(ter Steege et al. 2013). These hyperdominant species repre-sent only 1.4% of the estimated total of 16 000 Amazonian tree species, but as much as 50% of the estimated total num-ber of tree stems (ter Steege et al. 2013). Among the 25 fami-lies richest in tree species in Amazonia, Arecaceae, Myris-ticaceae and Lecythidaceae have the highest proportion of hyperdominant species (ter Steege et al. 2013). However, even for the most abundant of these species, it remains un-known whether their taxonomic definition based on morpho-logical characters includes a single, or several evolutionary lineages. We address this question in Eschweilera coriacea (DC.) S.A.Mori (Lecythidaceae), the only tree species that qualified as hyperdominant in all six Amazonian regions – Guiana Shield, northwest, southwest, south, east, and central Amazonia (ter Steege et al. 2013).
The causes of hyperdominance in Amazonia are an active field of research. Considerable overlap has been observed in the species composition of regional Western Amazonian oli-garchies and Amazonian hyperdominants, suggesting that the basin-wide pattern arises in part from the combined smaller-scale processes (Pitman et al. 2001, 2013; ter Steege et al. 2013). At the regional scale, oligarchic species have been found to display a wider environmental tolerance, on aver-age, than non-oligarchic species in the same communities (Arellano et al. 2014), which may suggest a high adaptive potential. At larger geographic scales, the strength of the oli-garchic pattern was found to decrease, due to the pure effect of area and due to reduced landscape connectivity (Arellano et al. 2016). These results suggest geographic and physiolog-ical limits to dominance patterns and are congruent with ter
Steege and colleagues’ observation that most hyperdominant species are habitat specialists and are only dominant in cer-tain forest types and in cercer-tain regions of the basin (ter Steege et al. 2013). Hyperdominants include many species useful to humans, thus humans may have contributed to shaping hy-perdominance patterns (Levis et al. 2017; McMichael et al. 2017). Notwithstanding the reasons for the wide-range domi-nance patterns in Amazonia, their main implication is that a relatively small suite of tree species accounts for a large proportion of Amazonian ecosystem services, such as water, carbon and nutrient cycling, which should have the potential to greatly simplify research and modelling efforts in forest ecology and biogeochemistry (ter Steege et al. 2013).
The inference of the hyperdominant species status is predicated on a correct botanical identification of tree spe-cies in inventory plots. However, correct identification is not trivial because many hyperdominants belong to taxo-nomically difficult, species-rich genera such as Eschweilera (Lecythidaceae), Protium (Burseraceae), or Licania (Chryso-balanaceae) (Funk et al. 2007) in which several species can co-occur sympatrically (Gonzalez et al. 2009; Baraloto et al. 2012). One major limitation to their correct botanical iden-tification is the scarcity of diagnostic characters on sterile herbarium vouchers, because many closely related tree spe-cies are difficult to distinguish based on vegetative charac-ters alone, trees are tall and bear little or no flowers or fruits for most of the year (Mori & Prance 1990; Mori et al. 2001; Goodwin et al. 2015). In some clades, tree species are weak-ly differentiated due to relativeweak-ly recent speciation events or occasional hybridization (Gonzalez et al. 2009; Pennington & Lavin 2016; Caron et al. 2019). It is thus reasonable to as-sume that botanical identification errors may occur in hyper-dominants; for instance, a rare taxon may be lumped with the local dominant taxon (Hardy et al. 2017). A related possibil-ity is that some hyperdominants may include cryptic species that are morphologically indistinguishable (based on a lim-ited set of characters), but that represent distinct evolution-ary lineages (Cavers et al. 2013; Turchetto-Zolet et al. 2013; Torroba-Balmori et al. 2017). Molecular markers may con-tribute to species delimitation in species complexes where identification based on morphology is challenging (Duminil & Di Michele 2009).
Here we examine if the hyperdominant and morphologi-cally variable Amazonian tree species Eschweilera coriacea (DC.) S.A.Mori represents a single genetically cohesive tax-on and whether it presents high genetic variatitax-on, an
indica-Conclusions – We found no conclusive evidence for cryptic species within E. coriacea in French
Guiana. SSRs detected fewer gene pools than expected based on morphology in the Parvifolia clade but discriminated evolutionary relationships better than available plastid markers. A positive trend between demographic abundance of species and allelic richness illustrates that hyperdominants may have a high evolutionary potential. This hypothesis can be tested using more powerful genomic data in combination with tree phenotypic trait variation and characterization of niche breadth, to enhance our understanding of the causes of hyperdominance in Amazonian trees.
Keywords – Eschweilera; microsatellites; species delimitation; hyperdominant tropical trees; species
tor of large population size and adaptive potential (Hoffmann et al. 2017). We test these hypotheses in the Guiana shield, more specifically, in French Guiana. Eschweilera coriacea is a common canopy tree species, with a maximum height of up to 37m (Lopes 2007). According to Mori et al. (2017), it belongs to the Parvifolia clade, the most diverse clade in the family Lecythidaceae, which encompasses 63 of the 215 Neotropical species in the family. This clade is nested within the Neotropical Bertholletia clade, and represents ca. half of its 125 species (Huang et al. 2015). Species in the previously defined genus Eschweilera (Mori & Prance 1990) fall into three unrelated clades (Integrifolia, Tetrapetala and Parvifo-lia clades) and evolutionary relationships within clades re-main poorly resolved, especially in the Parvifolia clade, ei-ther based on morphology or on genetic characters (Huang et al. 2015). Numerous species of the Parvifolia clade com-monly occur in sympatry, thus forming complexes of sym-patric species: for example, 11 and 15 species in forests in French Guiana (La Fumée Mountain) and Central Amazo-nia (BDFFP 100 ha plot near Manaus), respectively (Mori 1987; Mori & Lepsch-Cunha 1995; Mori et al. 2001; Huang et al. 2015). These sympatric species share plastid DNA hap-lotypes (Gonzalez et al. 2009; Caron et al. 2019), suggest-ing that plastid DNA sequences cannot discriminate species, which can either be due to recent common ancestry and in-complete lineage sorting, or to inter-specific hybridization.
We used microsatellites to delimit gene pools and obtain genetic diversity estimates in individuals morphologically determined as E. coriacea from several sites across French Guiana and in sympatric Eschweilera individuals determined as belonging to closely related species of the Parvifolia clade. We addressed the following specific questions:
(1) Does the delimitation of gene pools in the Parvifolia clade coincide with the species determination based on mor-phology in French Guiana? Which species are best supported by genetic data?
(2) Is the hyperdominant E. coriacea a single cohesive spe-cies or a complex of cryptic spespe-cies? Does it harbour indi-cations of stronger genetic structure, indicating cryptic lin-eages, and/or higher diversity, a proxy for adaptability, in comparison with other species, and how is the variation dis-tributed geographically?
MATERIAL AND METHODS
Study species and sample collection
The Lecythidaceae family in the New World, known as the Lecythidoideae subfamily, comprises ten genera and 215 described species with a centre of geographic distribution in Amazonia (Huang et al. 2015; Mori et al. 2017). Neotropi-cal Lecythidaceae are sub-canopy to canopy-emergent trees with fibrous bark, and distinctive showy and morphological-ly diverse flowers with either actinomorphic or zygomorphic androecia (Prance & Mori 1979; Mori & Prance 1990). The Parvifolia clade, to which E. coriacea belongs, is character-ized by a closed androecium and a double coiled androecial hood. Another synapomorphy of this clade is the presence of a lateral aril on the seed (Huang et al. 2015). The flow-ers are visited and presumably pollinated by bees, as it is the
case for most Lecythidaceae species (Mori & Prance 1990). Lecythidoideae produce woody fruits; their seeds are grav-ity dispersed and are found in large numbers directly under the parent trees. Additionally, rodents and primates consume the seeds and might play a role in seed dispersal (Mori & Prance 1990). In Paracou, a lowland forest in French Guiana, sympatric Eschweilera species have different preferences for soil water availability, e.g. E. coriacea prefers wetter habitats than E. sagotiana Miers (Allié et al. 2015), although their ecological tolerance is broad and niches are largely over-lapping (S. Schmitt, Univ. Bordeaux, INRAE, France, pers. com.). Flowering occurs synchronously in October-Novem-ber and leaf trait variation is also largely overlapping among species (S. Schmitt and M. Heuertz, pers. obs.).
We sampled sympatric Eschweilera species at nine loca-tions mostly within and sometimes close to forest inventory plots of the GUYAFOR and GUYADIV networks ( http://atd-nmorphospecies.myspecies.info/node/781) in French Guia-na, in North-Eastern South America (table 1, supplementary file 1). Leaf material of 152 individual trees was collected, representing 11 species. Botanical determinations were reached through a continual effort over years in repeated in-ventories of marked trees, using the vegetative and reproduc-tive characters described in Flora Neotropica (Mori & Prance 1990) and “The Lecythidaceae Pages”, a website based on Flora Neotropica (Mori & Prance 1990) and maintained by S.A. Mori, N.P. Smith, X. Cornejo and G.T. Prance (http:// sweetgum.nybg.org/science/projects/lp/); a subset of indi-viduals had reproductive characters at the time of sampling: E. apiculata (Miers) A.C.Sm., E. chartaceifolia S.A.Mori, E. collina Eyma, E. coriacea (DC.) S.A.Mori, E. decolorans Sandwith, E. micrantha (O.Berg) Miers, E. parviflora Mart. ex DC., E. pedicellata (Rich.) S.A.Mori, E. sagotiana Miers, E. wachenheimii (Benoist) Sandwith and E. sp. 3, an as yet undescribed putative species which resembles E. grandiflora (Aubl.) Sandwith but has distinctly smaller leaves and can co-occur sympatrically with E. grandiflora in the absence of morphologically intermediate individuals (J.-F. Molino and D. Sabatier, pers. obs.). As reference specimen for this puta-tive taxon, we used voucher Sabatier & Molino 4945: this specimen has flowers, and duplicates are deposited in CAY, K, NY and P. Special emphasis in the sampling was on E. co-riacea, represented by 56 individuals (table 1, supplementary file 1). The plant material was dried in paper bags with silica gel immediately after collection in the field. A subset of the individuals collected were vouchered and deposited at the Herbier IRD de Guyane (CAY) or in the GUYADIV working collection at IRD-Cayenne (supplementary file 1).
Microsatellite isolation and screening
For microsatellite (simple sequence repeat, SSR) isolation, four trees identified as E. coriacea, E. parviflora, E. simiorum (Benoist) Eyma or E. wachenheimii were sampled in French Guiana. Total DNA was extracted from dried leaf or cam-bium materials following a CTAB method (Doyle & Doyle 1987). SSR-enriched libraries were constructed following the protocol of Techen et al. (2010). Briefly, DNA was di-gested with AluI and HaeIII restriction enzymes, and ligated with SSRLIB3 adapter. Three libraries for each species were built by hybridization to biotinylated oligo repeats groups,
[(AC)13 +(AACG)5 +(AGG)8], [(AG)12+(ATC)8 +(AAC)8] or [(ACAG)6 +(ACCT)6]. Enriched libraries were PCR ampli-fied and PCR products were puriampli-fied and pooled in equimo-lar mixtures for selection of 250-450 bp fractions by electro-phoresis on a BluePippin (Sage Science, Beverly, MA, USA) instrument. The microsatellite-enriched DNA libraries were sequenced on an Ion Proton™ system (Thermo Fisher Sci-entific, Waltham, MA, USA) at the Genome Transcriptome Platform of Bordeaux. Adapters were removed using cuta-dapt, version 1.2.1 (Martin 2011) and reads were trimmed using Sickle (Joshi & Fass 2011) based on a sliding window approach and a minimum Phred score of 20; reads shorter than 80 bases after trimming were removed. The quality of the remaining reads was checked using FastQC version 0.10.0 (https://www.bioinformatics.babraham.ac.uk/projects/ fastqc/). The resulting reads were assembled using the de-fault options of CAP3 (Huang & Madan 1999), and micro-satellite loci were identified using the QDD pipeline version 3.0 (Meglécz et al. 2010). Primer pairs were designed using Primer3 version 0.4.0 (Rozen & Skaletsky 2000).
In total, 34000 reads were assembled into 7282 sequences which contained SSRs. Twenty primer pairs were tested on 39 Lecythis and Eschweilera species. Of these, three ampli-fied reliably and were scorable in Eschweilera species of the Parvifolia clade: eschw11740, eschw5831 and eschw64683 (supplementary file 2). We also tested nine primer pairs de-veloped for Eschweilera ovata (Cambess.) Mart. ex Miers, a species endemic of the Brazilian Atlantic forest (Santos et al. 2019): a single locus, EO25, amplified reliably and was scorable in Eschweilera species from the Parvifolia clade (supplementary file 2). Overall, four loci were used for geno-typing: the EO25 locus and the three newly developed loci.
DNA extraction and microsatellite genotyping
Genomic DNA was extracted from all 152 samples follow-ing the CTAB protocol (Doyle & Doyle 1987). DNA concen-trations were measured using a Nanodrop spectrophotometer
(Thermo Fisher Scientific, Waltham, MA, USA) and samples were diluted to 10 ng/µL. The four SSR markers were PCR amplified in two mixes using 5’-labelled forward primers in combination with the Qiagen Multiplex PCR kit (Qiagen, Hilden, Germany). Reactions contained 1 µL DNA (10 ng/ µL), 5 µL of 2x Qiagen Multiplex PCR Master Mix, 3 µL ultrapure water and 1 µL of primer mix (10 µM of each for-ward and reverse primers). The amplification reaction was performed on a Veriti 96-Well Thermal Cycler (Applied Bio-systems, Foster City, Canada) using the following protocol: initial denaturation step at 95°C for 15 min, followed by 30 cycles of 30 s denaturation at 94°C, 90 s annealing at 60°C, 60 s extension at 72°C, and a final extension step at 60°C, for 30 min. Amplified fragments were separated on an automat-ed capillary sequencer (ABI 3700, Appliautomat-ed Biosystems, Fos-ter City, CA, USA). Fragment sizes were deFos-termined using ABI GeneMapper v4.1 (Applied Biosystems) in comparison with the GeneScan™ 500 LIZ™ dye size standard (Applied Biosystems), and binned into alleles manually using the fre-quency distribution of observed fragment sizes. Up to four alleles per genotype were found for three of the loci, we thus suspected our taxa to be tetraploid or paleopolyploids that are diploidized to some extent (Parisod et al. 2010), as had previously been suggested for the related Brazil nut, Berthol-letia excelsa (Buckley et al. 1988).
Genome size and ploidy
The chromosome base number for Lecythidaceae is x = 17 (Mori et al. 2007 and references therein) and several species of the Neotropical Bertholletia clade belonging to the non-monophyletic genera Eschweilera and Lecythis are diploid with x = 17 (Kowal et al 1977; Kowal 1989 and references therein); for the diploid Bertholletia excelsa Bonpl. haploid genome size was estimated by flow cytometry to 930–940 Mbp (de Barros et al. 2019). To obtain information on ge-nome size for comparison with data from the literature and to detect any possible ploidy differences between the studied
Sample site Lat Lon Eap Ech Ecol Ecor Ed Em Epa Epe Esa Esp3 Ew per siteTotal
Acarouany 4.08 -52.69 15 15 Bafog 5.55 -53.88 13 1 14 Beiman 4.46 -54.13 1 1 1 4 4 1 7 13 8 40 Mont Emerillon 3.26 -53.19 1 1 Montagne Tortue 4.30 -52.37 4 4 Montagne Trésor 4.60 -52.22 3 3 Nouragues 4.09 -52.70 3 3 Paracou 5.33 -52.92 1 10 18 17 1 47
Piste de Saint Elie 5.28 -53.08 2 1 3 3 4 3 3 3 3 25 Total per species 3 2 2 56 21 8 5 10 33 8 4 152
Table 1 – Sample sizes per species and per location of 152 Eschweilera samples from the Parvifolia clade included in this study.
Species name abbreviations: Eap, E. apiculata; Ech, E. chartaceifolia; Ecol, E. collina; Ecor, E. coriacea; Ed, E. decolorans; Em, E.
Eschweilera species, we collected leaf or flower bud tissue from nine individuals in the Paracou inventory site represent-ing six Eschweilera species (E. coriacea, E. grandiflora, E. pedicellata, E. sagotiana, E. squamata and E. wachenheimii) as well as one related outgroup species, Lecythis persistens Sagot, and conserved the tissues in RNAlater (Qiagen) un-til flow cytometry analysis at the University of Coimbra. Nuclear suspensions were obtained following Galbraith et al. (1983) by chopping RNA-later conserved tissue of the studied species and fresh leaf tissue of Pisum sativum ‘Cti-rad’ (internal reference standard, 2C = 9.09 pg; Doležel et al. 1998) in 1 ml of WPB buffer (Loureiro et al. 2007). The nuclear suspension was then filtered using a 50 µm nylon mesh and 50 µg / ml of propidium iodide (PI, Fluka, Bu-chs, Switzerland) and 50 µg/ml of RNAse (Fluka, BuBu-chs, Switzerland) were added. Samples were analysed in a Partec CyFlow Space flow cytometer (Partec GmbH., Görlitz, Ger-many; 532 nm green solid-state laser, operating at 30 mW) and results were acquired using Partec FloMax software ver-sion 2.4d (Partec GmbH, Münster, Germany).
Genetic diversity
Flow cytometry did not detect any ploidy differences be-tween samples (see Results) and data was congruent with the literature (see Discussion), we thus assumed that allele number variation for all species and loci was due to paleo-polyploidy, i.e., to a single ancient genome duplication event common to all the species and loci studied (see Discussion). Since duplicated copies of the analysed SSR loci could not be separated in our data, we used an autotetraploid model for downstream data analysis (Hardy 2016) to account for this probable ancient genome duplication. We used SPAGEDI version 1.5a (Hardy & Vekemans 2002) to estimate multi-locus genetic diversity parameters at the level of a) species, b) gene pools (for gene pool delimitation, see below) and c) sampling sites of E. coriacea. The genotypes with a single allele or with four alleles were coded as unambiguous tetra-ploid homozygotes or heterozygotes, respectively, whereas genotypes with two or three alleles were coded as incomplete genotypes to account for allele copy number ambiguity. We calculated the effective number of alleles Nae, the expected heterozygosity HE, the observed heterozygosity HO, the in-breeding coefficient FIS, and we estimated the allelic richness for a standardized sample size of eight gene copies, AR(k=8). Standard errors (SE) for HE and HO were calculated based on the standard deviation of estimates from data subsets repre-senting the four possible combinations of three SSRs. Sig-nificance levels for FIS to deviate from zero, i.e., deviation from Hardy-Weinberg genotypic proportions, were assessed by 10 000 permutations of gene copies among individuals.
We wished to gain insight into the relationship between the abundance of a species and its genetic diversity, to ad-dress the hypothesis that hyperdominant species have in-creased genetic diversity, a proxy for inin-creased adaptive potential (Hoffmann et al. 2017). We attributed a relative rank of demographic abundance to each investigated species based on raw occurrence data (supplementary file 3) from the GUYAFOR and GUYADIV networks of forest inven-tory plots, representing a total of 316 plots of 0.12 to 0.16 ha and ca. 143 000 stems inventoried, and we performed
lin-ear regression analysis and a Splin-earman rank correlation test between allelic richness and ranked abundance in R version 3.5.0 (R Development Core Team 2008).
Gene pool delimitation and genetic structure
Gene pool delimitation in the SSR data was conducted using the Bayesian clustering algorithm implemented in STRUC-TURE 2.3.4 (Pritchard et al. 2000), using a tetraploid geno-types model that is robust to allele copy number ambiguity (Falush et al. 2007). The data matrix was converted from the GeneMapper output to a STRUCTURE input file that ac-counts for allele copy number ambiguity using the R package polysat version 1.7-2 (Clark & Jasieniuk 2011) in R version 3.5.0 (R Development Core Team 2008). In STRUCTURE, ambiguity of allele copy number was accounted for by us-ing RECESSIVEALLELES = 1 and settus-ing the recessive allele code to MISSING, “-9”, as described in the software documentation. To infer individual assignment proportions q in K gene pools, or genetic clusters, we used an admixture model with correlated allele frequencies between clusters, running ten repetitions for each K, with K = 1 to K = 18, us-ing a burn-in length of 100 000 and a run length of 200 000 MCMC steps. The results were summarized using STRUC-TURE Harvester web software version 0.6.94 (Earl & von-Holdt 2012) and the Clumpak server (Kopelman et al. 2015). The number of clusters K that best describes the data struc-ture was determined based on the posterior log likelihood of runs plotted against K and using the delta K approach (Evan-no et al. 2005).
These analyses were carried out a) on the full data set of 152 Eschweilera samples, b) on a reduced data set of 136 samples including only the six species represented by at least eight individuals: E. coriacea, E. decolorans, E. micrantha, E. pedicellata, E. sagotiana and E. sp. 3 and c) on 56 in-dividuals determined as E. coriacea. We assessed the con-gruence of genetic and morphological species delimitation by comparing the assignment of individuals to gene pools at a threshold of STRUCTURE ancestry proportion q > 0.875 with their botanical determination. The q > 0.875 threshold was chosen because this assignment category is expected to contain genetically pure individuals and second- or later-gen-eration backcrosses (Guichoux et al. 2013), and should thus a priori allow us to identify individuals confidently assigned to their respective gene pools, or candidate genetic species.
Additionally, we conducted a principal component analy-sis (PCA) using the function dudi.pca() implemented in the adegenet package (Jombart 2008) in R version 3.5.0 (R De-velopment Core Team 2008). For this, the genotype matrix was converted to a genind object with presence and absence data of alleles using polysat version 1.7-2 (Clark & Jasieniuk 2011).
Genetic differentiation
Population genetic differentiation was assessed as overall and as pairwise FST (Weir & Cockerham 1984) between spe-cies and between gene pools (individuals assigned with q > 0.875) in SPAGEDI. Significance was assessed by 10 000 permutations of individuals among species or gene pools. To correct for multiple testing, a false discovery rate approach
ID Species 2C (pg) 1C (pg) 1C (Mbp) P13-2-146 E. coriacea 1.94 0.97 950.8 P1-1-1009 E. coriacea 1.78 0.89 871.3 P1-2-221 E. grandiflora 1.93 0.96 942.9 P13-2-881 E. pedicellata 2.14 1.07 1046.1 P13-4-806 E. sagotiana 1.98 0.99 970.4 P13-2-455 E. squamata 1.92 0.96 940.0 P13-1-2911 E. wachen-heimii 1.72 0.86 842.3 P13-1-753 L. persistens 1.89 0.95 924.7
Table 2 – Genome size estimates obtained through flow cytometry in six Eschweilera and one Lecythis species.
Tissues were sampled in Paracou, French Guiana. ID, individual tree code in the Paracou inventory plot. Holoploid genome size was measured in pg; it was assumed to correspond to 2C.
Species n genotypes missing (%)
incomplete genotypes
(%) Nae AR(k=8) HE (SE) HO (SE) FIS
E. apiculata 3 25.0 41.7 4.89 n.a. 0.460 (0.089) 0.417 (0.084) 0.254 * E. chartaceifolia 2 25.0 25.0 1.49 n.a. 0.505 (0.069) 0.375 (0.080) 0.822 * E. collina 2 12.5 37.5 2.20 n.a. 0.497 (0.057) 0.375 (0.080) 0.481 n.s. E. coriacea 56 5.8 50.9 5.34 4.20 0.751 (0.024) 0.559 (0.044) 0.477 *** E. decolorans 21 3.6 46.4 3.77 3.79 0.709 (0.015) 0.487 (0.061) 0.506 *** E. micrantha 8 12.5 25.0 3.14 3.28 0.621 (0.030) 0.396 (0.059) 0.540 *** E. parviflora 5 0.0 45.0 4.05 3.22 0.663 (0.035) 0.500 (0.021) 0.528 *** E. pedicellata 10 10.0 45.0 3.19 3.32 0.650 (0.019) 0.580 (0.069) 0.233 ** E. sagotiana 33 2.3 46.2 2.37 2.68 0.516 (0.034) 0.498 (0.060) 0.262 *** E. sp. 3 8 15.6 46.9 2.33 2.65 0.524 (0.033) 0.504 (0.060) 0.265 ** E. wachenheimii 4 0.0 43.8 2.67 2.67 0.583 (0.026) 0.563 (0.085) 0.129 n.s. All species confounded 152 6.3 46.2 4.87 4.24 0.772 (0.013) 0.521 (0.051) 0.524 ***
Table 3 – Genetic diversity in Eschweilera species.
Missing genotypes, unsuccessful amplification; incomplete genotypes, genotypes with two or three alleles recorded; Nae, effective number of alleles; AR(k=8), allelic richness for a sample size of 8 allele copies; HE, expected heterozygosity (standard error); HO, observed heterozygosity;
FIS, inbreeding coefficient (significance levels: n.s., not significant; *, P < 0.05; **, P < 0.01, ***, P < 0.001); n.a., not available.
was applied using the R package qvalue version 2.8.0 (Storey 2003) in R version 3.5.0 (R Development Core Team 2008).
We also assessed isolation by distance in E. coriacea at the level of sampling locations by regressing pairwise FST/ (1- FST) values on the logarithm of pairwise spatial distance (Rousset 1997) and at the individual level by regressing pairwise kinship coefficients (Loiselle et al. 1995) between individuals on the logarithm of pairwise spatial distances (Vekemans & Hardy 2004), and using permutation tests in SPAGEDI. For the analysis at the individual level, we added random within-location variation to individual coordinates because exact individual coordinates were unknown.
RESULTS
Genome size and ploidy
Eight of the nine samples, all representing leaf tissue, were analysed successfully with flow cytometry and yielded hol-oploid genome size estimates comprised between 1.72 and 2.14 pg for all species (table 2); no differences in ploidy were detected among the samples. Based on the literature (Kowal et al. 1977; Kowal 1989; de Barros et al. 2019) we assumed holoploid genomes to represent diploids, which led to the es-timation of haploid genome sizes of 1C = 842 to 1047 Mbp for the analysed Eschweilera species (table 2).
Genetic diversity and differentiation of Eschweilera species
All 152 samples belonging to 11 Eschweilera species were successfully genotyped at a minimum of three of the four SSR markers. SSR profiles commonly displayed up to four alleles per genotype, suggesting that the investigated Esch-weilera species represent diploidized paleopolyploids which retain duplicated copies at some loci. Specifically, genotypes with three or four alleles were found in all species, except in the two species with the lowest sample sizes (E. collina and E. chartaceifolia, n = 2 each). Since alleles from dupli-cated loci could not be told apart, we analysed the data using a tetraploid framework. A total of 56 alleles were detected across the four loci, with 7 to 21 alleles per locus (supple-mentary file 2). Expected heterozygosity and allelic rich-ness at the species level were highest in E. coriacea (HE = 0.751, AR(k=8) = 4.1) and lowest in E. sp. 3 (HE = 0.524, AR(k=8) = 2.65) and E. sagotiana (HE = 0.516, AR(k=8) = 2.68), con-sidering only species with at least eight individuals assessed
(table 3). The inbreeding coefficients were positive and devi-ated significantly from zero in most species (table 3).
A positive trend was identified between demographic abundance of species and allelic richness (fig. 1), with the fitted regression equation AR(k=8) = 2.842 + 0.085 x (abun-dance rank), R2 = 0.138, however the relationship was not
significant (Spearman signed rank correlation rho = 0.452; p-value = 0.268). Eschweilera sagotiana was the most abun-dant species in French Guiana, however, its allelic richness was lower than expected based on the equation.
Genetic differentiation between species represented by at least eight individuals was significant, with global FST = 0.193 (P < 0.001). Pairwise FST was significant for all pairs of species, except for E. decolorans and E. pedicellata, and was highest between E. sagotiana and E. sp. 3, FST = 0.464, P < 0.001 (table 4).
Inference of gene pools, their composition and genetic diversity
The Bayesian genetic clustering analysis in STRUCTURE revealed a hierarchical structure for the complete data set.
E. decolorans E. micrantha E. pedicellata E. sagotiana E. sp. 3
E. coriacea (56) 0.076 *** 0.141 *** 0.078 ** 0.249 *** 0.107 ** E. decolorans (21) 0.163 ** 0.039 n.s. 0.253 *** 0.224 *** E. micrantha (8) 0.184 ** 0.266 *** 0.348 *** E. pedicellata (10) 0.335 *** 0.289 *** E. sagotiana (33) 0.464 *** E. sp. 3 (8)
Table 4 – Pairwise genetic differentiation (FST) between Eschweilera species.
Only species with at least eight individuals were considered. Numbers in brackets indicate the number of samples. Significance was assessed using 10 000 permutations. Significance levels based on corrected P-values: n.s., not significant; **P < 0.01, ***P < 0.001.
● ● ● ● ● ● ● ● 0 1 2 3 4 5 E. sp . 3 E. wachenheimiiE. pedicellat a E. decolor ans E. par viflor a E. micr antha E. cor iacea E. sagot iana
Increasing demographic abundance in French Guiana AR(k=
8)
Figure 1 – Regression of allelic richness on ranked demographic
abundance of Eschweilera species from the Parvifolia clade in French Guiana.
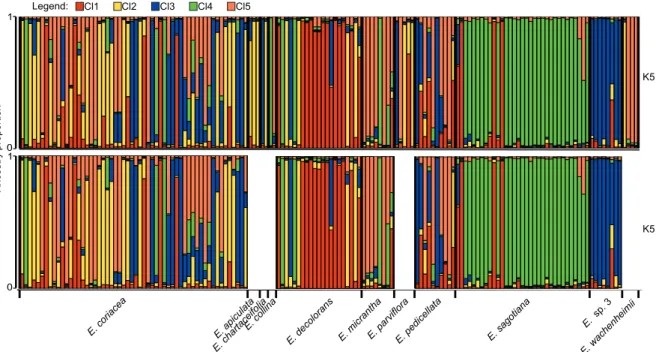
Figure 2 – Evaluation of the number of genetic clusters using
STRUCTURE on 152 Eschweilera samples. A. The posterior
log-likelihood of data as a function of the number of clusters, K, showed increasing values with increasing K. B. The delta K statistic showed
an optimum at K = 2 and a secondary peak at K = 5.
The delta K statistic indicated optima at K = 2 and K = 5 ge-netic clusters and log-likelihood values per run increased as a function of K (fig. 2). There was low inter-run variation in log-likelihood (fig. 2) and Clumpak revealed that clustering solutions converged among runs for K = 5 (mean similarity score = 0.982; supplementary file 4). For larger K values, ad-ditional structuring emerged although the number of individ-uals assigned to clusters with high ancestry proportion (q > 0.875) decreased (supplementary file 4); we thus considered K = 5 as a robust clustering solution in view of the resolution of our data. Assignment of individuals to K = 5 gene pools
(q > 0.875) showed that only two gene pools coincided well with the species determination based on morphology: most individuals of Eschweilera sagotiana were assigned to Cl4 (73 %) and most E. sp. 3 individuals were assigned to Cl3 (87.5%, table 4, fig. 3). Eschweilera decolorans and E. mi-crantha also had 50% or more of their individuals assigned to a single gene pool, Cl1 and Cl5, respectively, other indi-viduals being admixed or assigned to other gene pools (table 5, fig. 3). For E. coriacea the levels of genetic diversity and structure were particularly high: it had individuals assigned
to all five gene pools, and a high proportion (52%) of its in-dividuals were admixed between two or more gene pools (ta-ble 5, fig. 3).
Genetic diversity was highest in Cl2 with HE = 0.757 and AR(k=8) = 3.95 (table 5). In Cl2, nine out of 18 individuals were determined as E. coriacea (table 5). Genetic diversity was lowest in Cl4 (HE = 0.379; AR(k=8) = 2.18) which coin-cided mostly with E. sagotiana. Inbreeding coefficients were positive and significant in four of the five gene pools (table 6). Species Cl1 Cl2 Cl3 Cl4 Cl5 Admixed n E. apiculata 2 (66.7) 1 (33.3) 3 E. chartaceifolia 1 (50.0) 1 (50.0) 2 E. collina 1 (50.0) 1 (50.0) 2 E. coriacea 3 (5.4) 9 (16.1) 7 (12.5) 2 (3.6) 6 (10.7) 29 (51.8) 56 E. decolorans 12 (57.1) 3 (14.3) 1 (4.8) 2 (9.5) 3 (14.3) 21 E. micrantha 1 (12.5) 4 (50.0) 3 (37.5) 8 E. parviflora 2 (40.0) 1 (20.0) 1 (20.0) 1 (20.0) 5 E. pedicellata 2 (20.0) 1 (10.0) 7 (70.0) 10 E. sagotiana 3 (9.1) 24 (72.7) 6 (18.2) 33 E. sp. 3 7 (87.5) 1 (12.5) 8 E. wachenheimii 1 (25.0) 3 (75.0) 4 Totals 18 18 19 30 16 51 152
Table 5 – Assignment Eschweilera species to STRUCTURE clusters.
Assignment of number of individuals (percentage) per Eschweilera species to the five STRUCTURE clusters Cl1–Cl5 (individual assignment threshold q > 0.875). E. apicula ta E. chart aceifolia E. coriace a E. collina E. decolor ans E. m icrant ha E. parvif lora E. pedicel lata E. sagot iana E. sp. 3 E. wachenheim ii 1 0 1 0
E.coriacea E.decoloransE.micranthaE.pedicellataE.sagotiana E.sp_3
Cl1 Cl2 Cl3 Cl4 Cl5 Legend: K5 K5 Ancest ry pr opor tion
Figure 3 – STRUCTURE bar plot displaying ancestry proportions of Eschweilera individuals (vertical bars) in each of five clusters (coloured
segments in each bar). The results are very similar for the complete data set (n = 152, above) and the data including only species with at least eight individuals sampled (n = 136, below).
Genetic differentiation between gene pools (samples as-signed with ancestry proportion q > 0.875) was significant, with FST = 0.304 for K = 2, and FST = 0.390 for K = 5, with pairwise values from FST = 0.162 to FST = 0.530 (all values P < 0.001, table 7). The highest level of differentiation was found between Cl3 and Cl4, largely represented by species E. sp. 3 and E. sagotiana, in agreement with the differentia-tion pattern found at the species level.
The STRUCTURE analysis on the six species with at least eight individuals confirmed the hierarchical structure in the data (supplementary file 4), with a clustering result for K = 5 that was very similar to the STRUCTURE result on the complete data set (fig. 3, supplementary file 4).
The first three axes of the PCA explained jointly 35.09% of the variance in the data. Eschweilera sagotiana formed a relatively cohesive cluster at negative values of PCA1 which only overlapped little with other species (fig. 4). Eschwei-lera coriacea was widely scattered in the PCA space (fig. 4). STRUCTURE clusters overlapped with each other but showed a more segregated distribution in the PCA space than morphologically determined Eschweilera species (fig. 4).
Genetic structure and diversity in Eschweilera coriacea
The STRUCTURE analysis of n = 56 individuals determined as E. coriacea revealed an optimum at K = 2 (supplementary file 4.3) but differentiation between the two clusters was low and not significant (FST = 0.010 n.s.).
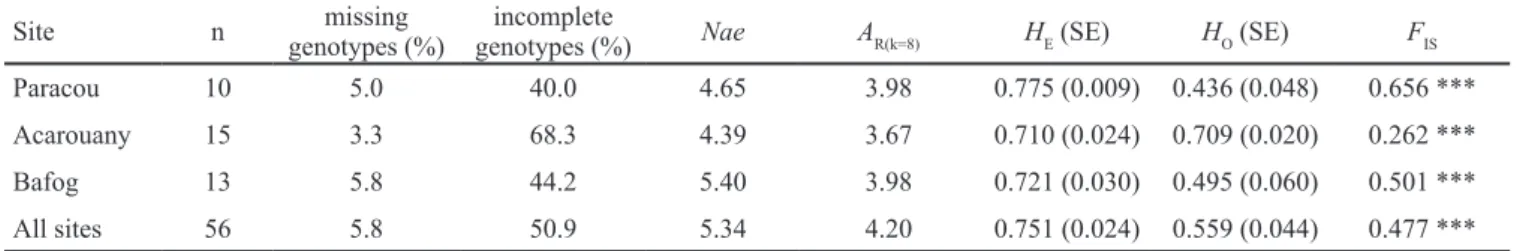
No isolation by distance was detected in E. coriacea, neither at the sampling site nor at the individual level (sup-plementary file 5). Genetic diversity estimates in E. coriacea
could only be estimated for three sites (Paracou, Acarouany and Bafog) which were represented by at least 10 samples. Heterozygosity and allelic richness were high and very simi-lar in the three sites, 0.710 ≤ HE ≤ 0.775; 3.67 ≤ AR(k=8) ≤ 3.98 (table 8).
DISCUSSION
Can SSR markers resolve evolutionary relationships between Eschweilera species from the Parvifolia clade?
Our SSR data on eleven species of Eschweilera belonging to the Parvifolia clade displayed a signature of paleopolyploidy at both the species and the gene pool levels. Other species of the Bertholletia clade are diploid (e.g., Bertholletia excelsa, Eschweilera pittieri, Eschweilera neei, Lecythis minor, Lecy-this tuyrana; Kowal et al. 1977; Kowal 1989 and references therein) and our haploid genome size estimates were of the same order of magnitude, ca. 1 Gbp, as those of Bertholletia excelsa. We therefore suggest a single, common paleopoly-ploid origin for the locus duplications observed in our data set: these loci appear to have remained in duplicated state whereas other parts of the genome appear to have diploidized (Parisod et al. 2010) probably resulting in a diploid karyo-type in most species of the Bertholletia clade. The suggested paleopolyploid origin could coincide with an ancient genome duplication event reported at the base of the Ericales order to which the Lecythidaceae belong (Shi et al. 2010).
The power of our genetic data to discriminate species was relatively poor, considering that the most robust clus-tering solution revealed only five gene pools in our data, as
Cl n genotypes (%)# missing genotypes (%)# incomplete Nae AR(k=8) HE (SE) HO (SE) FIS
Cl1 18 4.2 50.0 2.41 2.65 0.509 (0.051) 0.550 (0.070) 0.051 n.s. Cl2 18 12.5 41.7 4.79 3.95 0.757 (0.019) 0.500 (0.040) 0.565 *** Cl3 19 7.9 39.5 3.04 2.85 0.581 (0.035) 0.446 (0.070) 0.381 *** Cl4 30 1.7 39.2 1.92 2.18 0.379 (0.027) 0.428 (0.060) 0.096 * Cl5 16 6.3 50.0 3.19 3.13 0.641 (0.015) 0.607 (0.041) 0.288 *** All Cls 101 5.9 43.3 4.86 4.24 0.772 (0.015) 0.492 (0.055) 0.545 ***
Table 6 – Genetic diversity estimates for STRUCTURE clusters Cl1–Cl5 in the Eschweilera data set.
Individuals were assigned to clusters based on an assignment threshold q > 0.875; n, number of individuals assigned. Nae, effective number of alleles; AR(k=8), allelic richness for a sample size of 8 allele copies; HE, expected heterozygosity (SE, standard error); HO, observed heterozygosity; FIS, inbreeding coefficient. Significance levels: n.s., not significant; *, P < 0.05; **, P < 0.01; ***, P < 0.001.
Cl2 Cl3 Cl4 Cl5 Cl1 (18) 0.255 *** 0.327 *** 0.528 *** 0.271 *** Cl2 (18) 0.162 *** 0.467 *** 0.166 *** Cl3 (19) 0.530 *** 0.294 *** Cl4 (30) 0.415 *** Cl5 (16)
Table 7 – Pairwise genetic differentiation (FST) between STRUCTURE clusters C1–Cl5 in the Eschweilera data set.
Individuals were assigned to clusters based on an assignment threshold q > 0.875; number of individuals assigned in brackets. Significance levels based on corrected P-values: ***P < 0.001.
Site n genotypes (%)missing genotypes (%)incomplete Nae AR(k=8) HE (SE) HO (SE) FIS
Paracou 10 5.0 40.0 4.65 3.98 0.775 (0.009) 0.436 (0.048) 0.656 *** Acarouany 15 3.3 68.3 4.39 3.67 0.710 (0.024) 0.709 (0.020) 0.262 *** Bafog 13 5.8 44.2 5.40 3.98 0.721 (0.030) 0.495 (0.060) 0.501 *** All sites 56 5.8 50.9 5.34 4.20 0.751 (0.024) 0.559 (0.044) 0.477 ***
Table 8 – Genetic diversity in Eschweilera coriacea.
Only sampling sites with at least 10 samples were included in this analysis. Missing genotypes, unsuccessful amplification; incomplete genotypes, genotypes with two or three alleles recorded; Nae, effective number of alleles; AR(k=8), allelic richness for a sample size of 8 allele copies; HE, expected heterozygosity (SE, standard error); HO, observed heterozygosity; FIS, inbreeding coefficient (significance levels: ***,
P < 0.001). −1.5 −1.0 −0.5 0.0 0.5 1.0 −1 .5 −0 .5 0.5 PCA1 (18.41 %) PCA 2 (9. 24 %) −1.5 −1.0 −0.5 0.0 0.5 1.0 −1 .5 −0 .5 0.5 PCA1 (18.41 %) PCA 3 (7. 45 %) −1.5 −1.0 −0.5 0.0 0.5 1.0 −1 .5 −0 .5 0.5 PCA1 (18.41 %) PCA 2 (9. 24 %) −1.5 −1.0 −0.5 0.0 0.5 1.0 −1 .5 −0 .5 0.5 PCA1 (18.41 %) PCA 3 (7. 45 %) Legend E. apiculata E. coriacea E. chartaceifolia E. decolorans E. micrantha E. parviflora E. pedicellata E. sp. 3 E. wachenheimii E. collina E. sagotiana Legend no Cluster Cl 1 Cl 5 Cl 2 Cl 3 Cl 4 A B C D
Figure 4 – Principal component analysis (PCA) of 152 Eschweilera individuals genotyped at four SSR loci. Colours and symbols indicate
the species determination of samples in plots A and B and the assignment to STRUCTURE clusters (threshold > 0.875 ancestry proportion) in plots C and D.
opposed to eleven species determined based on morphol-ogy. Marker number and information content of each mark-er strongly affect the clustmark-ering solution (Rosenbmark-erg et al. 2005). Despite the coarse resolution, we are confident that the five clusters recovered meaningful evolutionary relation-ships for the multilocus marker set in our study. Our genetic taxon delimitation represents an improvement over the use of plastid DNA sequences: a reexamination of the data of Gonzalez et al. (2009) and Caron et al. (2019) showed ex-tensive plastid haplotype sharing among species and did not allow to resolve evolutionary relationships in Eschweilera in the Parvifolia clade.
Groups of individuals assigned to genetic clusters were genetically more distinct from each other (FST = 0.390) than groups of individuals assigned to species based on morphol-ogy (FST = 0.193). This result should be interpreted with caution, considering the discrimination power of the data in combination with the markers and methods employed. The clustering solution of the STRUCTURE software can be biased by the sampling scheme, notably by unbalanced
sampling among populations (Kalinowski 2011), and by the stochastic lineage sorting specific to each marker (Orozco-terWengel et al. 2011). We believe that the first possible bias was limited, given that STRUCTURE results were consist-ent when using a subset of the data with even represconsist-entation among species. The paucity of loci did not allow us to ad-dress the second possible bias. Ideally, genetic species de-limitation should rely on a set of complementary approaches, and conclusions should only be based on a conservative in-terpretation of congruent results among methods (Carstens et al. 2013). According to Carstens et al. (2013), “in most con-texts it is better to fail to delimit species than it is to falsely delimit entities that do not represent actual evolutionary line-ages”. In our case, STRUCTURE, PCA and differentiation-based methods yielded congruent results for the delimitation of genetic clusters with our marker set.
Our data delimited gene pools that largely coincided with groups of samples morphologically determined as E. sp. 3 (Cl3) or E. sagotiana (Cl4) and, to a lesser extent, de-termined as E. decolorans (Cl1) or E. micrantha (Cl5). The
clusters identified with greatest confidence corresponded to the species pair that displayed the highest level of differentia-tion, E. sp. 3 and E. sagotiana, suggesting that these two spe-cies may represent the most divergent taxa in this sympatric species complex. In the fifth cluster, Cl2, 50% of individuals corresponded to E. coriacea, and there was a markedly lower agreement in the cluster definition vs. its species composition (see also below). The genetic heterogeneity of E. coriacea may largely account for such mismatch, although hybridi-zation between closely related taxa in the Parvifolia clade (Caron et al. 2019) may also contribute to hindering taxon delimitation with a limited number of markers.
Reasons for poor congruence between morphological and genetic species delimitation
Morphological and genetic species delimitations represent different abstractions to deal with the complex reality that biodiversity represents. Since both abstractions rely on dif-ferent species concepts (de Queiroz 2007), they can be con-gruent, but are not necessarily expected to be. In our study, where marker resolution was low, only two out of eleven species showed a good congruence between genetic and morphological species delimitation. Hybridization and intro-gression, as suggested in the Parvifolia clade (Gonzalez et al. 2009; Huang et al. 2015; Caron et al. 2019) inevitably leads to low genetic differentiation between species, which causes challenges for genetic delimitation. In rainforest tree spe-cies complexes that contain lower numbers of spespe-cies than considered in our study, and where more powerful markers were used, genetic species delimitation has proven success-ful, e.g., in Carapa (Meliaceae), Erythrophleum (Fabaceae) and Milicia (Moraceae) (Duminil et al. 2006, 2010; Daïnou et al. 2016). Another reason for poor congruence between morphological and genetic delimitation could be mistaken species identification based on morphology in our data, e.g., three individuals morphologically identified as Eschweilera sagotiana were assigned genetically to the cluster mainly identified as E. decolorans (Cl1 in red, in fig. 3).
Choice of molecular approaches for taxon delimitation
We chose to use SSR data and methods based on allele fre-quency differences for gene pool delimitation in the Parvi-folia clade. Given the expected large population sizes in E. coriacea (ter Steege et al. 2006, 2013) and the lack of phy-logenetic signal using plastid DNA markers in the Parvifolia clade (Gonzalez et al. 2009; Caron et al. 2019), we assumed that evolutionary relationships may be shallow in the clade, which is why we opted for population genetic, rather than phylogenetic approaches for species delimitation (Medrano et al. 2015; Luo et al. 2018). Indeed, coalescent theory shows that the expected time to the most recent common ancestor (TMRCA) for any two homologous sequences is equal to the effective population size, Ne, in numbers of generations, Ne being the size of a (diploid) population evolving according to a Wright-Fisher model with random mating and discrete generations (Nordborg 2001). In the absence of inter-specif-ic gene flow, the performance of phylogenetinter-specif-ic methods for species delimitation depends on the ratio of population size to divergence time (Luo et al. 2018): phylogenetic methods
tend to succeed if species divergence time is (substantially) older than the mean TMRCA of gene copies within species (Maddison 1997; Rosenberg & Nordborg 2002). For hypera-bundant and widespread tree species that maintain huge pop-ulation sizes over large areas due to efficient seed and pollen dispersal, this condition is unlikely to be fulfilled. Even if Ne is often much smaller than the census population size N, for example because of variation in reproductive success (Hartl 2000), the TMRCA of gene copies in hyperabundant species is likely to be many million years in the past, and should thus regularly fall within the ancestral species, before the specia-tion event(s) of interest. The large effective populaspecia-tion sizes of common rainforest trees are thus the main reason why phylogenetic trees are often poorly resolved (Pennington & Lavin 2016). An analogous situation is observed in the co-nifer genus Pinus, in which evolutionary relationships were long debated (Willyard et al. 2009), and where it took a set of 21 low-copy nuclear genes with 665 SNPs to obtain a phy-logeny with concordant placement of > 75% of the species in the subgenus Pinaster, the Mediterranean pines (Grivet et al. 2013). Conversely, SSR markers and population genomic approaches led to successful genetic species delimitation in tropical tree species complexes (Duminil et al. 2012; Daïnou et al. 2016). A prospect for a better phylogenetic resolution and a correct inference of evolutionary relationships is nev-ertheless offered by the use of multi-locus approaches in a multi-species coalescent framework (Knowles & Carstens 2007; Degnan & Rosenberg 2009; Mirarab et al. 2014).
Genetic constitution and hyperdominance
Our results based on four SSRs suggested that Eschweilera coriacea was genetically more diverse and more heterogene-ous than related Eschweilera species, i.e., E. sagotiana, E. sp. 3, E. decolorans and E. pedicellata occurring sympatri-cally with E. coriacea in French Guiana. Although E. co-riacea individuals were assigned to several genetic clusters when other species were included in the analysis, significant evidence of several genetic clusters was not found when only the morphologically determined E. coriacea individuals were analysed. Thus, given the limited power of our SSR markers, our data did not contain robust evidence for E. coriacea to be a complex of cryptic species in French Guiana. However, ab-sence of evidence is not evidence of abab-sence! Given the wide distribution of the species, with presence in all six Amazoni-an regions, Amazoni-and the weak but nevertheless significAmazoni-ant genetic structure in the species (FST = 0.059 in French Guiana), spa-tial and temporal population genetic processes are expected to occur, which make it indeed likely that E. coriacea may contain several biological species across Amazonia.
We observed a weak linear trend between allelic richness and ranked abundance of Eschweilera species. This relation-ship is not a robust biological result as it would most likely vary by excluding or adding taxa, sampling sites, loci. This relationship simply serves to illustrate our expectation that the level of genetic diversity of a population, the effective-ness of selection and the strength of genetic drift all depend on the effective population size Ne (Charlesworth 2009; Ho-ban et al. 2014; Hoffmann et al. 2017). The high diversity and heterogeneity of E. coriacea thus suggest that it harbours a larger Ne and a higher adaptive potential than other
sympa-trically occurring species, as expected for a hyperdominant tree species with a census population size as large as 5 × 10⁹
individuals across Amazonia (ter Steege et al. 2013). On the other hand, a high census population size is not necessarily a surrogate for high Ne. A notable outlier of our identified trend is E. sagotiana in French Guiana, in which diversity was more reduced, despite it being the most common Esch-weilera species in our inventories, and despite its large distri-bution across the Guianas and the Brazilian states of Amapá and Pará (The Lecythidaceae Pages, http://sweetgum.nybg. org/science/projects/lp/). The two most common Eschweil-era species in French Guiana appear thus to have contrasting evolutionary histories. This observation also illustrates that it is difficult to derive any causal relationship when observ-ing a biological pattern, such as that of hyperdominance. For instance, Arellano et al. (2014) observed a wider environ-mental tolerance in oligarchic than non-oligarchic species, which the authors interpreted as niche breadth causing domi-nance. But the opposite could also be true: dominant species are more widespread and thus they appear in more habitats, which results in greater observed realized niches, whereas rare species are observed less frequently, thus their niche breath may be poorly estimated or even biased.
A substantially larger set of genetic markers and a larger and more balanced sampling design should help to shed ad-ditional light on the genetic constitution of E. coriacea, the characterization of hybridization and introgression in the Parvifolia clade, and the evolutionary history of abundant vs. rare Eschweilera species, to understand the genetic under-pinnings of hyperdominance in Amazonian tree species.
Conclusions
Our data revealed high genetic diversity and heterogeneity, indicative of high adaptive potential, in the hyperdominant Eschweilera coriacea in comparison with other Eschweilera species of the Parvifolia clade with which it occurs sympatri-cally in French Guiana. However, we found no conclusive evidence for cryptic species within E. coriacea. Our data set had relatively poor power to delimit species in Eschweilera individuals from the Parvifolia clade, although delimitation power was improved in comparison with available plastid DNA markers. Promising avenues for future research on species delimitation and adaptive evolution in species com-plexes such as Eschweilera, Parvifolia clade, will be the combined use of morphological trait data, data on ecological niche characterization and genomic resequencing data using high throughput approaches.
SUPPLEMENTARY FILES Five supplementary files are associated to this paper:
(1) Sampling information on 152 Eschweilera individuals, STRUCTURE ancestry proportions and SSR data:
https://doi.org/10.5091/plecevo.2020.1565.2053
(2) Characteristics of SSR markers used in Eschweilera:
https://doi.org/10.5091/plecevo.2020.1565.2055
(3) Ranked census data of Eschweilera species belonging to the Parvifolia clade in French Guiana:
https://doi.org/10.5091/plecevo.2020.1565.2057
(4) STRUCTURE analysis in Eschweilera:
https://doi.org/10.5091/plecevo.2020.1565.2059
(5) Isolation by distance analysis in Eschweilera coriacea:
https://doi.org/10.5091/plecevo.2020.1565.2061
ACKNOWLEDGEMENTS
We thank Saintomer Cazal, Valérie Troispoux, Jocelyn Cazal and Patrick Heuret (UMR Ecofog) for help with field and/ or laboratory work, and Alain Franc, Stéphanie Mariette and Quentin Jehanne (UMR Biogeco) for stimulating discussions and preliminary work on the study system. We are grateful to our reviewers Gabriel Arellano and one anonymous col-league, as well as the editor André Simões for helpful sug-gestions on the manuscript. The accuracy of botanical iden-tifications in the GUYADIV and GUYAFOR plot networks is largely due to the availability, quality and continuous improvement of the collections held in the Herbier IRD de Guyane (CAY). The GUYADIV network is managed by IRD and the GUYAFOR network is managed by CIRAD and CNRS, with the contribution of Office National des Forêts Guyanaises (ONF). This work has benefited from an “Inves-tissement d’Avenir” grant managed by Agence Nationale de la Recherche (CEBA, ref. ANR-10-LABX-25-01). We also acknowledge support from INRA through the Innovation project OUTIREC, and from IRD through the GUYAMA-ZON programme, LECYTOMICS project. KBB acknowl-edges an IdEx individual postdoc fellowship from the Uni-versity of Bordeaux and an AgreenSkills+ mobility grant.
REFERENCES
Allié E., Pélissier R., Engel J., Petronelli P., Freycon V., Deblauwe V., Soucémarianadin L., Weigel J., Baraloto C. (2015) Pervasive local-scale tree-soil habitat association in a tropical forest com-munity. PLoS One 10(11): e0141488. https://doi.org/10.1371/ journal.pone.0141488
Antonelli A., Sanmartín I. (2011) Why are there so many plant species in the Neotropics? Taxon 60(2): 403–414. https://doi. org/10.1002/tax.602010
Arellano G., Cala V., Macía M.J. (2014) Niche breadth of oligar-chic species in Amazonian and Andean rain forests. Journal of
Vegetation Science 25(6): 1355–1366. https://doi.org/10.1111/ jvs.12180
Arellano G., Jørgensen P.M., Fuentes A.F., Loza M.I., Torrez V., Macía M.J. (2016) Oligarchic patterns in tropical forests: role of the spatial extent, environmental heterogeneity and diver-sity. Journal of Biogeography 43(3): 616–626. https://doi. org/10.1111/jbi.12653
Baraloto C., Hardy O.J., Paine C.E.T., Dexter K.G., Cruaud C., Dunning L.T., Gonzalez M.-A., Molino J.-F, Sabatier D., Sa-volainen V., Chave J. (2012) Using functional traits and phy-logenetic trees to examine the assembly of tropical tree com-munities. Journal of Ecology 100(3): 690–701. https://doi. org/10.1111/j.1365-2745.2012.01966.x
Barthlott W., Hostert A., Kier G., Küper W., Kreft H., Mutke J., Rafiqpoor M.D., Sommer J.H. (2007) Geographic patterns of vascular plant diversity at continental to global scales (Geogra-phische Muster der Gefäßpflanzenvielfalt im kontinentalen und globalen Maßstab). Erdkunde 61(4): 305–315. https://www.js-tor.org/stable/25648042
Buckley D.P., O’Malley D.M., Apsit V., Prance G.T., Bawa K.S. (1988) Genetics of Brazil “Nut” (Berhollelia excelsa Humb. & Bonpl.: Lecythidaceae): I. Genetic variation in natural popula-tions. Theoretical and Applied Genetics 76(6): 923–928. https:// doi.org/10.1007/BF00273682
Caron H., Molino J.-F., Sabatier D., Léger P., Chaumeil P., Scot-ti-Saintagne C., Frigério J.-M., Scotti I., Franc A., Petit R.J. (2019) Chloroplast DNA variation in a hyperdiverse tropical tree community. Ecology and Evolution 9(8): 4897–4905. htt-ps://doi.org/10.1002/ece3.5096
Carstens B.C., Pelletier T.A., Reid N.M., Satler J.D. (2013) How to fail at species delimitation. Molecular Ecology 22(17): 4369– 4383. https://doi.org/10.1111/mec.12413
Cavers S., Telford A., Arenal Cruz F., Pérez Castañeda A.J., Valen-cia R., Navarro C., Buonamici A., Lowe A., Vendramin G.G. (2013) Cryptic species and phylogeographical structure in the tree Cedrela odorata L. throughout the Neotropics.
Jour-nal of Biogeography 40(4): 732–746. https://doi.org/10.1111/ jbi.12086
Charlesworth B. (2009) Effective population size and patterns of molecular evolution and variation. Nature Reviews Genetics 10: 195–210. https://doi.org/10.1038/nrg2526
Clark L.V., Jasieniuk M. (2011) POLYSAT: an R package for polyploid microsatellite analysis. Molecular Ecology
Re-sources 11(3): 562–566. https://doi.org/10.1111/j.1755-0998.2011.02985.x
Daïnou K., Blanc-Jolivet C., Degen B., Kimani P., Ndiade-Bouro-bou D., Donkpegan A.S.L., Tosso F., Kaymak E., Bourland N., Doucet J.-L., Hardy O.J. (2016) Revealing hidden species di-versity in closely related species using nuclear SNPs, SSRs and DNA sequences – a case study in the tree genus Milicia. BMC
Evolutionary Biology 16: 259. https://doi.org/10.1186/s12862-016-0831-9
de Barros L.R.F, de Oliveira Wadt L.H., Mondin M., Pappas Junior. G., Rocha R.T., de Castro Rodrigues Pappas M., Kimura R.K., Martins K. (2019) Draft genome assembly of the tropical tree
Bertholletia excelsa using long-read sequence data. In: XXV
IUFRO World Congress, 29 sept - 5 October 2019, Curitiba, PR, Brazil, Abstracts: 318. Pesquisa Florestal Brasileira, Co-lombo, vol. 39, e201902043, Special issue.
Degnan J.H., Rosenberg N.A. (2009) Gene tree discordance, phy-logenetic inference and the multispecies coalescent. Trends in
Ecology & Evolution 24(6): 332–340. https://doi.org/10.1016/j. tree.2009.01.009
Doležel J., Greilhuber J., Lucretti S., Meister A., Lysák M.A., Nar-di L., Obermayer R. (1998) Plant genome size estimation by flow cytometry: interlaboratory comparison. Annals of Botany 82(Suppl. A): 17–26. https://doi.org/10.1093/oxfordjournals. aob.a010312
De Queiroz K. (2007). Species concepts and species delimi-tation. Systematic Biology 56(6): 879–886. https://doi. org/10.1080/10635150701701083
Doyle J., Doyle J.L. (1987) Genomic plant DNA preparation from fresh tissue-CTAB method. Phytochemical Bulletin 19(1): 11– 15.
Duminil J., Di Michele M. (2009) Plant species delimita-tion: a comparison of morphological and molecular mark-ers. Plant Biosystems 143(3): 528–542. https://doi. org/10.1080/11263500902722964
Duminil J., Caron H., Scotti I., Cazal S.-O., Petit R. J. (2006) Blind population genetics survey of tropical rainforest trees.
Molecu-lar Ecology 15(12): 3505–3513. https://doi.org/10.1111/j.1365-294X.2006.03040.x
Duminil J., Heuertz M., Doucet J.-L., Bourland N., Cruaud C., Ga-vory F., Doumenge C., Navascués M., Hardy O.J. (2010) CpD-NA-based species identification and phylogeography: applica-tion to African tropical tree species. Molecular Ecology 19(24): 5469–5483. https://doi.org/10.1111/j.1365-294X.2010.04917.x
Duminil J., Kenfack D., Viscosi V., Grumiau L., Hardy O.J. (2012) Testing species delimitation in sympatric species complexes: the case of an African tropical tree, Carapa spp. (Meliaceae)
Molecular Phylogenetics and Evolution 62(1): 275–285. htt-ps://doi.org/10.1016/j.ympev.2011.09.020
Earl D.A., vonHoldt B.M. (2012) STRUCTURE HARVESTER: a website and program for visualizing STRUCTURE output and implementing the Evanno method. Conservation Genetics
Re-sources 4: 359–361. https://doi.org/10.1007/s12686-011-9548-7
Eiserhardt W.L., Couvreur T.L.P., Baker W.J. (2017) Plant phy-logeny as a window on the evolution of hyperdiversity in the tropical rainforest biome. New Phytologist 214(4): 1408–1422.
https://doi.org/10.1111/nph.14516
Evanno G., Regnaut S., Goudet J. (2005) Detecting the number of clusters of individuals using the software STRUCTURE: a sim-ulation study. Molecular Ecology 14(8): 2611–2620. https://doi. org/10.1111/j.1365-294X.2005.02553.x
Falush D., Stephens M., Pritchard J.K. (2007) Inference of popula-tion structure using multilocus genotype data: dominant mark-ers and null alleles. Molecular Ecology Notes 7(4): 574–578.
https://doi.org/10.1111/j.1471-8286.2007.01758.x
Funk V., Hollowell T., Berry P., Kelloff C., Alexander S.N. (2007) Checklist of the Plants of the Guiana Shield (Venezuela: Ama-zonas, Bolivar, Delta Amacuro; Guyana, Surinam, French Gui-ana) Contributions from the United States National Herbarium, vol. 55. Washington, DC, National Museum of Natural History. Galbraith D.W., Harkins K.R., Maddox J.M., Ayres N.M., Sharma
D.P., Firoozabady E. (1983) Rapid flow cytometric analysis of the cell cycle in intact plant tissues. Science 220(4601): 1049– 1051. https://doi.org/10.1126/science.220.4601.1049
Gentry A.H. (1982) Neotropical floristic diversity: phytogeographi-cal connections between Central and South America, Pleisto-cene climatic fluctuations, or an accident of the Andean orog-eny? Annals of the Missouri Botanical Garden 69(3): 557–593.
https://doi.org/10.2307/2399084
Gonzalez M.A., Baraloto C., Engel J., Mori S.A., Pétronelli P., Rié-ra B., Chave, J. (2009) Identification of Amazonian trees with DNA barcodes. PloS One 4: e7483. https://doi.org/10.1371/ journal.pone.0007483
Goodwin Z.A., Harris D.J., Filer D., Wood J.R.I., Scotland R.W. (2015) Widespread mistaken identity in tropical plant col-lections. Current Biology 25(22): R1066–R1067. https://doi. org/10.1016/j.cub.2015.10.002
Grivet D., Climent J., Zabal-Aguirre M., Neale D.B., Vendramin G.G., González-Martínez S.C. (2013) Adaptive evolution of Mediterranean pines. Molecular Phylogenetics and Evolution 68(3): 555–566. https://doi.org/10.1016/j.ympev.2013.03.032
Guichoux E., Garnier-Géré P., Lagache L., Lang T., Boury C., Petit R.J. (2013) Outlier loci highlight the direction of introgres-sion in oaks. Molecular Ecology 22(2): 450–462. https://doi. org/10.1111/mec.12125
Hardy O.J. (2016) Population genetics of autopolyploids un-der a mixed mating model and the estimation of selfing rate.
Molecular Ecology Resources 16(1): 103–117. https://doi. org/10.1111/1755-0998.12431
Hardy O.J., Vekemans X. (2002) Spagedi: a versatile computer program to analyse spatial genetic structure at the individual