HAL Id: hal-00409089
https://hal.archives-ouvertes.fr/hal-00409089
Submitted on 9 Aug 2009
HAL is a multi-disciplinary open access
archive for the deposit and dissemination of
sci-entific research documents, whether they are
pub-lished or not. The documents may come from
teaching and research institutions in France or
abroad, or from public or private research centers.
L’archive ouverte pluridisciplinaire HAL, est
destinée au dépôt et à la diffusion de documents
scientifiques de niveau recherche, publiés ou non,
émanant des établissements d’enseignement et de
recherche français ou étrangers, des laboratoires
publics ou privés.
VLTI/MIDI observations of 7 classical Be stars
Anthony Meilland, Philippe Stee, Olivier Chesneau, Carol Jones
To cite this version:
Anthony Meilland, Philippe Stee, Olivier Chesneau, Carol Jones. VLTI/MIDI observations of 7
clas-sical Be stars. Astronomy and Astrophysics - A&A, EDP Sciences, 2009, pp.X. �hal-00409089�
Astronomy & Astrophysicsmanuscript no. 11960.hyper30998 c ESO 2009 August 9, 2009
VLTI/MIDI observations of 7 classical Be stars
⋆
A. Meilland
1, Ph. Stee
2, O. Chesneau
2, and C. Jones
31 Max Planck Institut fur Radioastronomie, Auf dem Hugel 69, 53121 Bonn, Germany
2 UMR 6525 CNRS FIZEAU UNS, OCA, CNRS, Campus Valrose, F-06108 Nice cedex 2, France.
3 Physics and Astronomy Department, The University of Western Ontario, London, Ontario, Canada, N6A 3K7.
Received; accepted
ABSTRACT
Context.Classical Be stars are hot non-supergiant stars surrounded by a gaseous circumstellar envelope that is responsible for the observed IR-excess and emission lines. The origin of this envelope, its geometry, and kinematics have been debated for some time. Aims.We measured the mid-infrared extension of the gaseous disk surrounding seven of the closest Be stars in order to constrain the geometry of their circumstellar environments and to try to infer physical parameters characterizing these disks.
Methods.Long baseline interferometry is the only technique that enables spatial resolution of the circumstellar environment of clas-sical Be stars. We used the VLTI/MIDI instrument with baselines up to 130 m to obtain an angular resolution of about 15 mas in the N band and compared our results with previous K band measurements obtained with the VLTI/AMBER instrument and/or the CHARA interferometer.
Results.We obtained one calibrated visibility measurement for each of the four stars, p Car, ζ Tau, κ CMa, and α Col, two for δ Cen and β CMi, and three for α Ara. Almost all targets remain unresolved even with the largest VLTI baseline of 130m, evidence that their circumstellar disk extension is less than 10 mas. The only exception is α Ara, which is clearly resolved and well-fitted by an elliptical envelope with a major axis a=5.8±0.8 mas and an axis ratio a/b=2.4±1 at 8 µm. This extension is similar to the size and flattening measured with the VLTI/AMBER instrument in the K band at 2 µm.
Conclusions. The size of the circumstellar envelopes for these classical Be stars does not seem to vary strongly on the observed wavelength between 8 and 12 µm. Moreover, the size and shape of α Ara’s disk is almost identical at 2, 8, and 12 µm. We expected that longer wavelengths probe cooler regions and correspondingly larger envelopes, but this is clearly not the case from these mea-surements. For α Ara this could come from to disk truncation by a small companion ; however, other explanations are needed for the other targets.
Key words. Techniques: high angular resolution – Techniques: interferometric – Stars: emission-line, Be – Stars: winds, outflows, disks – Stars: individual (p Car, ζ Tau, κ CMa, α Col, δ Cen, β CMi, α Ara) – Stars: circumstellar matter
1. Introduction
Classical Be stars are hot non-supergiant stars that are sur-rounded by a gaseous circumstellar environment responsible for the presence of an IR-excess and emission lines in their spectra. A generally accepted view of this material is a dense equatorial region dominated by rotation, often called a ”disk” where most of the IR-excess and emission lines originate, surrounded by a more diluted, radiatively driven, polar wind. Despite the fact that these systems have been studied for decades, the disk and wind formation, geometry, and kinematics, remain contentious issues. First VLTI observations of 4 Be stars, namely Achernar (Domiciano de Souza et al. 2003), α Ara (Meilland et al. 2007a), κCMa (Meilland et al. 2007b), and δ Cen (Meilland et al. 2008) have shown evidence of different geometries likely to due dif-ferent mass-ejection processes such as fast rotation, radiatively driven winds or binarity. Thus, it is not clear if Be stars can be considered as a homogeneous group of stars in terms of mass-ejection processes (Stee & Meilland 2009).
Measuring the N-band extension of the circumstellar envi-ronments of classical Be stars can put strong constraints on their physical parameters as shown by Chesneau et al. (2005) for α Ara. For this star, VLTI/MIDI observations with 100 m
base-Send offprint requests to: [email protected]
⋆ Based on observations made with ESO Telescopes at Paranal under programs 073.A-9014G, 077.D-0097 and 082.D-0189
lines led to nearly unresolved visibilities, demonstrating that the envelope was even smaller than what was previously predicted by Stee & Bittar (2001). These authors used long term spectro-scopic variability measurements and concluded that the disk is likely truncated by a companion.
We initiated an observational campaign on the brightest, closest, southern hemisphere classical Be stars using the VLTI instruments MIDI and AMBER. In this paper we present new spectrally resolved mid-infrared VLTI/MIDI interferomet-ric measurements for seven classical Be stars, p Car, ζ Tau, β CMi, κ CMa, α Col, δ Cen, and α Ara.
The paper is organized as follows. In Sect. 2 we present the observations and the data reduction process. In Sect. 3, the cali-brated visibilities are presented and then compared with a model composed of a unresolved star plus uniform disk. Our results and conclusions are discussed in Sect. 4, and Sect. 5, respectively.
2. Observations and data reduction
VLTI/MIDI observations for our program stars were carried out at Paranal Observatory between June 2004 and January 2009 with the 8.2 m UT telescopes. We obtained one vis-ibility measurement for p Car, ζ Tau, κ CMa, and α Col, two for δ Cen and β CMi, and three for α Ara. Observations of 12 calibrator stars were also obtained during this cam-paign: HD40808, HD49161, HD50778, HD94452, HD 95272,
2 Meilland et al.: VLTI/MIDI observations of 7 classical Be stars Star Obs. Date Time Baseline Calibrators
(UT) Bn L(m) P.A.(o) (HD) κCMa 2008/12/14 02:33 117.0 25.2 40808, 94452 δCen 2004/06/06 00:43 B2 91.2 42.5 107446 2008/12/13 08:27 B1 129.2 27.7 40808, 94452 αAra 2006/04/15 03:50 B1 126.8 1.7 95272, 129456, 151249 2006/04/16 07:49 B2 129.6 54.4 151249, 163376 2006/07/08 04:15 B3 120.7 74.1 169916, 198048, 217902 218594 p Car 2008/12/13 07:44 129.5 40.8 40808, 94452 ζTau 2009/01/11 03:36 127.3 67.9 49161, 50778 αCol 2008/12/13 05:17 128.5 64.0 40808, 94452 βCMi 2008/12/17 07:07 B1 129.5 63.8 49161, 50778 2009/01/11 04:44 B2 125.3 64.5 49161, 50778
Table 1. VLTI/MIDI observing log for our program stars and their corresponding calibrators.
HD107446, HD151249, HD163376, HD169916, HD198048, HD217902, and HD218594. The observation log is presented in Table 1.
The 2004 observations of δ Cen were obtained with UT1-UT3 in HIGH-SENS mode. All of the other observations were taken with the UT1-UT4 baseline using the SCI-PHOT mode to enable a better visibility calibration (Chesneau 2007). The PRISM low-spectral dispersion mode, allowed us to obtain spec-trally resolved visibilities with R=30 across the N band. We have used the standard MIA + EWS, (version 1.6) package to reduce the data and estimate the errors bars (see Fig. 1).
3. Results
3.1. The calibrated visibilities
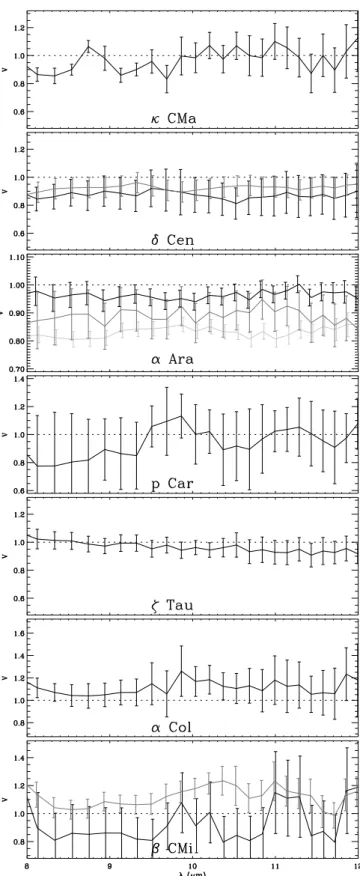
The N band calibrated visibilities for the program Be stars are plotted as a function of wavelength in Fig 1. The only clearly resolved (i.e., V+3σ <1) target is α Ara along the B1 baseline.
It is also barely resolved (i.e., V+σ <1) along the other two baselines. Moreover, δ Cen (for both baselines) and ζ Tau (for λ >10µm) are also barely resolved. All of the other targets, κ CMa, p Car, α Col, and β CMi, are clearly unresolved. Therefore, when we take into account the uncertainty in the measurements for these targets, we can only determine an upper limit of the N band envelope extension.
All targets have visibilities larger than 0.8. This corresponds, for a 130m baseline at 8µm to extensions smaller than 6 mas as-suming an uniform disk or 3 mas asas-suming a FWHM Gaussian. However, to estimate an accurate envelope extension, we need to include the contribution from the central star to the total flux (star+envelope) for each of systems studied.
Name Distance (pc) Spectral Class Φ⋆(mas)
κCMa 202 ± 5 B1.5IV 0.44 ± 0.15 δCen 127 ± 8 B2IV 0.65 ± 0.3 αAra 82 ± 6 B3V 0.88 ± 0.2 p Car 148 ± 9 B4V 0.27± 0.15 ζTau 136 ± 15 B4III 0.65 ± 0.2 αCol 80 ± 2 B7IV 0.58 ± 0.15 βCMi 50 ± 1 B8V 0.56 ± 0.1
Table 2. Distance, spectral class, and estimated stellar angular diameters (Φ⋆) for the seven observed Be stars.
Fig. 1. VLTI/MIDI visibilities of the 7 Be stars plotted as a func-tion of wavelength across the N band. For stars with multiple measurements (i.e., α Ara β CMi, and δ Cen) the correspond-ing baselines B1, B2, and B3are plotted in black, gray, and light
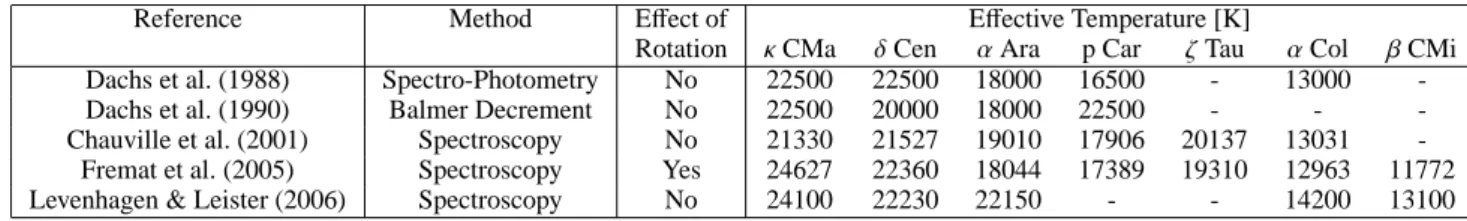
Reference Method Effect of Effective Temperature [K]
Rotation κCMa δCen αAra p Car ζTau αCol βCMi Dachs et al. (1988) Spectro-Photometry No 22500 22500 18000 16500 - 13000 -Dachs et al. (1990) Balmer Decrement No 22500 20000 18000 22500 - - -Chauville et al. (2001) Spectroscopy No 21330 21527 19010 17906 20137 13031
-Fremat et al. (2005) Spectroscopy Yes 24627 22360 18044 17389 19310 12963 11772 Levenhagen & Leister (2006) Spectroscopy No 24100 22230 22150 - - 14200 13100 Table 3. Published effective temperature for our target stars.
3.2. A simple two component model
If we assume, for all our targets, that the N band emission orig-inates from the central star and and the circumstellar envelope only, we can write :
Vtot= VeFe+ V⋆(1 − Fe), (1)
where Vtot, V⋆, and Ve, are the total, stellar, and envelope
visibilities, respectively, and Fe, is the ratio of the envelope flux
to the total object flux.
We can estimate the stellar angular diameter using the spectral class of each object and their distance derived from Hipparcos parallax measurements (Hipparcos, the New
Reduction van Leeuwen, 2007). As shown in Table 2, all
tar-gets have stellar diameters smaller than 1 mas. Thus, V⋆>0.99 at 8µm and we can assume V⋆=1 in the entire N band for these stars.
Using this assumption, we can rewrite Eq.(1) : Ve=
Vtot−1 + Fe
Fe
. (2)
Consequently, in order to calculate the envelope visibility Ve
we only need the relative envelope flux Fe.
3.3. Reconstructing the spectral energy distribution
We chose to constrain Fe by fitting the objects’ spectral
en-ergy distribution (SED) using stellar models. For each target, we reconstructed its SED using data available from the VIZIER1
database (see Fig 2): UV measurements are from Jamar et al. (1976) and Thompson et al. (1978), magnitudes are from Morel & Magnenat (1978), Monet et al. (2003), Zacharias et al. (2005), and 2MASS (Cutri et al., 2003), and IRAS measurements are used for the mid to far infrared. We note that Be stars are ob-served to exhibit photometric variations with timescales from a few months to several years with amplitudes up to 0.5 Mag (Harmanec, 1983) so that the SEDs can slightly vary with time. However, contemporaneous UV to mid-IR photometry are not available to compare with our VLTI/MIDI measurements so we use measurements from 0.2 to 100µm obtained at other times. The resulting reconstructed SEDs for our targets are plotted in Fig 2.
3.4. The stellar parameters and distance
In order to constrain the stellar contribution to the flux we need Teff, R⋆, and gefffor the central star. However, these stellar
pa-rameters for rapidly rotating Be stars are quite uncertain. There are several methods in the literature that are used to determine these stellar parameters. For example, Dachs et al. (1989) de-rived stellar parameters and extinctions of 46 Be stars from UBV
1 http://vizier.u-strasbg.fr/viz-bin/VizieR
Fig. 2. Reconstructed SEDs for the 7 Be star systems observed with the VLTI/MIDI instrument are shown with gray solid lines. Diamonds represent measurements taken from the VIZIER database. The portions of the SEDs up to 1µm (solid black lines) are fitted using reddened Kurucz models with the stellar parame-ters given in Table 4. Dashed lines represent the wavelengths for which the envelope flux is calculated, i.e., at 8µm, and 12µm.
4 Meilland et al.: VLTI/MIDI observations of 7 classical Be stars and JHKLMN photometric measurements. Later, Dachs et al.
(1990) determined the stellar parameters of 26 objects from an analysis of the Balmer decrement. Chauville et al. (2001) and Levenhagen & Leister (2006) use spectroscopic measurements of photospheric lines to calculate these parameters. Table 3 sum-marizes Teffderived by all of these authors for our target stars.
The discrepancy between Teff determined with these
meth-ods for classical Be stars can reach several thousand of Kelvin for some targets (see ζ Tau for example). These ranges mainly stems from the latitudinal-dependent surface temperatures in-duced by rapid rotation. This effect will depend on the incli-nation angle of the star. Also, the circumstellar gas can cause reddening and obscure the star affecting the values of the spec-trophotometrically determined parameters.
Fremat et al. (2005) accounted rapid rotation in their ana-lyzes and quoted “apparent” stellar Teff and geff, and then
com-pared these values to non-rotating counter-parts that are typically thought to be ∼ 5 to 15% hotter. We adopt these apparent or av-erage values for our work. The apparent Teffderived by Fremat
et al. (2005) for our sample stars are also presented in Table 3. Assigning a value for the stellar radius for a rapidly rotating star can also be difficult since the polar radius and equatorial radius can be quite different. For our targets, typical values for the stellar radius are deduced from the objects’ spectral class and then adjusted to obtain the best SED fit in the UV and visible. The fit of the stellar flux is accomplished using Kurucz models (Kurucz, 1979). We note that the use of plan parallel atmospheric models with a global Teff for fast rotating star may not apply.
However, the effect on the mid-infrared flux should be negligible for these wavelengths since the stellar radiation is dominated by black-body emission. The Kurucz models are reddened using the law of extinction from Cardelli et al.(1989) combined with the standard interstellar Rv value of 3.1. Thus, with Teff and log g
taken from Fremat et al. (2005), and the distance derived from Hipparcos parallaxes measurements, only the values for R⋆and Avare determined from the fit of the SED.
3.5. Estimating the errors on the envelope relative flux To estimate the errors in the relative envelope flux Fe at 8µm
and 12µm, we have to take into account the uncertainty in Te f f
adopted from Table 3, the possible interstellar and/or circumstel-lar reddening of the UV and visible stelcircumstel-lar radiation, and the fact that a part of the visible emission can originate from the circum-stellar envelope (up to ∼ 0.5 Mag).
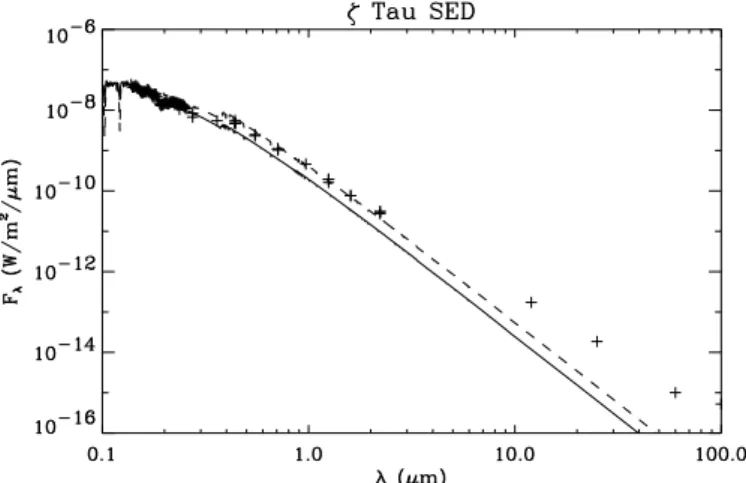
ζTau, is probably the most challenging target to model since its MK type is not well constrained: the published luminosity class ranges from II to IV and its spectral type from B2 to B4. Moreover, at 0.2µm an absorption bump is clearly evident in its UV spectra. This is a indicates the presence of interstellar and/or circumstellar extinction of the stellar emission. In Fig 3 we plot the SED of ζ Tau with two “extreme” models, a reddened B2V for which up to 40% of the visible flux comes from the envelope, and a B4III unreddened star fully dominated in the visible by the stellar emission.
We obtain errors for Feon the order of 0.06 at 8µm and 0.04
at 12µm. This simple analysis shows that the calculated N band relative envelope flux is not strongly dependent on the spectral class and associated stellar parameters, but that the main uncer-tainty comes from the envelope contribution in the visible.
We applied this method to all our seven targets to determine the envelope relative flux Feand its uncertainty. The parameters
adopted and the results of this SED model fitting are presented in Table 4. The stellar SEDs are also over-plotted in Fig 2.
Fig. 3. A comparison of the reconstructed SED for ζ Tau (crosses) with two “extreme” models: a reddened B2V (solid line, Teff=22000K, R⋆=5R⊙, AV=0.2, RV=3.1) for which up to
40% of the visible flux comes from the envelope, and a B4III unreddened star dominated by the stellar emission in the visible (dotted line, Teff=16000K, and R⋆=8.5R⊙).
3.6. N band envelope extension
We determine the N band envelope visibility, Ve, using Eq. (2)
and values of Fefrom Table 4. To determine the mean visibility
value, Vtot, at 8µm and 12µm, we use a linear interpolation of
the measured visibility in the same wavelength range, assuming that the measurements at each wavelength are independent. This method allows us to slightly decrease the errors on the inter-polated visibility. Finally, we determine the envelope extension using an equivalent uniform disk diameter. The results, assum-ing these simple models, are given in Table ??. For convenience, the K band measurements from VLTI/AMBER (Meilland et al. 2007a, 2007b, 2008) or CHARA (Gies et al. 2007) are also quoted if available.
As mentioned previously, the envelope is resolved only for αAra, δ Cen, and ζ Tau (only at 12µm). For κ CMa, p Car, ζ Tau (at 8µm), α Col, and β CMi, we determine a upper limit to the envelope extension only. Please see the next section for more discussion about α Area’s N and K band geometry, and on the compactness and wavelength dependence of the envelope size.
4. Discussion
4.1. The K and N band geometry ofαAra
First VLTI/MIDI data for α Ara were obtained by Chesneau et al. (2005). Unfortunately, the baselines used were too short and
Adopted stellar parameters Fe(%)
Name Teff(K) log g R⋆(R⊙) d (pc) Av 8µm 12µm
κCMa 24600 4.07 5.9 202 0.37 90±6 94±4 δCen 22360 3.92 6.5 127 0.10 88±5 93±3 αAra 18044 3.99 4.5 81 0.10 87±4 91±3 p Car 17389 3.52 6.0 148 0.05 87±4 91±3 ζTau 19340 3.52 7.5 136 0.30 80±6 86±5 αCol 12963 3.73 5.8 80 0.00 67±11 76±8 βCMi 11772 3.51 3.5 49 0.00 59±13 69±10 Table 4. Stellar parameters adopted in this work and resulting 8 and 12µm envelope flux.
κCMa δCen αAra p Car ζTau αCol βCMi
B1 B2 B1 B2 B3 B1 B2
φ(mas) at 8 µm <5.2 4.9 ±1.8 4.0 ±1.8 2.7 ±1.1 3.9 ±1.4 5.5 ±0.3 <6.0 <2.6 <2.3 <6.8 <1.1
φ(mas) at 12µm <8.4 5.3 ±4.3 6.9 ±2.7 3.6 ±1.8 6.0 ±2.3 8.1 ±0.6 <9.5 5.7±2.2 <3.6 <10.5 <1.8
φ(mas) at 2.1µm <3.62 1.6±0.43 7.3±21 - 1.79±0.074 -
-Table 5. Envelope size from our VLTI/MIDI data and literature : Meilland et al. (2007a1, 2007b2, 20083) and Gies et al. (20084)
the data quality was not good enough to accurately constrain its geometry. The authors were only able to put an upper limit on the envelope extension, i.e. less than 10 mas at 8µm. However, this was already smaller than what Stee & Bittar (2001) predicted for this Be star. Thus, these authors proposed a possible disk truncation and found spectroscopic evidence for the presence of a companion orbiting outside the estimated outer-radius of the equatorial disk, confining the disk within the Roche lobe of the star.
Using VLTI/AMBER data, Meilland et al. (2007a) investi-gated α Ara K-band geometry and kinematics. They clearly re-solved the equatorial disk and measured its flattening and ori-entation. The disk orientation was in agreement with the value deduced from polarimetric measurements by Yudin & Evans (1998) (P.A. =166o). Meilland et al. (2007a) also found that a
few percent of the K band flux originates from an extended struc-ture in the polar direction. Using the SIMECA code developed by Stee et al. (1996), they were able to model this object assum-ing a quasi-critical rotator surrounded by both a dense Keplerian rotating disk and an enhanced polar wind with terminal expan-sion velocities up to 1000 kms−1. Note that this is the first time
that the nature of the disk rotation, found to be Keplerian, was directly measured for a Be star.
Due to the SCI-PHOT mode and the use of longer baselines (i.e. UT1-UT4), the quality of our new VLTI/MIDI data was good enough to accurately constrain the envelope geometry in the N band. We were able to successfully model our measure-ments using a uniform ellipse, and found the same value for the major-axis as determined in the K-band from the VLTI/AMBER data by Meilland et al. (2007a). The envelope extension (a) and flattening (the ratio of a/b) are given in Table 6.
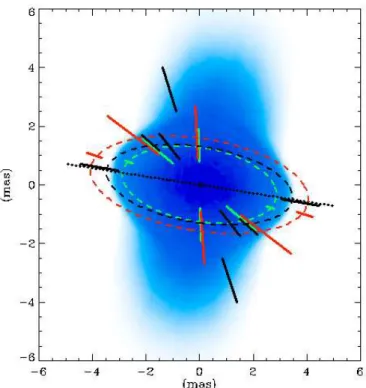
Both the VLTI AMBER and VLTI/MIDI measurements pro-duced similar disk sizes over the wavelengths, 2.1µm, 8µm, and 12 µm. The envelope extension is plotted as a function of the baseline orientations in Fig 4. A SIMECA image in the K band from Meilland et al. (2007a) is also plotted in this figure to allow a direct comparison with the K and N band measurements.
One of the most striking results from our modeling is the fact that the equatorial disk extensions remain relatively constant between 2.1µm and 12µm. We originally expected that longer wavelengths would probe cooler regions and thus larger disk volumes, which is clearly not the case. However, small varia-tions on the order of ∼ 2σ are detected between 8µm and 12µm along the direction of the major-axis. This wavelength indepen-dent disk size may be evidence for disk truncation by a compan-ion, in agreement with the suggestion of Meilland et al. (2007a). However, a free-free and free-bound radiation dominated enve-lope with a non-truncated isothermal equatorial disk may also
λ(µm) major-axis (mas) flattening
2.1 7.3±2 2.7±0.9
8 5.8±0.8 2.4±1.0
12 8.2±1.2 2.6±1.2
Table 6. α Ara equatorial disk major-axis and flattening.
give the same result depending on thermal structure of the disk. For example, studies that have determined self-consistent disk temperature distributions based on the assumption of radiative equilibrium, find that, on average, the temperature distribution is nearly constant up to ∼ 100 R∗ and is approximatively half the Teff of the central star. However, depending on the
equato-rial density near the stellar surface, large variations in tempera-ture can occur especially in dense disks. For example, see Millar & Marlborough (1998) for thermal structure of pure hydrogen disks, Jones et al. (2004) for the effects of iron line cooling on temperatures, or Sigut & Jones (2007) for models that include a realistic solar type chemical composition. Thus, it may be dif-ficult to propose a general scheme for each of our program Be stars since the disk density may vary significantly from star to star.
Another interesting result can be seen from Fig 4. An appar-ent lack of an extended polar contribution in the N band data compared to the K band measurement is apparent. There are two possible explanations:
Fig. 4. α Ara envelope at 8µm (green bars) and 12µm (red bars) assuming a uniform disk + an unresolved star model plotted as a function of baseline orientation. VLTI/AMBER measurements (black bars) are from Meilland et al. (2007a) and the correspond-ing best SIMECA model in the continuum ( shaded background ) are also shown. The black, green, and red ellipses correspond to the uniform ellipse fit of the equatorial disk presented in Table 6 at 2.1, 8, and 12µm, respectively. The orientation of the major axis (dotted black line) is perpendicular to polarization angle measurement obtained by Yudin & Evans (1998).
6 Meilland et al.: VLTI/MIDI observations of 7 classical Be stars
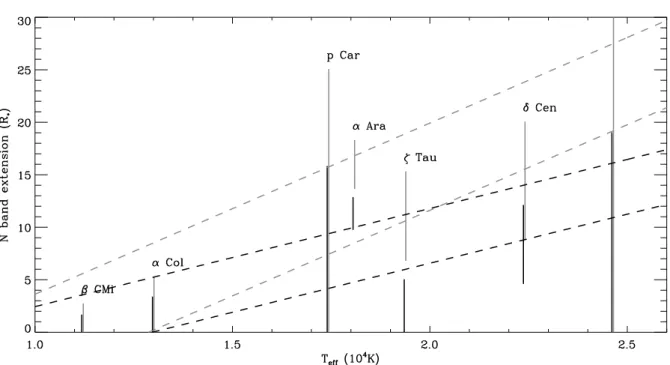
Fig. 5. 8µm (black) and 12µm (gray) envelope extension as a function of Tefffor the program Be stars. The dotted lines represent
linear interpolations, accounting for the uncertainty of the measurements, of the temperature dependence on the N band size.
1. The VLTI/MIDI angular resolution is 4-6 times smaller than the VLTI/AMBER. The polar wind extends out to ∼ 6 mas and is almost fully resolved by VLTI/AMBER with 80m baselines, whereas, the VLTI/MIDI visibilities with 120m baselines are ∼ 0.8. Thus, the overall effect on the total visibility for the VLTI/MIDI instrument is reduced by a factor of ∼5.
2. If the poles are hotter than the equatorial regions because of the effects of gravity darkening, the relative contribution to the total flux of the polar wind can significantly decrease between 2.1 and 8µm. In order to estimate this effect, a full modeling of the star+disk+wind would be required which is well beyond the scope of this paper.
4.2. The geometry of the remaining program Be stars As mentioned above, the envelopes of all observed targets are much smaller than predicted by Stee & Bittar (2001). In fact, none of our disks are larger than 10 mas. Using the angular di-ameters from Table 3 and pardi-ameters from Table 2, each disk is plotted (in R⋆) in the N band as a function of the central stars’ Teff in Fig 5. This figure seems to indicate that the envelopes of
late type Be stars (α Col and β CMi) are smaller than those of earlier types. However, this claim should be taken with caution considering the uncertainty of the measurements.
Moreover, with the exception of α Ara, one has to keep in mind that these stars are measured with baselines not necessarily aligned with their major-axis. Comparing polarization measure-ments of Yudin & Evans (1998) (see Table 7) and the baselines orientations from Table 1, it follows that the baseline orientations of α Col, β CMi, ζ Tau, and p Car correspond to an intermedi-ate angle between their putative major and minor axis whereas δCen and κ CMa are certainly observed along their major axis.
Three stars in our sample were also observed with VLTI/AMBER : α Ara, κ CMa, δ Cen and their
correspond-ing extensions in the K band continuum are 7.3±2, <3.6, and 1.6±0.4 mas, respectively. ζ Tau was observed with the CHARA interferometer in the K′ band (Gies et al. 2007) and mod-eled with an elliptical Gaussian with a FWHM extension of 1.79±0.07 mas.
For κ CMa, the N band measurements are not accurate enough to determine if its envelope size varies with wavelength. On the other hand, δ Cen and ζ Tau seem to show some size variations between the K and N bands. For ζ Tau, Carciofi et al. (2009) have shown in a recent paper that a density wave seems to be orbiting within the disk. Thus, the apparent extension of the disk may be different at different times.As previously discussed, this is contrary to the findings for α Ara as we showed that its cir-cumstellar disk extension is relatively constant over the infrared wavelengths considered.
Overall, for the Be star systems considered here, the varia-tions in disk size between the K and N bands seem relatively small. This is quite different from observations in these bands for the dusty disks of supergiant B[e] stars. For example, Domiciano de Souza et al. (2007) find that the interferometric observations of the circumstellar environment for the B[e] star, CPD-57o2874
in the K and N band are well fitted by an elliptical Gaussian model with FWHM diameters that varies linearly with wave-length. However, the N-band emission mechanisms are different for these two classes of stars, i.e. free-free emission for classi-cal Be stars and opticlassi-cally thick thermal dust emission for B[e] stars. Nevertheless, comparing K and N band emissions of cir-cumstellar envelopes of hot stars may provide clues, allowing the physics of these systems to be deciphered.
5. Conclusion
This first mid-infrared interferometric statistical study of classi-cal Be stars shows evidence for the compactness of their circum-stellar environment in the N band, smaller than 10 mas for the
κCMa δCen αAra p Car ζTau αCol βCMi
Polarization(%) 0.3 0.33 0.58 1.16 1.13 0.15 0.14
Polarization angle (o) 106 137 166 68 34 109 90
Baseline orientation (o) B
1 B2 B1 B2 B3 B1 B2
compared to the disk major-axis 9 4.5 19.3 59 21.6 1.9 62.8 56.1 45 63.8 64.5
Table 7. Yudin & Evans (1998) polarization measurements and baselines orientation with respect to the disk putative major-axis.
all Be stars in our sample. Interestingly, Gies et al. (2007) find that Be stars in binary systems generally have smaller disks.
Further, Be star disk extensions do not seem to depend strongly on the observed wavelength between 8 µm and 12 µm. For α Ara, an even stronger case can be made since the disk ex-hibits the same extension and flattening in the K and N bands. A possible result, that needs further investigation, is whether or not the disk size in various bands correlates with the Teffof the
central star. Our investigation seems to suggest that there may be such a correlation, but this must be taken with caution consider-ing the large uncertainties in the data and the fact that, in most cases, the baselines were not aligned with the disks’ major axis. This study can only be marginally extended to a larger number of targets because of VLTI/MIDI limited sensibility and accuracy. Fortunately, the number of targets available and the precision will significantly increase with MATISSE (Lopez et al. 2008), the second generation VTLI mid-infrared beam-combiner.
Acknowledgements. The Programme National de Physique Stellaire (PNPS) and
the Institut National en Sciences de l’Univers (INSU) are acknowledged for their financial support. A. Meilland acknowledges financial support from the Max Planck Institut fur Radioastronomy, and thanks Thomas Driebe for his help in re-ducing MIDI data. CEJ wishes to acknowledge financial support from NSERC, Natural Sciences and Engineering Research Council of Canada. The authors would like to thank the referee, Thomas Rivinius, for his careful reading and sug-gestions that greatly improved the paper. This research has made use of SIMBAD and VIZIER databases, operated at CDS, Strasbourg, France.
References
Carciofi, A.C., Okazaki, A.T., le Bouquin, J.-B. et al., A&A, in press, arXiv:0901.1098v1
Cardelli J.A., Clayton G.C., & Mathis J.S. 1989, ApJ, 345, 245 Chauville J., Zorec J., Ballereau D., et al. 2001, A&A 378, 861 Chesneau, O., Meilland, A., Rivinius, T et al. 2005, A&A, 435, 275 Chesneau, O. 2007, New Astron. Rev., 51, 666
Cutri R.M., Skrutskie M.F., Carpenter J.M., et al. 2003 2MASS all Sky Catalog of point sources.
Dachs J., Engels D., & Kiehling R., 1988, A&A, 194, 167 Dachs J., Rohe D., & Loose A.S. 1990, A&A, 238, 227
Domiciano de Souza, A., Kervella, P., Jankov, S., et al. 2003, A&A, 407, L47 Domiciano de Souza, A., Driebe, T., Chenseau, O., et al. 2007, A&A, 464,81 Fr´emat Y., Zorec J., Hubert A.-M., & Floquet M. 2005, A&A, 440, 305 Gies ,D.R., Bagnuolo, W.G., Baines, E.K., et al., 2007, ApJ, 654, 527 Glindemann, A., Albertsen, M., Andolfato, L., et al. 2004, SPIE, 5491, 447 Jones, C.E., Sigut, T.A.A. & Marlborough, J.M. 2004, MNRAS, 352, 841 Harmanec P., 1983, HvaOB, 7 , 55
Jamar C., Macau-Hercot D., Monfils A., et al. 1976, Ulraviolet Bright-star spec-trophotometric catalogue
Kurucz, R.L., 1979, ApJ, 40, 1
Levenhagen R.S. & Leister N.V., MNRAS, 2006, 371, 252 Lopez B., Antonelli, P., Wolf, S. et al. 2008, SPIE, Volume 7013 Meilland, A., Stee, Ph., Vannier, M. et al. 2007a, A&A, 464, 59 Meilland, A., Millour F., Stee, Ph. et al. 2007b, A&A, 464, 73 Meilland, A., Millour F., Stee, Ph. et al. 2008, A&A, 488, L67 Millar, C. E., & Marlborough, J. M. 1998, ApJ, 494, 715 Monet D.G., Levine S.E., Canzian B., et al. 2003, AJ, 125, 948 Morel, M. & Magnenat, P, 1978, A&AS, 34, 477
Sigut, T.A.A. & Jones, C.E., 2007, ApJ, 668, 481 Stee, Ph., 1996, A&A, 311, 945
Stee, Ph. & Bittar J., 2001, A&A, 367, 532
Stee, Ph. & Meilland A., 2009, Lectures notes in Physics, 765, 195 Thompson, G.I., Nandy, K. et al., 1978, Catalogue of stellar ultraviolet fluxes
van Leeuwen, 2007, Hipparcos the New Reduction Yudin, R. & Evans, A., 1998, A&A, 131, 401