HAL Id: hal-02923817
https://hal.archives-ouvertes.fr/hal-02923817
Submitted on 28 Oct 2020
HAL is a multi-disciplinary open access
archive for the deposit and dissemination of
sci-entific research documents, whether they are
pub-lished or not. The documents may come from
teaching and research institutions in France or
abroad, or from public or private research centers.
L’archive ouverte pluridisciplinaire HAL, est
destinée au dépôt et à la diffusion de documents
scientifiques de niveau recherche, publiés ou non,
émanant des établissements d’enseignement et de
recherche français ou étrangers, des laboratoires
publics ou privés.
Deuterium excess in Greenland snow: Analysis with
simple and complex models
Alexandre Armengaud, Randal Koster, Jean Jouzel, Philippe Ciais
To cite this version:
Alexandre Armengaud, Randal Koster, Jean Jouzel, Philippe Ciais. Deuterium excess in Greenland
snow: Analysis with simple and complex models. Journal of Geophysical Research: Atmospheres,
American Geophysical Union, 1998, 103 (D8), pp.8947-8953. �10.1029/98JD00274�. �hal-02923817�
Deuterium
excess in Greenland
snow:
Analysis with simple and complex models
Alexandre Armengaud
Laboratoire de Glaciologie et G•ophysique de l'Environnement, CNRS/Universite Grenoble 1, St Martin
d'H•res, France
Randal D. Koster
Hydrological Sciences Branch, Laboratory for Hydrospheric Processes, NASA Goddard Space Flight Center,
Greenbelt, Maryland
Jean Jouzel and Philippe Ciais
Laboratoire des Sciences du Climat et de l'Environnement, Direction des Sciences de la Mati•re, Commissariat h
l'Energie Atomique, Saclay, France.
Abstract. A simple Rayleigh-type isotope model, typical of those used to develop algorithms for extracting climatic information from stable water isotope paleodata, is evaluated against the more complex and presumably more reliable calculations of a
general circulation
model (GCM) fitted with isotope tracer diagnostics.
The evaluation
centers on an analysis of how the temperature T e of an oceanic moisture source affects the deuterium excess d of Greenland precipitation. The annual Te-d relationship derived from the GCM diagnostics is largely reproduced by the simple isotope model when the latter is properly initialized. This, coupled with the fact that the GCM itself reproduces observed isotope behavior, suggests that the simpler model's atmospheric calculations are indeed adequate for isotope studies. Furthermore, the GCM results support the idea, originally developed with the simpler models, that polar deuterium excess values contain information on meteorological conditions at distant evaporative sources.
1. Introduction
The stable isotopes of water, HDO and H}sO, have been
measured in ice cores and other paleowaters in varying con- centrations. Through a detailed analysis of current isotope concentration fields, isotope/climate relationships have been derived which allow the extraction of paleoclimatic tempera- tures from paleowater measurements (see Jouzel et al. [1997] for a recent review). A related isotopic quantity, deuterium excess, is now being used to infer additional paleoclimatic information. Deuterium excess d was defined by Daansgaard
[1964] as d = •D - 8•sO, where • indicates a permil devi-
ation from the corresponding isotope ratio in standard mean ocean water (SMOW). The factor 8 comes from the meteoric water line, which defines the locus of modern precipitation in
a 5D/5•80 plot [Craig,
1961].
Using a simple evaporation model and a Rayleigh-type pre-
cipitation model, Merlivat and Jouzel [1979] inferred that the
deuterium excess of precipitation primarily depends on the mean relative humidity above the evaporative (oceanic) source for the moisture. Jouzel et al. [1982] then interpreted the re- duced glacial d values (relative to modern values) in an East Antarctic core as a reflection of higher relative humidity over
the oceanic
areas
providing
moisture
for Antarctic
precipita-
tion. Johnsen et al. [1989] pointed out that d is also significantly affected by the temperature of the moisture source and exam- ined d variations with respect to absolute (rather than relative)
Copyright 1998 by the American Geophysical Union. Paper number 98JD00274.
0148-0227/98/98JD-00274509.00
humidity, leading Daansgaard et al. [1989] to interpret the abrupt d change at the termination of the Younger-Dryas in Greenland's Dye 3 core in terms of a rapid retreat of sea-ice cover. The dual importance of humidity and temperature at the evaporative source has also been recognized for Antarctica [Petit et al., 1991; Ciais and Jouzel, 1994; Ciais et al., 1995; Fisher, 1991].
The Rayleigh or Rayleigh-type distillation models (herein- after often referred to as "simple isotope models") usually applied in these studies essentially model isotope behavior within isolated air masses transported poleward from an ocean source. The idealized paths traversed by these air masses are determined by prescribed initial and final states for tempera- ture and pressure. The simple isotope models account for the interplay between cloud microphysics and the fractionation processes occurring at each phase change of the water. They cannot, however, account for the complexity of dynamical pro- cesses that lead to the formation of precipitation. Further- more, Jouzel and Koster [1996] recently showed that the stan- dard approach used in these models for specifying the initial isotope contents within the air parcels introduces a systematic bias that can significantly affect the simulated relationships between deuterium excess and evaporative source conditions.
An alternative approach to studying global water isotope behavior is to incorporate the isotopic cycles into an atmo- spheric general circulation model (GCM), which does simulate the dynamical complexity of the atmosphere and which avoids the noted initial conditions bias in the simple Rayleigh-type models. Isotope tracer diagnostics have been incorporated into at least four different GCMs [Joussaume et al., 1984; Jouzel et
8948 ARMENGAUD ET AL: DEUTERIUM EXCESS IN GREENLAND SNOW
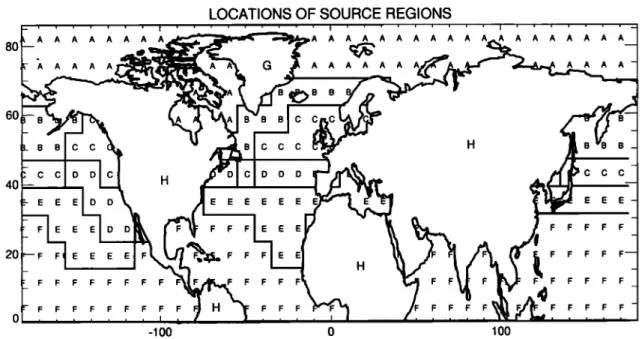
LOCATIONS OF SOURCE REGIONS A A Figure 1. A A A A A A ,A A A A A A A A A A A A A A A A A A A A A A A A A A A A A A A A A ql•B B D D D C C C E E E E E E E E E E E F F F F F F F F
E
E
E F•I•,•.
F
F
F
F
• F
F
F
F
F F F F F F F F F F F F F F F F F F F F F F F F F F F F F F F F F F -100 0 100Locations of the tracer source regions. The tracer water for an oceanic source region (regions A-F) is not allowed to evaporate from the continental or sea-ice portion of any grid cell.
al., 1987; Hoffmann and Heimann, 1993; R. Matthieu, personal communication, 1997], and simulations of isotope behavior have been performed by each modeling group for both present-day and glacial conditions [Joussaume and Jouzel, 1993; Jouzel et al., 1994; Hoffmann and Heimann, 1995; Andersen, 1997]. The isotope GCMs can also "tag" moisture
evaporating from selected source regions and then trace it through the GCM's atmosphere until it precipitates. Jous- saume et al. [1986], Koster et al. [1986], and Druyan and Koster [1989] used this tagging approach to study the contributions of various evaporative sources to continental precipitation, and Koster et al. [1992] and Charles et al. [1994, 1995] used it to examine how the sources of polar precipitation affect its iso-
tope content.
In the present study, we use the 8 ø x 10 ø Goddard Institute for Space Studies (GISS) isotope GCM [Jouzel et al., 1987] to determine how sea surface temperature (SST) conditions at an
evaporative source affect the deuterium excess of Greenland
precipitation. We then repeat the study using a simple Ray- leigh-type distillation model to establish the extent to which the simpler model can reproduce the results from the more complex GCM. This particular evaluation is important given the numerous recent applications of simple models to the d/SST problem [Johnsen et al., 1989; Dansgaard et al., 1989;
Barlow et al., 1993; White et al., 1995, 1997; Fisher, 1990, 1991,
1992]. Clarifying the relationships between deuterium excess over Greenland and evaporative source conditions also paves the way toward improved utilization of the extensive &D and
&•80 data, covering
at least 100 ka, now available
from the
Greenland Ice Core Project (GRIP) and Greenland Ice Sheet Project 2 (GISP2) ice cores [e.g., Dansgaard et al., 1993].
2. Experimental Design
The GISS isotope GCM is chosen for this study because it is quite effective in reproducing the observed patterns of •D and
&•sO
across
the globe [Jouzel
et al., 1987].
In central
Green-
land, the focus of this study, the GCM generates annual •D,
•80, and d values
of -237%o, -31%o, and 12%•, respec-
tively, which are reasonably similar to the observed values of about -270%•, -35%•, and 9%•, respectively, at the GRIP and GISP2 sites [Johnsen et al., 1992; Grootes et al., 1993; White et al., 1997]. (An exact match with the point observations is not, in any case, expected or necessarily desired given the spatial scale represented by the GCM's grid cells.) The GISS isotope
GCM, however, when run at an 8 ø x 10 ø resolution, does fail
to reproduce the observed seasonal cycles of isotope concen- tration over Greenland [Jouzel et al., 1987]. This deficiency should be kept in mind when interpreting the results presented
below.
Although both temperature and humidity at an evaporative
source have an influence on the deuterium excess of Green-
land snow, we use temperature alone to define oceanic evap- orative source regions in the present experiment. For each ocean grid cell in the northern hemisphere we determine the July 1 temperature T e from the SST climatology standardly used in the GISS GCM [Hansen et al., 1983]. The ocean grid cells are then collected into six source regions using the fol- lowing criteria: Source region Source region Source region Source region Source region Source region A re< 5 B 5<Te<10 C 10 < T e < 15 D 15 < T e <20 E 20< Te<25 F 25 % T e
Figure 1 presents the geographical locations of these regions and of two additional land regions, one representing Green- land (region G) and the other representing all other land surfaces (region H). Note that the locations of the ocean sources remain constant despite the fact that the SSTs vary seasonally in the experiment according to the prescribed cli- matology.
For each of the six oceanic source regions, we also define two additional tracers, one representing the HDO molecules
and the other representing the H}80 molecules that evaporate
from the source. This allows us to track the isotopic evolution of the source's water as it is transported to other regions through the atmosphere [Kester et al., 1992].
The design of this experiment is similar to that of Charles et al. [1994] in that it isolates the sources of Greenland precipi- tation in an attempt to explain isotopic variations there. The present experiment, however, is unique in that it separates the evaporative sources according to temperature rather than ge- ography and follows independent isotopic tracers from each source. In the present experiment, the isotope analyses focus on water traveling directly from the oceanic sources to the Greenland site. Although the water evaporating from the con-
tinental regions G and H must, at some earlier time, have been derived from oceanic sources, this continental water is not
considered in the isotope analyses.
The experimental design allows a direct comparison of
GCM results, including those for deuterium excess, with out-
put from simple isotopic models (see section 4). The tracer model is integrated for 27 months, with tracer precipitation rates continuously monitored to produce monthly totals. To account for model spin-up, data from the first three months are
neglected.
3. GCM Results
Our analysis focuses on the GCM grid cell in central Green- land (40øW, 74øN) which contains the site of the GRIP and GISP2 ice cores. Following the procedure outlined by Kester et al. [1986, 1992], we use the H20 tracer diagnostics in the GCM to separate the precipitation in central Greenland into relative contributions from each of the eight source regions in Figure 1. These simulated relative contributions are presented for each season and for the annual mean in Figure 2. All oceanic sources contribute to Greenland precipitation, though in vary- ing amounts. The contribution of the distant tropical ocean (regions E and F) is indeed quite significant, particularly in winter and spring. The extratropical source regions C and D contribute less, perhaps because of their smaller areas in the Atlantic. Simulated summer precipitation in central Greenland is dominated by contributions from northern hemisphere con-
tinents.
Of more relevance to the present study is the isotopic nature of the precipitated water from each source. Following Kester et al. [1992], the Greenland deuterium excess associated with a specific evaporative source (say, source region A) is defined in a unique way. Consider a precipitation volume in Greenland. A certain mole fraction of that volume, Xi-iA, consists of H20 molecules that most recently evaporated from region A. Sim- ilarly, XDA and XOA represent the corresponding mole frac-
tions of HDO and H2•80 derived from region A. Thus within
region A's contribution to the total precipitation water in the Greenland cell, the tracer isotope concentrations are
___ RSMOW,HDO
XI-i^
= (1)
15i•^
1000%o
Rs•xow,imo
Xo^g SMOW,H2 ]80
XI-i^
15o,4 = 1000%o , (2) RSMOW,H2180
where RsMow,i_ir)o
and RSMOW,H2•80
represent
the isotope
ratios within standard mean ocean water. This leads to a deu-
terium excess in the water originating from region A of
A B C D E F G H (0.98) (4.21) (8.49) (14.7) (19.7) (26.0)
MAM
-
A B C D E F G H (0.38) (3.99) (8.18) (14.4) (19.4) (26.3)JJA
-
'ø0
A B C D E F G H (2.32) (8.82) (13.6) (18.4) (23.3) (27.5)SON
A B C D E F G H (2.36) (8.74) (13.6) (18.7) (23.5) (27.4)ANN
A B C D E F G H (1.51) (6.45) (10.9) (16.6) (21.5) (26.8)Figure 2. Contributions (percent) of the source regions to precipitation in central Greenland. The average temperatures of the oceanic source regions (in degrees Celsius) are shown in parentheses.
d^ = &i•^- 8&o^. (3) Equations (1)-(3) allow us to determine the annually aver- aged deuterium excess in central Greenland associated with each of the source regions in Figure 1. The thick solid line in Figure 3 shows the variation of this deuterium excess with the average annual temperature of the source region. Curiously, d does not vary monotonically with source region temperature, showing instead a clear minimum at a source temperature of about 11øC. The mechanism behind the curve's shape (which is also seen in corresponding plots for the other Greenland squares) is not clear. Given, however, the definition of deute- rium excess as the difference between two similar isotope con-
centrations
(&D and 8&180),
each
of which
varies
nonlinearly
with a host of atmospheric and surface properties, the shape is
not unreasonable.
Any tracer water precipitating in Greenland clearly began its journey as water vapor overlying its evaporative source. The deuterium excess in this "initial" tracer water vapor can be calculated using equations analogous to (1)-(3). The dotted line in Figure 3 shows, for each source region, the deuterium excess for its corresponding tracer vapor averaged throughout the region's near-surface atmospheric grid boxes. Only a slight
8950 ARMENGAUD ET AL: DEUTERIUM EXCESS IN GREENLAND SNOW
10
-10
Tracer Deuterium Excess
A
[VAPOR
ABOVE
SOURCE
F
D ... o ...PRECIPITATION
-20 ....
0 5I .... 110
115
....
20•
25•
30 TEMPERATURE OF EVAPORATIVE SOURCE (C)Figure 3. GCM-simulated variation of deuterium excess with evaporative source temperature, for central Greenland precip- itation (thick solid line) and tracer water vapor overlying the evaporative source (dotted line).
are controlled by such factors as temperature, relative humid- ity, and local wind speed. Thus the effective initial conditions for the isotopes prior to their transport through the GCM's atmosphere are apparently not fully responsible for the "U shape" of the deuterium excess in the precipitation curve.
4. Test of the Simple Isotope Model
Again, a simple isotope model typically transports an air parcel from an oceanic source to a polar site via a highly idealized atmospheric path. The myriad and complex atmo- spheric transports present in the GCM (which itself is a highly idealized model of the real atmosphere) are ignored. We now test the simple isotope model of Ciais and Jouzel [1994] against a GCM by comparing how each transforms the isotope content of water vapor as it is transported into Greenland. More spe- cifically, we determine the extent to which the simple model can reproduce the precipitation curve in Figure 3.
Each oceanic source in Figure 1 is considered separately in independent integrations of the simple isotope model. The specified initial conditions for the model are the sea surface temperature below the air parcel, the relative humidity within the parcel, the surface pressure, and the "tracer" values of &D
and /5•sO within the parcel's water vapor, all of which are
obtained from the monthly diagnostics of the GCM simulation described above, taking areal averages over the oceanic source
being
considered.
The tracer
values
of &D and/5•sO
for source
region A, for example, are those computed with (1) and (2),
using
the mole fractions
of H20, HDO, and H•SO in water
vapor rather than in precipitation; these are, in fact, the tracer
&D and &•sO values that in the annual mean generated the
dotted curve in Figure 3. The prescribed final state for the air parcel consists solely of the pressure and temperature over central Greenland, again determined from monthly GCM di- agnostics. (The GCM-generated monthly mean temperature over central Greenland is used as the prescribed final temper- ature for the air parcel. Although it may have been more appropriate to use a precipitation-weighted temperature to account for the fact that in the real world, precipitation events in Greenland tend to be correlated with higher temperatures,
the information needed for this weighting was not available from the GCM diagnostics.) We do not, of course, prescribe the final states for the isotopic quantities, since these are prod- ucts of the simple model's calculations.
The critical temperatures describing the phase change of water in the simple model are, for the most part, consistent with the critical temperatures used in the GCM. Perfect con- sistency, however, is unattainable because the GCM treats convective and nonconvective processes separately and as- sumes a slightly different phase change behavior in each. Ice crystals begin to appear as the temperature falls below -5øC, and liquid and solid water coexist down to -40øC. The super- saturation S of vapor over ice is computed as S = 1. - 0.003T, where T is the temperature in degrees Celsius.
For a given oceanic source region, we run the simple isotope
model once for each month of the year and then average the
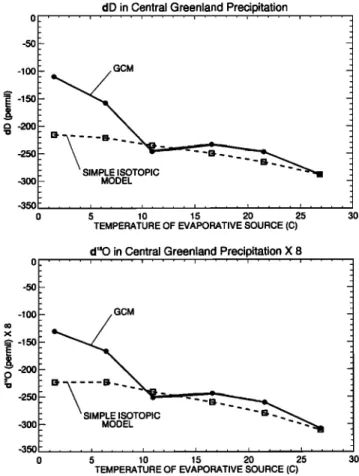
monthly results (weighted by the corresponding monthly pre- cipitation from the GCM) to produce annual means. The re- sulting annual deuterium excess values in central Greenland precipitation are compared to those produced by the GCM in Figure 4. The salient feature of the plot is the strong agree- ment between the simple model and the GCM results for temperatures above 10øC. For these temperatures this test indicates that the idealized air mass transport assumed by the simple isotope model is indeed a valid approximation to the more complex transports simulated by the GCM. Similar agreement is generally seen when data for individual months are compared (not shown); the agreement is indeed better for spring months, though significantly worse for winter months. For lower source temperatures the simple model underesti- mates deuterium excess. As might be expected, the simple
model
also
has
trouble
reproducing
the individual
&D and &•sO
values in central Greenland precipitation for these source tem- peratures, as indicated in Figure 5. We can only speculate on the reasons for this disagreement. A limitation of the GCM itself may be responsible: in the GCM, the coexistence of sea ice and open ocean in a grid cell leads to a severe temperature discontinuity between the open-ocean portion of the cell and the overlying air, which is assumed well mixed over the cell and thus strongly influenced by the very cold sea ice. This discon-
30 20
-20 0
d in Central Greenland Precipitation
.... I .... I .... I .... I .... } ....
"
SIMPLE ISOTOPIC'13'"""
_
MODEL
Figure 4. Variation of deuterium excess in central Green- land precipitation with evaporative source temperature, for the GCM (thick solid line) and the simple Rayleigh-type model (dashed line).
tinuity may compromise the gradual cooling of an ocean- derived vapor mass that occurs both in nature and in the simple Rayleigh-type model. This explanation is supported by the fact that the disagreement between the GCM and the simple model disappears for source region B during the warm season, i.e., during the period for which this region contains absolutely no sea ice. Given this potential GCM limitation, the testing of the simple isotope model against the GCM should perhaps focus only on the warmer source regions (C through F).
5. Closure Assumption
In standard practice, the HDO and H2180 concentrations in
a simple isotope model's air parcel are not initialized at the assumed vapor source with observed or GCM-generated data.
Limitations in data availability instead often necessitate the
use of the so-called "closure assumption" [Merlivat and Jouzel,
1979] to relate 15D and 15•80 in near-surface vapor to ambient
relative humidity, wind speed, and surface temperature. In essence, the closure assumption equates the mean isotopic content of evaporation to that of precipitation. While this may be valid for a global-scale calculation, it is certainly invalid at the local scale and even the regional scale. Jouzel and Koster [1996], using GCM-generated data, provide strong evidence that this deficiency at the regional scale does, in fact, seem to
translate into unreasonable initial values of near-surface
and 15•80. They speculate that the resulting poor initialization
dD in Central Greenland Precipitation
0 .... i .... i .... ! .... i .... i .... -50 -100 . GCM -250 -300 - MODEL c3 -200
d"O in Central Greenland Precipitation X 8
0 .... i .... [ .... i .... • .... i .... -50 -100 . GCM x .--2_ -150 - •' -200 - -250 - - -...• SIMPL -300 _- MODEL _ -350-.,,. • • • • ... 0 5 10 15 20 25 30 TEMPERATURE OF EVAPORATIVE SOURCE (C)
Figure 5. Variation
of (top) 15D
and (bottom)
15180
in central
Greenland precipitation with evaporative source temperature, for the GCM (thick solid line) and the simple Rayleigh-type model (dashed line).
d in Central Greenland Precipitation
CM
10
-
•
••EI -
. ,J:t' • SIMPLE ISOTOPIC • • MODEL UNDER -10 • • .- -- a' CLOSURE ASSUMPTION -20 .... • .... • .... , .... , .... , .... 0 5 10 15 20 25 30TEMPERATURE OF EVAPORATIVE SOURCE (C)
Figure 6. Variation of deuterium excess in central Green-
land precipitation with evaporative source temperature, for the GCM (thick solid line) and the simple Rayleigh-type model using the closure assumption (dashed line).
of a simple isotope model could result in unrealistic model integrations.
We now investigate this. We repeat the simple isotope model simulations that produced the dashed curves in Figures
4 and 5, but instead of initializing 15D and 15180 with GCM
data, we compute the initial values with the closure equation.
For example, for 15D we use
1 + 1000= a 1-kh 1+ 1000
/'
(4)
•D
where a is the equilibrium fractionation factor, k is the kinetic fractionation coefficient (a function of wind speed), h is rela- tive humidity, and 15D ... is the HDO concentration in surface water [Merlivat and Jouzel, 1979]. Results are shown in Figure 6. As predicted by Jouzel and Koster [1996], the use of the closure assumption clearly results in strongly underestimated d
values.
Jouzel and Koster [1996] argue that the validity of the closure assumption decreases as a region obtains a greater fraction of its overlying moisture from external sources. Their assertion is supported by the present experiment. Figure 7 (top) shows, for each oceanic source region in July, the fraction of the vapor in the lowest atmospheric layer above the region that is derived from the source region itself. Note, for example, that almost all of the vapor above source region F was evaporated locally, whereas the vapor above source region A is largely of external origin. Figure 7 (bottom) shows, for the locally derived vapor above each source region, the difference between the deute- rium excess calculated with the closure assumption and that simulated by the GCM. The error is clearly larger for those source regions with large external vapor contributions.
We must point out, however, that while the underestimation of d in vapor through application of the closure equation has been confirmed by other GCMs, the magnitude of this under- estimation appears model dependent [Delmotte, 1997; Andersen, 1997], with the GISS model, for reasons unknown, giving larger values. The few available measurements of deu- terium excess in oceanic vapor suggest that the closure equa- tion underestimates d in vapor only by 3 to 4%0, i.e., by only
8952 ARMENGAUD ET AL: DEUTERIUM EXCESS IN GREENLAND SNOW
1.0
Contributions of Source Regions to Overlying Vapor (July)
A B C D E F 0.8 n- 0.6 z o z 0.4 O (..3 0.2 0.0
d in Locally Evaporated Vapor: Closure Assumption Error (July)
0 A B C D E F _ -- _ -- _ _ . -5 .•- -10 ,• -•5 -20 -25
Figure 7. (top) Fractional contribution of locally evaporated water to the total vapor in the lowest atmospheric layer above each oceanic source region. (bottom) Error induced by the closure assumption in the calculation of the deuterium excess of locally evaporated water vapor.
half of what is predicted by the GISS GCM for the correspond- ing latitudes (S. Johnsen, personal communication, 1997).
6. Summary and Discussion
The Rayleigh-type distillation model, referred to here as a "simple isotope model," generally reproduces the GISS
GCM's predictions
of /3D, /3•80, and deuterium
excess
in
Greenland precipitation when initialized with temperatures, relative humidities, and isotope concentrations from the GCM. Disagreement occurs only for the lower source temperatures, possibly due to the formulation of sea ice in the GCM. The general agreement with the more complex (and presumably more accurate) GCM supports the use of such simple models to infer remote meteorological quantities from polar isotope concentrations and, in general, to help understand and explain the global processes behind observed isotope variability. At the very least, we can say from the experiment that our simple isotope model captures the relevant isotope distillation char-
acteristics of the GCM.
Figure 2 implies one word of caution. A significant fraction of Greenland precipitation might be derived from northern hemisphere continents, whereas simple models implicitly as-
sume a well-behaved ocean source. The continental contribu-
tion may compromise the interpretation of real-world deute-
rium excess measurements in terms of simple model results. A separate word of caution about the comparison between the GCM and the simple model results involves their potential sensitivity to the parameter values chosen to describe fraction- ation processes. The robustness of our conclusions can best be established through sensitivity studies with the models used (e.g., the analyses of supersaturation functions performed by Jouzel et al. [1991] and Ciais and Jouzel [1994]) and through
similar experiments conducted with independent models. The simple isotope model does not reproduce the GCM results in nonpolar regions (not shown). This is not surprising, since the simple model considers only nonconvective processes and thus cannot account for the complexities of isotopic ex- change during moist convection. In any case, the simple model is not designed to follow an air parcel from a cold ocean source to a warmer continental site. GCMs are preferred for such problems.
Various simple isotope models have already been used to infer relationships between polar deuterium excess and mete- orological conditions (temperature and humidity) at the evap- orative source [e.g., Johnsen et al., 1989]. The GCM confirms the strong influence of source temperature on deuterium ex- cess in Greenland, at least for source temperatures of 10 ø or more. An impact of relative humidity (not shown) is also seen in the GCM results, implying that absolute humidity at the evaporative source also affects d. (Note, however, that tem- perature and humidity over the GCM's oceans are correlated, so a proper separation of temperature and humidity effects is difficult.) Overall, this analysis provides strong support for the use of polar deuterium excess to extract information on remote conditions and for the use of simple models to determine the relevant relationships, provided that these models employ GCM-derived isotope concentrations rather than the closure assumption in their initialization.
Acknowledgments. Our colleagues at the Goddard Institute for
Space Studies (GISS), particularly Reto Ruedy, Gary Russell, Rick
Healy, and David Rind, provided significant scientific, computational, and logistical support for this project. The lead author, in fact, spent a
year at GISS, with financial support from GISS (and thus the NASA Climate Program). Financial support also came from the Programme
National d'Etudes de la Dynamique du Climat of France.
References
Andersen, U., Modeling the stable water isotopes in precipitation using the LMD5.3 atmospheric general circulation model, 100 pp., Ph.D. thesis, Niels Bohr Inst. of Astron., Phys. and Geophys., Copenhagen, 1997.
Barlow, L., J. W. C. White, R. G. Barry, J. C. Rogers, and P.M. Grootes, The North Atlantic oscillation signature in deuterium and deuterium excess signals in the Greenland Ice Sheet Project 2 ice core, Geophys. Res. Lett., 20, 2901-2904, 1993.
Charles, C., D. Rind, J. Jouzel, R. Koster, and R. Fairbanks, Glacial interglacial changes in moisture sources for Greenland: Influences
on the ice core record of climate, Science, 263, 508-511, 1994.
Charles, C., D. Rind, J. Jouzel, R. Koster, and R. Fairbanks, Seasonal precipitation timing and ice core records, Science, 269, 247-248,
1995.
Ciais, P., and J. Jouzel, Deuterium and Oxygen 18 in precipitation: An isotopic model including mixed cloud processes, J. Geophys. Res., 99,
16,793-16,803, 1994.
Ciais, P., J. W. C. White, J. Jouzel, and J. R. Petit, The origin of present day antarctic precipitation from surface snow deuterium excess data, J. Geophys. Res., 100, 18,917-18,927, 1995.
Craig, H., Isotopic variations in meteoric waters, Science, 133, 1702-
Dansgaard, W., Stable isotopes in precipitation, Tellus, 16, 436-468,
1964.
Dansgaard, W., J. W. White, and S. J. Johnsen, The abrupt termination
of the Younger Dryas climate event, Nature, 339, 532-534, 1989.
Dansgaard, W., et al., Evidence for general instability of past climate
from a 250-kyr ice-core record, Nature, 364, 218-220, 1993. Delmotte, M., Enregistrements climatiques a Law-Dome: Variabilit•
pour les p•riodes r•centes et pour la d•glaciation, Ph.D. thesis, 253
pp., 253 pp., Univ. Joseph Fourier, Grenoble, France, 1997. Druyan, L. M., and R. D. Koster, Sources of Sahel precipitation for
simulated drought and rainy seasons, J. Clim., 2, 1438-1466, 1989.
Fisher, D. A., A zonally averaged stable-isotope model coupled to a regional variable elevation stable isotope model, Ann. Glaciol., 14, 65-72, 1990.
Fisher, D. A., Remarks on the deuterium excess in precipitation in cold
regions, Tellus, 43B, 401-407, 1991.
Fisher, D. A., Stable isotope simulations using a regional stable isotope
model coupled to a zonally averaged global model, Cold Reg. Sci. Technol., 21, 61-77, 1992.
Grootes, P.M., M. Stuiver, J. W. C. White, S. J. Johnsen, and J. Jouzel, Comparison of the oxygen isotope records from the GISP2 and
GRIP Greenland ice cores, Nature, 366, 552-554, 1993.
Hansen, J., G. Russell, D. Rind, P. Stone, A. Lacis, S. Lebedeff, R. Ruedy, and L. Travis, Efficient three-dimensional global models for climate studies: Models I and II, Mon. Weather Rev., 111,609-662,
1983.
Hoffmann, G., and M. Heimann, Water tracers in the ECHAM gen- eral circulation model, in Isotope Techniques in the Study of Past and Current Environmental Changes in the Hydrosphere and the Atmo- sphere, edited by Int. At. Energ. Agency, Vienna, 1993.
Hoffmann, G., and M. Heimann, Water Isotope Modeling in the Asian Monsoon Region, Rep. 154, Max-Planck-Inst. fiir Meteorol., Hamburg, Germany, 1995.
Johnsen, S. J., W. Dansgaard, and J. W. White, The origin of Arctic precipitation under present and glacial conditions, Tellus, 41,452-
469, 1989.
Johnsen, S. J., et al., Irregular glacial interstadials recorded in a new
Greenland ice core, Nature, 359, 311-313, 1992.
Joussaume, S., and J. Jouzel, Paleoclimatic tracers: An investigation using an atmospheric general circulation model under ice age con- ditions, 2, Water isotopes, J. Geophys. Res., 98, 2807-2830, 1993. Joussaume, S., R. Sadourny, and J. Jouzel, A general circulation model
of water isotope cycles in the atmosphere, Nature, 311, 24-29, 1984. Joussaume, S. J., R. Sadourny, and C. Vignal, Origin of precipitating
water in a numerical simulation of the July climate, Ocean Air
Interact., 1, 43-56, 1986.
Jouzel, J., and R. Koster, A reconsideration of the initial conditions used for stable water isotopes models, J. Geophys. Res., 101, 22,933-
22,938, 1996.
Jouzel, J., L. Merlivat, and C. Lorius, Deuterium excess in an East
Antarctic ice core suggests higher relative humidity at the oceanic surface during the last glacial maximum, Nature, 299, 688-691, 1982.
Jouzel, J., G. L. Russell, R. J. Suozzo, R. D. Koster, J. W. C. White, and W. S. Broecker, Simulations of the HDO and H2180 atmo- spheric cycles using the NASA GISS general circulation model: The
seasonal cycle for present-day conditions, J. Geophys. Res., 92,
14,739-14,760, 1987.
Jouzel, J., R. D. Koster, R. J. Suozzo, G. L. Russell, J. W. C. White,
and W. Broecker, Simulations of the HDO and H•80 atmospheric
cycles using the NASA GISS general circulation model: Sensitivity experiments for present-day conditions, J. Geophys. Res., 96, 7495- 7507, 1991.
Jouzel, J., R. D. Koster, R. J. Suozzo, and G. L. Russell, Stable water
isotope behavior during the LGM: A GCM analysis, J. Geophys. Res., 99, 25,791-25,801, 1994.
Jouzel, J., et al., Validity of the temperature reconstruction from water isotopes in ice cores, J. Geophys. Res., 102, 26,471-26,487, 1997.
Koster, R. D., J. Jouzel, R. Suozzo, G. Russell, W. Broecker, D. Rind,
and P.S. Eagleson, Global sources of local precipitations as deter-
mined by the NASA/GISS GCM, Geophys. Res. Lett., 13, 121-124,
1986.
Koster, R. D., J. Jouzel, R. J. Suozzo, and G. L. Russell, Origin of July Antarctic precipitation and its influence on deuterium content: A
GCM analysis, Clim. Dyn., 7, 195-203, 1992.
Merlivat, L., and J. Jouzel, Global climatic interpretation of the deu- terium-oxygen 18 relationship for precipitation, J. Geophys. Res., 84, 5029-5033, 1979.
Petit, J. R., J. W. White, N. W. Young, J. Jouzel, and Y. S. Korot-
kevitch, Deuterium excess in recent Antarctic snow, J. Geophys. Res., 96, 5113-5123, 1991.
White, J. W. C., L. K. Barlow, and D. Gorodetzky, Deuterium excess
and 8D in the GISP2 ice core: Reconstructions of ocean conditions
from ice cores, paper presented at the GISP2/GRIP Meeting,
Greenland Ice Sheet Proj./Greenland Ice Core Proj., Wolfeboro,
N.H., 16-21 October, 1995.
White, J. W. C., L. K. Barlow, D. A. Fisher, P.M. Grootes, J. Jouzel,
S. J. Johnsen, M. Stuiver, and Clausen, H., The climate signal in the
stable isotopes of snow from Summit, Greenland: Results of com-
parisons with modern climate observations, J. Geophys. Res., 102,
26,425-26,439, 1997.
A. Armengaud, Laboratoire de Glaciologie et G•ophysique de
l'Environnement, CNRS/Universit• Grenoble 1, 38402, St Martin
d'H•res, Cedex, France. (e-mail: alex@glaciøg'ujf-grenøble'fr)
R. D. Koster, Hydrological Sciences Branch, Laboratory for Hydro- spheric Processes, NASA Goddard Space Flight Center, Code 974,
Greenbelt, MD 20771. (e-mail: randal'køster@gsfc'nasa'gøv) J. Jouzel and P. Ciais, Laboratoire des Sciences du Climat et de
l'Environnement, DSM, CEA Saclay, 91191, France.
(Received March 19, 1997; revised January 5, 1998;