HAL Id: hal-01381792
https://hal.archives-ouvertes.fr/hal-01381792
Submitted on 30 Oct 2020
HAL is a multi-disciplinary open access
archive for the deposit and dissemination of
sci-entific research documents, whether they are
pub-lished or not. The documents may come from
teaching and research institutions in France or
abroad, or from public or private research centers.
L’archive ouverte pluridisciplinaire HAL, est
destinée au dépôt et à la diffusion de documents
scientifiques de niveau recherche, publiés ou non,
émanant des établissements d’enseignement et de
recherche français ou étrangers, des laboratoires
publics ou privés.
Heterotrophic bacterial production and metabolic
balance during the VAHINE mesocosm experiment in
the New Caledonia lagoon
France van Wambeke, Ulrike Pfreundt, Aude Barani, Hugo Berthelot, Thierry
Moutin, Martine Rodier, Wolfgang R. Hess, Sophie Bonnet
To cite this version:
France van Wambeke, Ulrike Pfreundt, Aude Barani, Hugo Berthelot, Thierry Moutin, et al..
Het-erotrophic bacterial production and metabolic balance during the VAHINE mesocosm experiment in
the New Caledonia lagoon. Biogeosciences, European Geosciences Union, 2016, 13 (11), pp.3187-3202.
�10.5194/bg-13-3187-2016�. �hal-01381792�
www.biogeosciences.net/13/3187/2016/ doi:10.5194/bg-13-3187-2016
© Author(s) 2016. CC Attribution 3.0 License.
Heterotrophic bacterial production and metabolic balance during
the VAHINE mesocosm experiment in the New Caledonia lagoon
France Van Wambeke1, Ulrike Pfreundt2, Aude Barani1, Hugo Berthelot1, Thierry Moutin1, Martine Rodier3,a, Wolfgang R. Hess2, and Sophie Bonnet1,31Aix Marseille Université, CNRS/INSU, Université de Toulon, IRD, Mediterranean Institute of Oceanography (MIO)
UM110, 13288, Marseille, France
2University of Freiburg, Faculty of Biology, Schaenzlestr. 1, 79104 Freiburg, Germany
3Mediterranean Institute of Oceanography (MIO) – IRD/CNRS/Aix-Marseille University IRD Nouméa, 101 Promenade R.
Laroque, BPA5, 98848, Nouméa CEDEX, New Caledonia, France
anow at: IRD, Université de la Polynésie française – Institut Malardé – Ifremer, UMR 241 Ecosystèmes Insulaires Océaniens
(EIO), IRD Tahiti, PB 529, 98713 Papeete, Tahiti, French Polynesia
Correspondence to:France Van Wambeke (france.van-wambeke@mio.osupytheas.fr) Received: 24 November 2015 – Published in Biogeosciences Discuss.: 11 December 2015 Revised: 21 April 2016 – Accepted: 28 April 2016 – Published: 2 June 2016
Abstract. Studies investigating the fate of diazotrophs through the microbial food web are lacking, although N2
fixation can fuel up to 50 % of new production in some oligotrophic oceans. In particular, the role played by het-erotrophic prokaryotes in this transfer is largely unknown. In the frame of the VAHINE (VAriability of vertical and tropHIc transfer of diazotroph derived N in the south wEst Pacific) experiment, three replicate large-volume (∼ 50 m3) mesocosms were deployed for 23 days in the new Caledo-nia lagoon and were intentionally fertilized on day 4 with dissolved inorganic phosphorus (DIP) to stimulate N2
fix-ation. We specifically examined relationships between het-erotrophic bacterial production (BP) and N2fixation or
pri-mary production, determined bacterial growth efficiency and established carbon budgets. BP was statistically higher dur-ing the second phase of the experiment (P2: days 15–23), when chlorophyll biomass started to increase compared to the first phase (P1: days 5–14). Phosphatase alkaline activ-ity increased drastically during the second phase of the ex-periment, showing adaptations of microbial populations af-ter utilization of the added DIP. Notably, among autotrophs, Synechococcusabundances increased during P2, possibly re-lated to its capacity to assimilate leucine and to produce al-kaline phosphatase. Bacterial growth efficiency based on the carbon budget (27–43 %), was notably higher than generally cited for oligotrophic environments and discussed in links
with the presence of abundant species of bacteria expressing proteorhodopsin. The main fates of gross primary produc-tion (particulate + dissolved) were respiraproduc-tion (67 %) and ex-port through sedimentation (17 %). BP was highly correlated with particulate primary production and chlorophyll biomass during both phases of the experiment but was slightly corre-lated, and only during P2 phase, with N2fixation rates.
Het-erotrophic bacterial production was strongly stimulated after mineral N enrichment experiments, suggesting N-limitation of heterotrophic bacteria across the experiment. N2fixation
rates corresponded to 17–37 % of the nitrogen demand of heterotrophic bacteria. Our results suggest that most of the diazotroph-derived nitrogen fuelled the heterotrophic bacte-rial community through indirect processes generating dis-solved organic matter and detritus, like mortality, lysis and grazing of both diazotrophs and non-diazotrophs.
1 Introduction
In the south-west Pacific ocean, the natural occurrence of abundant and diverse plankton taxa capable of dinitrogen (N2) fixation (N2-fixing or diazotrophic organisms; e.g.,
Moisander et al., 2010) can fuel ∼ 50 % of new primary pro-duction (Garcia et al., 2007; Bonnet et al., 2015). However, little is known about the fate of the diazotroph-derived
nitro-gen (DDN) in this environment (Bonnet et al., 2016b). In par-ticular, the role played by the microbial food web, and among them the heterotrophic bacteria in the transformation of DDN is largely unknown. In the central gyre of the South Pacific, where N2 fixation is lower than in the south-west Pacific,
nitrogen is the first element limiting growth of both phyto-plankton and heterotrophic bacteriophyto-plankton as observed in short-term nutrient enrichment experiments (Bonnet et al., 2008; Van Wambeke et al., 2008a) or incubations with15 N-leucine or15N-NH+4, which significantly enhanced bicarbon-ate uptake (Halm et al., 2012). Such competition for nitrogen influences dissolved organic carbon accumulation in the sur-face layers and export. In the south-west Pacific, however, the phytoplankton–heterotrophic bacterial coupling has mainly been investigated in the New Caledonia Lagoon. In this sys-tem, phytoplankton and bacterial production show seasonal patterns, with maxima in December–January and annual bac-terial production representing 21 to 34 % of particulate pri-mary production (Torréton et al., 2010). In the oligotrophic stations of the lagoon, based on a bacterial growth efficiency of 10 % or less, dissolved phytoplankton release was not suf-ficient to sustain bacterial carbon demand (Rochelle-Newall et al., 2008). N-limitation of primary production is expected based on year-round dissolved inorganic nitrogen (DIN) to dissolved inorganic phosphorus (DIP) ratios and silicates to DIN ratios, which are respectively lower and higher than Redfield ratios (Torréton et al., 2010). However, N2fixation
is a recurrent feature in the lagoon (Garcia et al., 2007; Bie-gala and Raimbault, 2008), and no information is available on the potential role played by this process on the functioning of the microbial food web and how it could influence the fac-tors limiting heterotrophic bacterial production. As blooms of diazotrophs are transient events, the production of varying sources and quality of organic matter is expected, which may influence biogeochemical fluxes, in particular heterotrophic bacterial production.
Through the VAHINE (VAriability of vertical and tropHIc transfer of diazotroph derived N in the south wEst Pacific) programme (http://mio.pytheas.univ-amu.fr/ ?VAHINE-Project; Bonnet et al., 2016b), we experimentally investigated the fate of DDN in the planktonic food web and its potential impact on particle export. For this, we stud-ied the development and the fate of a diazotroph bloom en-hanced by intentional fertilization with DIP in large-volume (∼ 50 m3)mesocosms deployed in the oligotrophic part of the New Caledonian lagoon, DIP being considered to con-trol the nitrogen input by dinitrogen fixation in the SW Pa-cific upper surface waters (Moutin et al., 2005, 2008). The VAHINE experiment provided a unique opportunity to study such phytoplankton–heterotrophic bacteria interactions by simultaneously using biogeochemical techniques to assess stocks and fluxes in the same body of water for a period of three weeks. In particular, our objectives were (i) to explore factors controlling heterotrophic bacterial growth, (ii) to ex-amine the links between heterotrophic bacterial production
and the activity of N2-fixing organisms and primary
produc-ers and (iii) to study the fate of carbon inside mesocosms and the balance of autotrophy vs. heterotrophy. The factors controlling heterotrophic bacterioplankton were studied us-ing short-term nutrient enrichment experiments and measure-ments of alkaline phosphatase activity. In oligotrophic sys-tems, assimilation of organic nitrogen-containing molecules can also confer advantage for growth to some cyanobacteria (Zubkov et al., 2004; Mary et al., 2008a). Thus we quantified fluxes of leucine incorporation on a single cell basis, using flow sorting by cytometry (Talarmin et al., 2011).
2 Material and methods
2.1 Mesocosm description and sampling strategy Three large mesocosms (∼ 50 m3) were deployed as open tubes with unfiltered, nutrient-poor waters of the Nouméa lagoon close to the Boulari passage (22◦29.073 S– 166◦26.205 E) located 28 km of the coast from 13 January to 4 February 2013 (Fig. 1). After two days of stabilizing mixing and verticality of the mesocosms, they were closed at the bottom, which constituted the starting day of the exper-iment, and a sediment trap was screwed at the basis of the bottom cone of each mesocosm and changed every morning by scuba divers. The mesocosm design is based on Guieu et al. (2010) and the choice of the site in the lagoon, deploy-ment and sampling strategy are described in details in Bonnet el al. (2016b). The three triplicate mesocosms were supple-mented with 0.8 µM KH2PO4 between day 4 and day 5 of
the experiment to alleviate potential P limitation and induce a bloom of naturally present communities of N2fixing
organ-isms. All samples for the parameters described below were collected every morning for 23 days using a clean Teflon pumping system from three selected depths (1, 6 and 12 m) in each mesocosm (M1, M2 and M3) and in surrounding wa-ters (i.e. outside the mesocosms, hereafter called Nouméa la-goon waters). Seawater from each mesocosm was first filled in a polypropylene 50 L tank for stocks measurements, 4.5 L polycarbonate bottles for rates measurements and 10 L car-boys for diversity. All carcar-boys were immediately transferred onto the R/V Alis anchored close to the mesocosms to serve as a lab platform to ensure a quick processing of the sam-ples (cruise doi link: doi:10.17600/13100010). Subsampling procedure and analysis for inorganic nutrients, chlorophyll a (Chl) and their associated phaeopigments, DIP turnover time and N2 fixation rates are detailed in a companion paper
(Berthelot et al., 2015). Primary production (PP) was deter-mined from short-term (∼ 4 h) incubations around noon with H14CO3 (see details in Berthelot et al., 2015) and a model
of photosynthesis applied to calculate daily fluxes (Moutin et al., 1999). This model allows estimation of 24 h fluxes (dawn to dawn) from hourly rates, independent of starting time or duration of incubations, of the geographic origin of
Figure 1. Position of mesocosms implemented in the south-west lagoon of New Caledonia.
the samples or of the time of the year (i.e. systems with vary-ing dark–light periods). This model avoids the general biases introduced by the large variety of incubation conditions used in the Steeman-Nielsen (1952)14C methodology (Regaudie-de-Gioux et al., 2014 and references therein). Another advan-tage of this model is that it allows estimation of both PP (24 h dawn to dawn) and gross primary production (GPP). For 24 h incubations, GPP is 1.72 × PP as determined from the model (Fig. 5 in Moutin et al., 1999). This constant is applicable as long as 24 h-fluxes (dawn to dawn) are calculated using the same model.
2.2 Heterotrophic bacterioplankton abundances Flow-cytometry analyses were carried out at the flow-cytometry platform of the laboratory (https://precym.mio. univ-amu.fr/). Samples were analysed using a FACSCalibur (BD Biosciences, San Jose, CA). For heterotrophic bacte-rial abundance (BA), 1.8 mL of seawater was fixed with formaldehyde (2 % final concentration, 15 min incubation at RT, room temperature), frozen and stored in liquid N2
un-til analysis in the laboratory. After thawing at RT, 0.3 mL of each sample was incubated with SYBR Green II (Molecu-lar Probes, final conc. 0.05 % [v/v]) for 15 min at RT in the dark to stain nucleic acids (Marie et al., 1997). Cells were characterized by two main optical signals collected from the 488 nm laser: side scatter (SSC, related to cell structure) and green fluorescence (530/40488 nm), related to nucleic acids
staining. For the calculation of heterotrophic prokaryotes abundances, phytoplankton, in particular Prochlorococcus and Synechococcus, were gated out due to its red autofluo-rescence induced by the chlorophyll (Sieracki et al., 1995). We discriminated HNA (high nucleic acid) and LNA (low nucleic acid) cells and heterotrophic bacterial abundance (HBA) was calculated as the sum of both categories.
Tru-Count beads (BD Biosciences) and 2 µm beads (Fluoresbrite YG, Polyscience) were added to the samples just before anal-ysis. To determine the volume analysed by the flow cytome-ter, the flow rate was estimated by weighing three tubes of samples before and after a 3 min run. The cell abundance was determined by dividing the number of cells by the volume analysed, determined both by the TruCount beads and flow rate. All data were collected in log scale and stored in list-mode using the CellQuest software (BD Biosciences). Data analysis was performed using the SUMMIT v4.3 software (Dako).
2.3 Heterotrophic bacterial production
Heterotrophic bacterial production (BP) was estimated daily using the 3H-leucine incorporation technique (Kirchman, 1993), adapted from the centrifuge method (Smith and Azam, 1992). For each sample, triplicate aliquots (1.5 mL each) and one 1.5 mL control, killed with trichloracetic acid (TCA), were incubated with a mix of 6 nM hot leucine (L-[3H] leucine, Perkin Elmer® specific activity ranging 106 Ci mmole−1)and 14 nM cold leucine, at in situ surface temperature (on-deck incubators equipped with 50 % light intensity screen and cooled with circulating surface seawa-ter), for 1 h. Linearity of leucine incorporation was checked regularly by time series experiments. The live incubations were terminated with 5 % TCA (final concentration). Af-ter three runs of centrifugation/aspiration of the supernatant (once with the fixed sea water sample, once with a 5 % TCA rinse and once with an 80 % ethanol rinse), the pellet was resuspended in Packard Ultima Gold MW Scintillation liquid®. Radioactivity was counted using a Liquid Scintil-lation Analyzer Packard® 1600TR and the3H counting ef-ficiency was corrected for quenching. Concentration kinetic experiments showed that isotopic dilution factor ranged from
Na J 3 3 _00 630LP 561nm 580/30 488nm SYN-HI SYN-LO 630L P_ 56 1 n m - ch lo ro ph yl l a 580/30_488 nm - phycoerythrin LO-SYN Na J 3 3 _00 3845 8 630LP 488nm 580/30 488nm Synecchococcus (SYN) Prochlorococcus (PRO) picoEukaryotes (PE) 63 0L P_ 48 8 n m - ch lo ro ph yl l a 580/30_488 nm - phycoerythrin PE SYN PRO
(b)
(c)
53 0/ 40 _4 88 n m – S yB r g re en SSC_488 nm – size 4 BACTsy Vahine 4_001 LNA HNA P1 LNA HNA Hi-HNA(a)
HO-SYNFigure 2. Example (day 23 M3 1 m) of flow-cytometry cytogram dot plot of (a) naturally non-fluorescent bacterioplankton groups dis-criminated by their DNA content (SYBR green-induced fluorescence in arbitrary units (a.u.) vs. cell size (side scatter), after 488 nm laser excitation); (b) phototrophic groups discriminated by their chlorophyll a content (related to the red fluorescence intensity (a.u.) vs. phycoery-thrin related to the orange fluorescence intensity (a.u.) after 488 nm laser excitation); (c) low-orange (LO-SYN) and high-orange (HO-SYN) Synechococcus-like subgroups separated by their chlorophyll a content (after 561 nm laser excitation) vs. their phycoerythrin content (after 488 nm laser excitation).
1 to 1.56 and thus BP rates were calculated from leucine in-corporation rates using conversion factor adjusted from 1.5 to 2.4 kg C mole−1 leucine. Daily rates were calculated as-suming they are 24 times the hourly rate.
2.4 Nutrient addition experiments
The availability of phosphorus (P), nitrogen (N) and organic carbon (C) for heterotrophic bacteria was investigated by measuring changes in bacterial production following addi-tions of DIP (0.25 µM P), NO−3 and NH+4 (1 µM each) or glucose (10 µM C; final concentrations). Two bioassays were realized: one right before (day 4) and one two weeks af-ter (day 20) the DIP fertilization in M1 (samples from 1 m depth). Eight combinations were tested (P, N, C, PN, PC, NC and PNC) including the non-enriched control T. Each bioas-say condition was tested in triplicate in 60 mL polycarbonate bottles incubated for 48 h under in situ-simulated conditions in the on-deck incubator (described in Sect. 2.3). After incu-bation, each bottle was subsampled in order to measure BP using the leucine technique described in Sect. 2.3.
2.5 Alkaline phosphatase activity
Total alkaline phosphatase activity (APA) was measured at the three depths in M1, M2 and M3 and in Nouméa la-goon waters using the analog substrate methylumbelliferone phosphate (MUF-P, 1 µM final concentration; Hoppe, 1983). The linear increase in fluorescence of seawater with added MUF was measured over the incubation time (up to 8 h), in the dark with a TKO 100 Hoefer DNA fluorometer (single-wavelength with excitation/emission fixed at 365/460 nm but suitable for MUF). Concentration kinetics using a range from 25 to 2500 nM MUF-P were run on some occasions to check
that the 1 µM concentration used for routine measurements was sufficient to saturate enzyme activity. Blanks were run by adding the MUF-P to filtered boiled seawater and were shown to be insignificant. Calibration curves were made with MUF standards.
2.6 Statistical analyses
Non-parametric Mann–Whitney and Kruskal–Wallis tests were used to compare differences of each parameter stud-ied between mesocosms, periods of time or effects of vari-ous amendments on BP in the nutrient addition experiments. Model I linear regressions and Pearson correlation coefficient were used to study log–log relationships between BP and Chl or PP; and evolution of DOC and POC with time.
3 Results
Salinity and temperature measurements show that the water column was not stratified over the course of the experiment, except in the first two days, which were characterized by a slight stratification both inside and outside of the mesocosms (Bonnet et al., 2016b). No vertical stratification was observed in the mesocosms for bacterial production or alkaline phos-phatase activity (APA; see exemplary data for M1 in Sup-plement Fig. S1) as for most of the parameters (Bonnet et al., 2016b; Turk-Kubo et al., 2015; Berthelot et al., 2015). For all descriptions of biogeochemical stocks and fluxes, we thus used the average of the three depths to plot the temporal evolution within each mesocosm.
0 5 10 15 20 25 0 5 10 15 20 25 A PA ( nm ol e l -1 h -1) 0 200 400 600 800 0 5 10 15 20 25 B P ngC l -1 h -1 0 1 2 3 4 5 0 5 10 15 20 25 P P µ m o le C l d -1 -1 0 1 10 100 0 5 10 15 20 25 T DIP ( h) 0.0 0.2 0.4 0.6 0.8 1.0 1.2 1.4 1.6 0 5 10 15 20 25 Chl µ g l -1 M1 M2 M3 lagoon waters Time (days) Time (days)
(a)
(b)
(c)
(d)
(e)
(f)
P1 P2 P1 P2 00000 500000 1000000 1500000 0 5 10 15 20 25 time days 15 10 5 0 H B A x 10 5 ml -1Figure 3. Evolution of (a) chlorophyll a (Chl), (b) heterotrophic bacterial abundance (HBA), (c) primary production (PP), (d) heterotrophic bacterial production (BP), (e) alkaline phosphatase activity (APA) and (f) DIP turnover time (TDIP) in the three mesocosms M1, M2, M3 and in the lagoon waters (lagoon). Each point is the mean of the three depths sampled, error bars are standard deviations. For lagoon HBA, only data from 1 and 12 m depth are available occasionally and discrete data are presented instead.
3.1 Chlorophyll stocks and net primary production
Based on the Chl and PP dynamics, two periods P1 (days 5–14) and P2 (days 15–23) were identified after DIP fertil-ization, which were also identified by Berthelot et al. (2015) based on biogeochemical characteristics and by Turk-Kubo et al. (2015) based on changes in abundances of targeted di-azotrophs. Diatom heterocyst-forming symbionts associated with diatoms were abundant during P1, while a bloom of the unicellular N2-fixing cyanobacteria from Group C
(UCYN-C) occurred for P2 (Leblanc et al., 2016; Turk-Kubo et al., 2015). Chl stocks significantly increased during P2 com-pared to P1 in the three mesocosms (statistics are presented in Table 1). Chl concentrations during P2 in all three meso-cosms were significantly higher than those in the Nouméa lagoon for the same period. PP showed the same trend as for Chl, being higher during P2 in all three mesocosms (Fig. 3, Table 1). However, the PP rates and Chl concen-trations reached during P2 were not identical between the three mesocosms: M3 exhibited higher Chl concentrations during P2 (0.71 ± 0.30 µg L−1) than M2 (0.49 ± 0.18 µg
L−1) and M1 (0.42 ± 0.14 µg L−1, p < 0.001). This was equally true for PP rates (2.45 ± 0.76 µmole C L−1d−1 in
M3 compared to 1.47 ± 0.35 µmole C L−1d−1 in M2 and 1.09 ± 0.22 µmole C L−1d−1 in M1, p < 0.001). Signifi-cant increases of Chl and PP were also observed in la-goon waters (reaching in P2 0.30 ± 0.07 µg Chl L−1 and 1.36 ± 0.37 µmole C L−1d−1, respectively, Table 1).
3.2 Heterotrophic bacterioplankton abundance and production
Abundances of heterotrophic bacterioplankton (HBA) varied 10-fold, from 1.7 (day 9, M1, 1 m) to 12.8 × 10⁵cells mL−1 (M2, day 11, 6 m). Peaks of HBA were sporadic, like on day 11 in M1, but not repeated for the three depths sam-pled. They were possibly due to the presence of a patchy distribution of aggregates that could have biased some of the results. These peaks are occasional, and as they might re-flect the reality of a patchy distribution, they were kept in the figures, statistics and estimates of means per day. Av-erage HBA did not increase statistically between phase P1 and P2 in M1 and M2 but increased slightly (p < 0.05) from
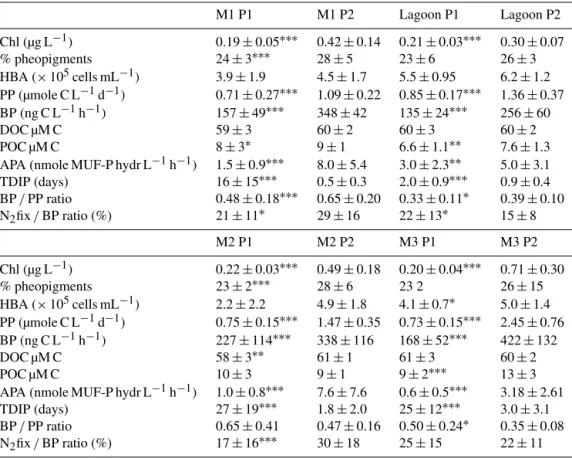
Table 1. Averages ± standard deviations of some parameters during phases P1 (from day 5 to day 14) and P2 (from day 15 to day 23) in the three mesocosms M1, M2, M3 and in the lagoon waters. HBA: heterotrophic prokaryotic abundances, BP: heterotrophic prokaryotic production, APA: alkaline phosphatase activity, TDIP: turnover time of DIP. N2fixation contribution to BP (N2fix / BP ratio, in %) is based
on a C / N of 6.8 for heterotrophic bacteria.
M1 P1 M1 P2 Lagoon P1 Lagoon P2 Chl (µg L−1) 0.19 ± 0.05∗∗∗ 0.42 ± 0.14 0.21 ± 0.03∗∗∗ 0.30 ± 0.07 % pheopigments 24 ± 3∗∗∗ 28 ± 5 23 ± 6 26 ± 3 HBA (× 105cells mL−1) 3.9 ± 1.9 4.5 ± 1.7 5.5 ± 0.95 6.2 ± 1.2 PP (µmole C L−1d−1) 0.71 ± 0.27∗∗∗ 1.09 ± 0.22 0.85 ± 0.17∗∗∗ 1.36 ± 0.37 BP (ng C L−1h−1) 157 ± 49∗∗∗ 348 ± 42 135 ± 24∗∗∗ 256 ± 60 DOC µM C 59 ± 3 60 ± 2 60 ± 3 60 ± 2 POC µM C 8 ± 3∗ 9 ± 1 6.6 ± 1.1∗∗ 7.6 ± 1.3 APA (nmole MUF-P hydr L−1h−1) 1.5 ± 0.9∗∗∗ 8.0 ± 5.4 3.0 ± 2.3∗∗ 5.0 ± 3.1 TDIP (days) 16 ± 15∗∗∗ 0.5 ± 0.3 2.0 ± 0.9∗∗∗ 0.9 ± 0.4 BP / PP ratio 0.48 ± 0.18∗∗∗ 0.65 ± 0.20 0.33 ± 0.11∗ 0.39 ± 0.10 N2fix / BP ratio (%) 21 ± 11∗ 29 ± 16 22 ± 13∗ 15 ± 8 M2 P1 M2 P2 M3 P1 M3 P2 Chl (µg L−1) 0.22 ± 0.03∗∗∗ 0.49 ± 0.18 0.20 ± 0.04∗∗∗ 0.71 ± 0.30 % pheopigments 23 ± 2∗∗∗ 28 ± 6 23 2 26 ± 15 HBA (× 105cells mL−1) 2.2 ± 2.2 4.9 ± 1.8 4.1 ± 0.7∗ 5.0 ± 1.4 PP (µmole C L−1d−1) 0.75 ± 0.15∗∗∗ 1.47 ± 0.35 0.73 ± 0.15∗∗∗ 2.45 ± 0.76 BP (ng C L−1h−1) 227 ± 114∗∗∗ 338 ± 116 168 ± 52∗∗∗ 422 ± 132 DOC µM C 58 ± 3∗∗ 61 ± 1 61 ± 3 60 ± 2 POC µM C 10 ± 3 9 ± 1 9 ± 2∗∗∗ 13 ± 3 APA (nmole MUF-P hydr L−1h−1) 1.0 ± 0.8∗∗∗ 7.6 ± 7.6 0.6 ± 0.5∗∗∗ 3.18 ± 2.61 TDIP (days) 27 ± 19∗∗∗ 1.8 ± 2.0 25 ± 12∗∗∗ 3.0 ± 3.1 BP / PP ratio 0.65 ± 0.41 0.47 ± 0.16 0.50 ± 0.24∗ 0.35 ± 0.08 N2fix / BP ratio (%) 17 ± 16∗∗∗ 30 ± 18 25 ± 15 22 ± 11
Mann–Whitney tests were performed to test significant differences between P1 and P2:∗p< 0.05;∗∗0.01 < p < 0.05;∗∗∗p< 0.001.
(4.1 ± 0.7) to (5.0 ± 1.4) × 105cells mL−1 in M3 (Table 1, Fig. 3). Evolution of BP in the mesocosms was close to that in lagoon waters during P1, except for a peak only detected on day 4 (the morning before DIP fertilization) in M1 and M3, and at day 5 in M2. These peaks were not related to any HBA, Chl or PP increase but were related to a steep increase in Rhodobacteraceae 16S ribosomal RNA genes (Pfreundt et al., 2016b). Just like PP, BP significantly in-creased during P2 in all three mesocosms with higher val-ues in M3 compared to M1 and M2 during P2 (Kruskal– Wallis test, p < 0.05). This BP increase was also observed in lagoon waters but with lower amplitude (Table 1). In the three mesocosms, the log–log relationship between BP and PP was significant only during P2 (r = 0.54, p < 0.001), whereas that between BP and Chl was significant during P1 and P2 (r = 0.4, p < 0.001 and r = 0.72, p < 0.001, respec-tively, Fig. 4). In lagoon waters, the BP / PP ratio slightly in-creased (but significantly) between P1 and P2 (0.33 to 0.39, p< 0.05, Table 1). The BP / PP ratio significantly increased during P2 in M1 (0.48 to 0.65, p < 0.001), significantly de-creased in M3 (0.50 to 0.35, p < 0.05) and remained stable in M2 (Table 1). Such differences probably depended on
vary-ing maximal values of PP in different mesocosms and the exact days when PP or BP started to increase. Thus we exam-ined the trend of BP / PP ratio with PP, keeping in mind the risk of autocorrelation. BP / PP ratio decreased when PP in-creased, with higher intensities in the mesocoms compared to lagoon waters, and was consistent for P1 or P2 (Table 2). The log–log relationship between N2fixation rates (nM d−1)and
BP (mg C m−3d−1)was insignificant during P1 and signifi-cant during P2 (log (BP) = 0.13 × log (N2fix rates) + 0.73,
r =0.21, p = 0.04, data not shown). 3.3 Alkaline phosphatase activity
APA was homogeneous between the three depths sampled from the mesocosms (example for M1 on Fig. S1), but this was not the case in the Nouméa lagoon, where activity was often higher at 1 m depth compared to the two other depths (data not shown). A slight but very reproducible decrease of APA occurred on days 5 and 6 in all three mesocosms where DIP fertilization took place and in lagoon waters only on day 5 (Fig. 3). DIP was consumed more rapidly in M1, mirrored by higher APA and lower TDIP between day 9 and 18 in this mesocosm (Fig. 3). APA then increased very rapidly in M1
Table 2. Log–log relationships between BP / PP ratio and PP (expressed in mgC m−3d−1). In mesocosms, phase P1 and P2 are separated for the regressions. r: Pearson correlation coefficient, p: probability.
Equation r p
Phase P1 log (BP / PP) = −0.87 × log(PP) + 0.49 0.59 < 0.001 Phase P2 log (BP / PP) = −0.53 × log(PP) + 0.33 0.6 < 0.001 Lagoon waters log (BP / PP) = −0.24 × log(PP) −0.19 0.28 < 0.01
lo g BP m g C m -3 d -1 P2 log BP = 0,61 log chl + 1,11 R=0.72 P1 log BP = 0,73 log chl + 1.13 R=0.4
Lagoon waters log BP = 1,26 log chl + 1,40 R=0.80 0.0 0.2 0.4 0.6 0.8 1.0 1.2 1.4 P2 P1 Out P2 log BP = 0,46 log PPP + 0,34 R=0.54
Lagoon waters log BP = 0,75 log PPP – 0.19 R=0.67 0.0 0.2 0.4 0.6 0.8 1.0 1.2 1.4 0.0 0.5 1.0 1.5 2.0 P2 P1 Lagoon waters log PP mg C m-3 d-1 log Chl mg C m-3 - 1.20 - 1.00 - 0.80 - 0.60 - 0.40 - 0.20 0.00 0.20 (a) (b)
Figure 4. Log–log relationships between heterotrophic bacterial production (BP) and (a) primary production (PP) or (b) chloro-phyll a (Chl).
and M2 after day 17, but only after day 21 in M3. Such delays were in agreement with the evolution of DIP, which was less rapidly consumed in M3 compared to M1 and M2 (Berthelot et al., 2015). Consequently, although mean APA increased significantly in all three mesocosms between P1 and P2 (Ta-ble 1), it was lower in M3 compared to M1 and M2 dur-ing P2 (3.1 vs. 7.5–7.9 nmole MUF-P hydrolyzed L−1h−1, respectively, p < 0.01). Finally, APA also increased signifi-cantly between P1 and P2 in the lagoon waters, albeit to a lower extent as in the mesocosms (from 3 to 5 nmole MUF-P hydrolyzed L−1h−1, Table 1). It is noteworthy that APA in the lagoon waters exhibited the strongest increase between day 10 and 11 and stayed at this higher level until day 23, thus exhibiting different dynamics than in the mesocosms. 3.4 Enrichment experiments
In the two 48 h nutrient enrichment experiments performed on day 4 and on day 20, BP increased 3-fold after nitrogen
0 300 600 900 1200 1500 Co P N G PN PG NG NPG Enrichment type 0 300 600 900 1200 1500 Co P N G PN PG NG NPG Enrichment type
Day 4
Day 20
*
*
*
*
*
*
*
* *
*
B
P
n
g
C
l
h
-1 -1Figure 5. Response of heterotrophic bacterial production to the en-richment experiments conducted on days 2 and 20. Asterisks show significant responses in comparison to the unamended control (Co) after the Mann–Whitney test (∗: p < 0.05).
addition (NH+4+NO−3) compared to the unamended con-trols. This significant increase was observed irrespective of whether these N sources were added alone or in combination with DIP or glucose (N, NP, NC, NPC treatments, Fig. 5, p< 0.03). Only PC and C addition on day 4 led to signifi-cant BP increase without N addition (p < 0.05) however, it increased to a much smaller extent than with all N combi-nations (factor 1.5 and 1.1, respectively). On day 20, only N amendments led to significant BP increases after 48 h incuba-tions, compared to the unamended control (Fig. 5, p < 0.03).
-20 -10 0 10 20 30 40 50 60 5 10 15 20 25 Time inte gr ate d C (µ M C) Days GPP Cexp POC DOC 0 10 20 30 40 50 60 GPP OM sinks BCD 1 BCD 2 C bug et ( µM C ) GPP Cexp POC DOC resp BP
(a)
(b)
Figure 6. Carbon budget of the mesocosms with time (µM C). (a) Evolution of time-integrated gross primary production (GPP), C export in sediment traps (Cexp); time-integrated net POC and net DOC are calculated assuming linear fits of these variables between days 5 and 23 (see Table 3). (b) Budget of time-integrated data on day 23. The difference GPP – (Cexp + net DOC + net POC) was assumed to be community respiration (resp). The range of heterotrophic bacterial carbon demand (BCD) was calculated based on two hypotheses: BR = 100 % CR (BCD 1) or BR = 50 % CR (BCD 2). Standard errors are plotted from the sum of each category using propagation of errors.
3.5 Cell-specific leucine incorporation rates
Among the different groups sorted by flow cytometry, sig-nificant cell-specific leucine incorporation rates into macro-molecules were obtained for heterotrophic bacterioplankton. LNA, HNA and hi-HNA cells had specific activities rang-ing from 20 to 554 × 10−21mole cell−1h−1. Overall, cell-specific leucine incorporation rates for LNA cells were lower than rates for HNA cells (except d19), and rates for Hi-HNA cells were 1.2–4.8 times greater than rates for HNA cells (Ta-ble 3). All cell-specific rates increased when bulk activities increased. Among autotrophic groups, significant leucine in-corporation was detected for Prochlorococcus cells (PRO) only on day 21 and day 23, due to the low volume available for sorting and a significant decrease of PRO abundances in the samples to be sorted when compared to the abun-dances determined on samples analysed only three months after the experiment. We checked on fresh Mediterranean samples that Prochlorococcus cells were clearly detectable with the flow cytometer setting chosen so we could discard any instrument problem. We assumed that the lower detec-tion of the PRO cells was due to the long storage period of
3H-leucine labelled samples until cell sorting (two years at
−80◦C) that could induce a loss of fluorescence or cell dam-ages. We obtained a maximum of 1200 sorted PRO cells. Thus, even when the signal was significant, it was associ-ated with a high standard deviation (40 % on day 21, Ta-ble 3). In contrast, Synechococcus cells (SYN) were easily detected and their total abundance matched with the total counts determined on samples analysed three months after the experiment. Additional 561 and 355 nm laser excitations allowed us to distinguish two different subgroups, not clearly distinguishable using only 488 nm laser excitation, separated
mainly on the criterion of orange fluorescence (LO-SYN and HO-SYN; Fig. 2), suggesting different relative amounts of accessory pigments (Neveux et al., 2010). Leucine incorpo-ration was detected in both SYN groups for all analysed sam-ples. For a given sampling date, cell-specific rates of both groups were almost equal, and increased on day 21 and 23 compared to days 15 and 19. They were lower than LNA cell-specific rates (from ∼ 20 % of the LNA rates at day 15 to ∼ 70 % at day 21). Cell-specific rates of LO-SYN and HO-SYN diverged only on day 23 (Table 3). At this date, cell spe-cific rates for LO-SYN were twice as high as for LNA cells, reaching 131 × 10−21mole cell−1h−1. Overall, the contribu-tion of the two Synechococcus groups to the bulk activity was very low: it ranged from 0.2 to 0.7 % for LO-SYN or HO-SYN (i.e. the contribution reached a max of 1.5 % for both SYN groups together) and 0.01–0.02 % for PRO (when detected), respectively. Contribution of LNA cells to the bulk activity was 4–12 %. Thus, the most important contribution to the bulk leucine activity was due to HNA and Hi-HNA cells.
3.6 Carbon budget
We used the advantage of a day-to-day sampling in an en-closed system to compute a carbon budget that will allow us to estimate the fate of phytoplankton-derived organic car-bon and the metabolic balance. This carcar-bon budget was cal-culated using time-integrated data and thus took into ac-count the whole data set. First, each time point was aver-aged for the three sampling depths, and then time integra-tion was calculated separately for each mesocosm assuming a linear trend between two successive days. A mesocosm av-erage was calculated based on the time-integrated data
ob-Table 3. Specific leucine activities of main groups sorted: PRO (Prochlorococcus), LO-SYN (low orange fluorescence Synechococcus-like cells), HO-SYN (high orange fluorescence Synechococcus-like cells, PE (autotrophic pico-eukaryotes), LNA (low nucleic acid), HNA (high nucleic acid), Hi-HNA (high size and high nucleic acid) heterotrophic bacteria and bulk activities (total community leucine incorporation rates) corresponding to the same sample. When tests of reproducibility have been done, the corresponding data are indicated with their standard deviation. bdl: below detection limits, lag: lagoon waters.
PRO LO SYN HO SYN PE LNA HNA Hi-HNA Bulk
×10−21mole leu cell−1h−1 pmole leu L−1h−1 d15 M1 bdl 4.6 ± 1.9 3.5 ± 0.3 19 ± 5 20.6 ± 0.2 67 ± 1 79 97 ± 3
d19 M1 bdl 5.4 3.5 17 27 16 80 126 ± 3 d21 lag 69 ± 28 30 ± 4 25 ± 4 79 ± 12 39 214 554 186 ± 6 d23 M3 22 131 42 108 56 113 356 242 ± 7
tained in each of the three mesocosms, with error bars rep-resenting the standard deviation (SD) among the three meso-cosms (Fig. 6a). Gross primary production (GPP) is derived from PP assuming GPP = PP × 1.72 (Moutin et al., 1999) and represents the whole photosynthetic source of organic matter, including both particulate and extracellular release forms. The cumulated GPP at day 23 was 38 ± 11 µM C (Fig. 6b). Carbon exported by sedimentation into the traps (Cexp) was corrected in µM C units based on a mean con-stant water volume inside M1, M2 and M3 (see Berthelot et al., 2015 for details) and its cumulated value reached 6.4 ± 2.1 µM C on day 23. For POC and DOC, for which data were more irregular and showed outliers, we decided to calculate net variations of POC and DOC after a lin-ear fit of the discrete data set between days 5 and 23 in each mesocosm (Table 4). POC increased linearly in M1 and M3 (0.12 and 0.48 µmole C L−1d−1, r = 0.32 p < 0.03 and r = 0.70 p < 0.001, respectively) and showed no trend in M2. A significant increase of DOC was only observed in M2 (Table 4). Due to the high SD resulting from variability in net variation of POC and DOC vs. time between the three mesocosms, the average accumulation of DOC and POC esti-mated for the carbon budget was negligible (Fig. 6a), and the most important measured fate of GPP was Cexp, representing 17 % of GPP (Fig. 6b). GPP – (net DOC + net POC + Cexp) can be considered as community respiration (CR). CR was calculated and reached 27 ± 11 µM cumulated from day 5 to 23, i.e. 71 % of GPP.
4 Discussion
4.1 Variability within the triplicate mesocosms
Overall, M3 exhibited maximum peaks of chlorophyll biomass as well as PP and BP rates, and these different re-sponses were particularly seen during P2. A time lag of a few days in the succession of the different planktonic popula-tions was noticed, particularly for nitrogen fixers (Turk-Kubo et al., 2016), and DIP was consumed more rapidly in M1. However, slight divergence in biological and chemical
evo-lution among different replicated mesocosms is not uncom-mon, particularly after the first week of enclosure (Martínez-Martínez et al., 2006; Pulido-Villena et al., 2014). Here, the divergence probably resulted from a combination of bottom-up (availability of DIP and nitrogen) and top-down controls (grazing pressure and viral lysis). The initial conditions pre-vailing before the DIP enrichment could occur also at the origin of the divergence. Indeed mesocosms were closed three days before the DIP addition, and many species of dia-zotrophs exhibit a patchy distribution (Bombar et al., 2015). In addition, Hunt et al. (2016) noticed larger amount of zoo-plankton individuals in M3 at the beginning of the experi-ment, some of which, stressed by the mesocosms, might have died (some larger amounts of “swimmers” were recovered in the traps in M3), contributing to supplementary sources of N in M3. Nevertheless, overall the replicability among mesocosms was considered sufficiently correct for most of the biogeochemical stocks, fluxes and abundances of phyto-plankton groups (Bonnet et al., 2016b) and thus our results are discussed based on averages.
4.2 N limitation and coupling between BP and N2
fixation
BP was significantly enhanced on a short-term scale (1–2 days) by NO−3+NH+4 but not by DIP or glucose amend-ments, indicating that BP was directly N-limited and/or indi-rectly after stimulation of N-limited phytoplankton (Fig. 4). In the New Caledonia lagoon, N-limitation has previously been suggested, based on a 1-year survey of nutrient ra-tios (Torréton et al., 2010). N-limitation is a recurrent fea-ture observed in the ultra-oligotrophic south-eastern Pacific Gyre (Van Wambeke et al., 2008a; Halm et al., 2012), as assessed from short-term (1–3 days) enrichment exper-iments or incubations. As N2 fixation is assumed to be
the only process providing a source of new nitrogen to the mesocosms in this experiment, we examined the po-tential links between N2 fixation rates and BP. First,
ma-rine heterotrophic diazotrophs were detected at low abun-dances during the mesocosms experiment: γ -24774A11 with
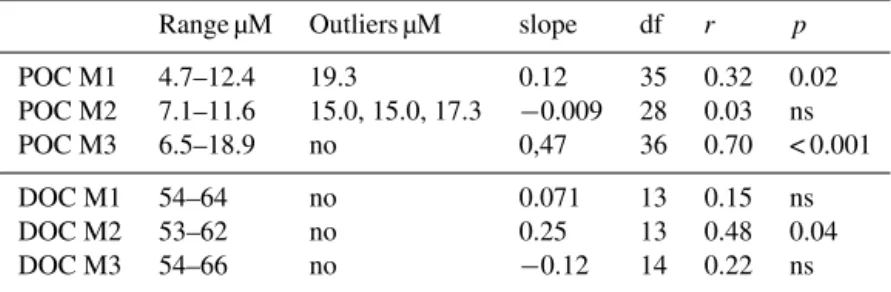
Table 4. Linear regression fits on temporal trends of POC and DOC in M1, M2 and M3 from days 5 to 23. DOC has been sampled only at 6 m depth in the three mesocosms. df: degree of freedom, r: Pearson correlation coefficient, p: probability, ns: not significant. For POC trend, some outliers have been suppressed from the regressions.
Range µM Outliers µM slope df r p POC M1 4.7–12.4 19.3 0.12 35 0.32 0.02 POC M2 7.1–11.6 15.0, 15.0, 17.3 −0.009 28 0.03 ns POC M3 6.5–18.9 no 0,47 36 0.70 < 0.001 DOC M1 54–64 no 0.071 13 0.15 ns DOC M2 53–62 no 0.25 13 0.48 0.04 DOC M3 54–66 no −0.12 14 0.22 ns
ca. 102–103 nifHgene copies L−1 (Turk-Kubo et al., 2015), and 16S tags corresponding to heterotrophic diazotrophs like Bradyrhizobium or Mesorhizobium were scarce (Pfre-undt et al., 2016b). Therefore, N2fixation directly performed
by heterotrophic bacteria probably accounted for a minor fraction of bulk N2 fixation during the mesocosm
experi-ment. Second, as the log–log relationship between N2
fixa-tion rates and bacterial producfixa-tion was not significant dur-ing P1, and only slightly significant durdur-ing P2 (r = 0.21, p =0.04), the excretion of DON (dissolved organic nitrogen) and NH+4 by diazotrophs likely did not supply much nitro-gen for heterotrophic prokaryotes directly, particularly dur-ing P1 when the main organisms responsible for diazotrophy were diatom-symbiotic (Turk-Kubo et al., 2015). Assuming a C / N molar ratio of around 6.8 for heterotrophic prokary-otic biomass (Fukuda et al., 1998), N2fixation might have
provided 17 to 30 % of the nitrogen demand of heterotrophic prokaryotes, depending on the phase and the mesocosm con-sidered (Table 1). This proportion increases to 30–37 % if we consider a C / N ratio of 8.2, which seems more ap-propriate in the Pacific Ocean (Fukuda et al., 1998). Thus, N2 fixation contributed to, but was not sufficient to
sus-tain, 100 % of the N requirements of heterotrophic bacteria during this study. Other potential sources were initial DON stocks, concentrations of which decreased slightly at the end of the experiment (Berthelot et al., 2015) and detritus. In-deed, there was a decay of larger phytoplankton cells af-ter the closure of the mesocosms as discussed by Knapp et al. (2015) and Leblanc et al. (2016) following DIP avail-ability (TDIP) as well as decreases in PP (Berthelot et al., 2015) and Synechococcus 16S tags dropped substantially between days 2 and 4 (Pfreundt et al., 2016b). Such de-tritus probably also contributed to sustain BP. NanoSIMS analyses were performed during a parallel experiment done at the height of a bloom of diazotrophic Cyanothece-like cyanobacteria (UCYN-C) on days 17–20 in M2 (Bonnet et al., 2016a). After 24 h of 15N2-incubations, these authors
reported significant 15N-enrichment in picoplanktonic cells (0.2–2 µm fraction). This confirmed a rapid (one day) transfer of DDN (also15N-enriched) to picophytoplankton, and po-tentially heterotrophic bacteria. However, such transfer likely
occurred indirectly through DON after mortality and graz-ing processes, as shown by model simulations run durgraz-ing the VAHINE project (Gimenez et al., 2016).
4.3 Alkaline phosphatase activity and P acquisition A slight TDIP decrease was noticed in the mesocosms
be-fore the DIP spike but not in the lagoon, suggesting a lower P availability inside and not outside the mesocosms. There-fore, N2 fixers might benefit from continuous and variable
inputs of DIP sources in the lagoon waters during that pe-riod. This is also confirmed by the low values of alkaline phosphatase activity in the lagoon at the start of the experi-ment. Whether these sources were coming from the benthos (Torréton et al., 2002), the atmosphere (soot emission can influence lagoon waters inside and outside the barrier reef, Mari et al., 2014) and/or currents (Fichez et al., 2010) is be-yond the scope of this study. Inside the mesocosms, when the added DIP was consumed, the observed increase of APA could be due to (i) a population switch towards phosphatase producers, which can be heterotrophic bacteria and phyto-plankton, and (ii) increases in specific activities due to en-zymatic induction or (iii) both. We used POP as a proxy of living biomass (Duhamel et al., 2007) to estimate specific activities (nmole MUF-P hydrolyzed per unit POP per unit time) and found the same trend for specific activities and for bulk APA (i.e. specific activity increased up to 10-fold). APA was produced by different phylogenetic groups of het-erotrophic bacteria, but also by cyanobacteria, as shown on a metatranscriptomic study in the special issue (Pfreundt et al., 2016a), with the highest levels of alkaline phosphatase transcripts originating from Synechococcus on days 14 and 20. Our results and those of Pfreundt et al. (2016a) sug-gested a switch towards a microbial population that pro-duced phosphatase to escape P depletion after a transient P-replete period. Although TDIPdecreased and APA increased
up to values analogous to those observed in P-limited ar-eas (Moutin et al., 2002; Van Wambeke et al., 2002, respec-tively), heterotrophic bacteria stayed continuously N-limited but not P-limited. As discussed in Pfreundt et al. (2016a, b), some acquisition mechanisms of large P-containing organic
molecules and reduction of cellular P quota also helped mi-crobial communities to resist P depletion during P2 phase. 4.4 Cyanobacterial assimilation of leucine
BP was used in this study as a strict proxy of heterotrophic bacterial production. As we incubated3H leucine under light conditions, we could not exclude the hypothesis that pho-toheterotrophic activity and the possibility that some photo-synthetic cyanobacteria incorporate leucine could biases BP estimates. Whether light stimulation of bacterial production can be explained by direct effects (assimilation or organic molecules by autotrophs), indirect effects (stimulation of BP through release of organic molecules or photolabilization of organic matter) or both is difficult to determine (Béjà and Suzuki, 2008). Assimilation of methionine, leucine and ATP was shown to be enhanced under light-incubation conditions in the North and South Atlantic oceans and these increases are generally attributed to stimulation of Prochlorococcus and SAR11 (Evans et al., 2015), but the spectrum of or-ganic molecules tested is low. In the New Caledonia lagoon, incubation of samples under different light regimes influ-ences estimates of BP determined by the thymidine technique (Rochelle-Newall et al., 2008), but so far there is no infor-mation available on the light effect on leucine uptake around New Caledonia. The capacity of both marine Prochlorococ-cusand Synechococcus to assimilate some organic molecules is evident from culture studies, as well as flow-cytometry cell-sorting and gene studies (Béjà and Suzuki, 2008). As-similation of leucine by cyanobacteria can also occur in the dark (Talarmin et al., 2011), but light clearly favours assimi-lation of leucine by cyanobacteria (Mary et al., 2008b). The polypropylene tubes used in this study to incubate BP attenu-ated the light intensity by 40 % without spectral distortion in the visible range (Richardson and Porter, 2005). Under such conditions, which were intermediary between simulated in situ light conditions and dark conditions, significant incor-poration of leucine into macromolecules was seen by flow-cytometry sorting of Synechococcus cells. We could not un-ambiguously verify leucine incorporation into Prochlorococ-cuscells due to technical reasons (low volumes and long stor-age limitations). To conclude, although the relative contribu-tion of cyanobacteria (PRO + SYN) to the bulk (community) leucine assimilation into proteins was less than 2 % and could not be responsible for a bias in BP estimates, we estimate sig-nificant potential for leucine to be assimilated by cyanobac-teria. Note that we used a 10 nM leucine concentration for cell sorting, but in situ natural concentrations could be much lower. More studies are needed, investigating the potential use of other organic molecules in lower, close to in situ con-centrations. Mixotrophy may be the rule rather the exception in these experimental systems (Moore, 2013; Evans et al., 2015).
4.5 Phytoplankton-bacteria coupling and metabolic balance
Torréton et al. (2010) report mean Chl concentration around 0.3 µg L−1over a seasonal cycle performed at an oligotrophic station in the New Caledonia lagoon. These concentrations are close to our reference conditions outside the mesocosms (lagoon waters), where means of Chl values were 0.21 and 0.30 µg L−1 during P1 and P2 phases. Under these olig-otrophic conditions, the seasonal variability of BP and PP in the Nouméa lagoon is much lower than in temperate waters, only about 3-fold with an average BP / PP ratio of 0.21 and some rare peaks reaching 0.6 (Torréton et al., 2010). This is in accordance with the range of BP / PP ratios encountered in the lagoon waters during our study, with average values ranging 0.33 to 0.39 during phases P1 and P2, respectively. On the contrary, inside the mesocosms, average BP / PP ra-tios were generally higher than in the lagoon waters what-ever the phase or the mesocosm considered. A negative trend of BP / PP with increasing PP was obtained, suggesting that a larger fraction of PP is channelled through the microbial food web when PP decreases, as observed in the oligotrophic Mediterranean Sea (Conan et al., 1999). This is also the trend when considering a large oceanic data set examined by Fouil-land and Mostajir (2010). Indeed in their study, regression of log(BP) as a function of log(PP) resulted in a slope of 0.57, inferring that BP increases less rapidly than PP when PP in-creases. Contrary to the weakness (during P2) or absence of (during P1) correlation between BP and N2 fixation rates
described above, strong relationships between BP and Chl, and between BP and PP were obtained during both phases (Fig. 4). This suggests that N2fixation stimulated autotrophic
communities during the VAHINE experiment, which may in turn have produced organic matter for heterotrophic prokary-otes. BP and PP are determined routinely, but to estimate the flux of PP channelled through heterotrophic bacteria or to in-fer metabolic balance between autotrophy and heterotrophy, bacterial carbon demand (BCD) and gross primary produc-tion (GPP) must be also estimated. Such carbon fluxes are not directly estimated but are derived from PP and BP us-ing additional measurements of bacterial growth efficiency (or bacterial respiration) and phytoplankton extracellular re-lease of DOC. These parameters are less frequently acquired due to time-consuming and difficult technologies (del Gior-gio and Cole, 1998; Nagata, 2000), which led to contro-versy on the metabolic balance in oligotrophic environments (Cole et al., 1988; Ducklow et al., 2002; Van Wambeke et al., 2008b; Fouilland and Mostajir, 2010; Moran and Alonso-Saez, 2011). BCD is derived from BP by the use of bacte-rial growth efficiency (BGE) or respiration rates which are not often measured concomitantly with PP and BP, and in many oligotrophic environments BCD / PP is higher than 1, or respiration exceeds PP (del Giorgio et al., 1997). To ex-plain this, different arguments are generally proposed. First, other DOM sources than those deriving from phytoplankton
(allochthonous sources) are used to sustain BCD. In Pacific lagoons, excretion of mucus by coral has been proposed as a supplementary source of DOM for heterotrophic bacterio-plankton (Torréton et al., 2002; Wild et al., 2004). Second, phasing between BP and PP peaks during seasonal blooms and occasional presence of PP bursts (see for example Stein-berg et al., 2001) are not always detected due to inappropriate sampling frequency for BP and PP measurements. Daily and parallel measurements of both BP and PP in the mesocosms avoided such problems in this study.
Assuming negligible effect of a biofilm development on the mesocosms walls (Knapp et al., 2015) on the plankton C budget, the main fate of photosynthetically fixed organic carbon during the experiment was respiration (71 % of GPP) then sedimentation (17 % of GPP). The different responses between the triplicate mesocosms led to a great propagation of errors and thus the variability of CR / GPP ratio was also high (70 ± 36 %). CR being lower than GPP, the biological system inside mesocosms was net autotrophic, with an up-per error limit close to metabolic balance between autotrophy and heterotrophy.
In the lagoon, close to Grande Rade Bay, long residence times favoured local degradation, refractorization of organic matter and not sedimentation (Mari et al., 2007). However, as these authors discussed, modification of phytoplankton com-munity composition in Grande Rade Bay and the presence of metals could influence sticking properties of polymers. The confinement of the seawater inside the mesocosms prob-ably favoured to some extent the accumulation of UCYN-aggregates, as well as a possible reduction of grazing pres-sure (by a factor of 1.6) in the mesocosms compared to those in the lagoon waters (Turk-Kubo et al., 2015; Bonnet et al., 2016a; Hunt et al., 2016). However, UCYN-C formed large aggregates (100–500 µm) embedded in an organic ma-trix that included TEP, which were largely responsible for enhanced export flux through sedimentation observed dur-ing P2 (Berthelot et al., 2015; Berman-Frank et al., 2016; Knapp et al., 2015). TEP evolution with time, however, and the TEP-C to TOC ratio were similar in the lagoon waters, where wave turbulence and tidal effects were present, and in the enclosed mesocosms, where these hydrodynamics were reduced and concentrations were similar (Berman-Frank et al., 2016). In an unconstrained ordination analysis, Pfreundt et al. (2016b) described significant differences in bacterial communities between M1 and the lagoon, but similar tempo-ral dynamics. Direct comparisons of our export results with findings from open ocean studies should be made cautiously as our mesocosms were both shallower (15 m) than in typ-ical oceanic export studies (> 100 m) and exhibited reduced turbulence.
In order to calculate the fraction of GPP that directly or indirectly channelled through the microbial food web, the bacterial carbon demand (BCD) must be estimated through additional estimates of bacterial respiration (BR) or bacte-rial growth efficiency (BGE). In an oligotrophic site inside
the Nouméa lagoon, BGE was estimated at 10 % using in-cubated samples where oxygen changes were followed with time in the dark (Briand et al., 2004). However, as suggested by Aranguren-Gassis et al. (2012), using consistently low BGE, derived from size fractionation experiments and long-duration incubations, leads to probable BGE underestima-tion. In the lagoon, the use of a 10 % BGE would lead to BCD values higher than GPP (Rochelle-Newall et al., 2008). If we assume such low BGE in the mesocosms (10 %), cumulated BR from day 5 to 23 would rise to 93 ± 6 µM C, which is not realistic compared to CR estimated from the carbon budget. A more appropriate BGE of 27 ± 9 to 43 ± 11 % could be calculated, based on minimum and maximum ranges admit-ted for BR / CR ratio (from 100 to 50 %, Lemée et al., 2002), and based on propagation of errors due to the variability within triplicate mesocosms (Table S1 in the Supplement). For sensitivity analysis of BR and BGE calculation from the carbon budget, we examined whether the errors of different methodological assumptions (conversion factors, analytical errors) were higher than those arising from variability be-tween triplicate mesocosms. We considered different errors based on literature data for all the parameters used in com-putation of BR and BGE (i.e. GPP, Cexp, DOC, POC and BP). For GPP, we assumed GPP = 1.72 × PP, i.e. PP / GPP ratio = 58 %. In the South Pacific Ocean, the mean average PP to GPP ratio (based on comparison between oxygen and
14C technique) was 47 % (Van Wambeke et al., 2008b). If
we consider that the sum of dissolved and particulate PP in the lagoon (14C technique, Rochelle-Newall et al., 2008) is a good proxy of GPP, then an upper limit for this ratio is 65 % in the lagoon. We thus applied a 15 % variability to the PP / GPP ratio, leading to GPP = 1.36 × PP to 2.32 × PP, i.e. approximately a 30 % variability on the conversion factor. For BP, we assumed a 25 % daily variability of BP (Church et al., 2006; Van Wambeke et al., 2008c; Torréton et al., 2010). For Cexp, DOC and POC, we assumed analytical er-rors of 10 %. We then used propagation of erer-rors to compute the error associated with BR and BGE (Table S1). For GPP, the errors resulting from triplicate mesocosms or resulting from conversion factor and analytical errors were the same. According to the propagation of errors, the error associated with GPP has the largest effect on estimates of BR. The un-certainty of DOC, POC and Cexp arising from variability within the triplicate mesocosms is higher than the method-ological error, whereas it is the opposite for BP. Overall, the uncertainty of BGE estimates arising from variability within triplicate mesocosms or methodology is similar (27 ± 9 or 27 ± 10 % for BGE based on BR = CR, 43 ± 11 or 43 ± 12 % for BGE based on BR = CR / 2)
The BGE values determined from C budget could be potentially related to a beneficial effect of photoheterotro-phy. Indeed, in a companion metatranscriptomic study per-formed in M1 (Pfreundt et al., 2016a), accumulation of prote-orhodopsin transcripts was recurrently detected among vary-ing groups of bacteria notably Pelagibacteraceae and SAR86
These groups, belonging to the alpha- and gammaproteobac-teria, respectively, were also abundant community mem-bers as observed through 16S sequencing (Pfreundt et al., 2016b). Aerobic anoxygenic phototrophic (AAP) bacterial abundances are reported to be particularly abundant in the South Pacific Ocean (Lami et al. 2007), but to date, AAP abundances are not available in the lagoon and they were not counted in this experiment. Nevertheless, Pfreundt et al. (2016a) detected expression of the pufM gene, encod-ing a photoreaction centre protein of AAP bacteria. Tran-script abundances were an order of magnitude lower than for proteorhodopsin and only observed for a group of Rhodocy-claceaeon day 14 but were much weaker for Rhodobacter-aceae on day 18. This suggests that AAP bacteria did not play a major role in the investigated system and did not in-fluence the above calculation to a large extent. Dokdonia sp. strain MED134, a proteorhodopsin-containing flavobacteria, was shown to increase the maximum number of cells reached when growing in light compared to darkness. However, if DOM was added initially, light vs. dark responses changed depending on DOM concentrations (Gomez-Consarnau et al., 2007). Other laboratory experiments, in contrast, showed no difference in growth rates or maximum cell yields of Pelagibacter ubique cultures grown in natural seawater (in a diurnal light regime or in complete darkness; Giovannoni et al., 2005). The BGE of a bacteriochlorophyll-containing strain (Erythrobacter sp.) was shown to increase during light periods in a continuous culture (Hauruseau and Koblížek, 2012). Thus the energy benefits of photoheterotrophy re-main controversial and are related to the difficulty of hav-ing true oligotrophic conditions in pure culture. Based on an energy budget, Kirchman and Hanson (2013) suggested that the net energy gained by light is mostly sufficient to meet maintenance cost of AAP but is not enough to meet that of proteorhodopsin-based photoheterotrophic bacteria. Het-erotrophic bacteria are limited by N but also by energy in the South Pacific (Van Wambeke et al. 2008a); this could give an advantage to photoheterotrophic prokaryotes for growth and their success in this area.
Assuming BGE values ranging from 27 to 43 %, the BCD / GPP ratio would range from 63 to 99 %. A large part of the GPP is thus channelled through the microbial food web pathway within 20 days. To examine potential links between phytoplankton release and BP, we estimated a extracellular release of 35 %, as determined previously inside the Nouméa lagoon (Rochelle-Newall et al., 2008). Such values are in agreement with a higher percent of extracellular release that is generally obtained in nutrient-limited environments (Na-gata, 2000). According to Rochelle-Newall et al. (2008), con-temporaneous DOC excreted by phytoplankton was suffi-cient to meet BCD only in the coastal part of the lagoon, but not in the offshore oligotrophic part of the lagoon where the VAHINE experiment was performed, but these authors used a 10 % BGE. In the mesocosms, still based on an extracellu-lar release representing 35 % of GPP, DOC release was
esti-mated at 13 µM C produced between 5 and 23 days. This is not sufficient to satisfy BCD cumulated for the same period (calculated as 24–38 µM C), although we used BGE vary-ing from 27 to 43 % as discussed above. Thus, heterotrophic bacteria in the mesocosms used additional, not contempora-neous, sources of organic matter derived from phytoplankton after transformation through the food web like enzymatic hy-drolysis of detritus, viral lysis and/or sloppy feeding.
5 Conclusions
This study confirms that in the Nouméa lagoon, N2fixation
is a relevant process for fuelling the microbial food web and sustaining a biological system which is net autotrophic or close to metabolic balance. The relatively high BGE com-puted from the carbon budget (27–43 %) could be related to light-harvesting systems developed by abundant bacte-rial photoheterotrophs. The success of Synechococcus over Prochlorococcus described in companion papers (Leblanc et al., 2016; Pfreundt et al., 2016b) might be attributed to their ability to assimilate leucine and possibly other amino acids, as well as reduction of their cellular P demand through sulfolipid synthesis. The relative importance of mixotrophy in these oligotrophic system implies that it is important to (i) find alternative techniques to dark incubations to estimate bacterioplankton respiration, similarly to continuous mea-surements with oxygen microprobes during alternate light and dark periods (Pringault et al., 2007) and (ii) to detect or-ganisms responsible for the assimilation of a wide variety of organic molecules by cell sorting. From the carbon budget, a BCD to GPP ratio was estimated to range between 63 and 100 %; thus a large part of the primary production is chan-nelled through the microbial food web. Bacterial production was strongly coupled with Chl biomass and/or PP, rather than with N2fixation rates, suggesting that indirect routes through
lysis, grazing and mortality of phytoplankton were substan-tial for providing labile organic matter for heterotrophic bac-teria.
The Supplement related to this article is available online at doi:10.5194/bg-13-3187-2016-supplement.
Author contributions. Sophie Bonnet was the chief scientist re-sponsible for the VAHINE programme. She designed and exe-cuted the experiment in mesocosms. France Van Wambeke sam-pled for and analysed BP and APA, Thierry Moutin samsam-pled for and analysed TDIP and PP, Aude Barani performed the cell
sort-ing, wrote the corresponding M&M section and made Fig. 2, Hugo Berthelot contributed to the analyses of bacterial abundances by flow cytometry, Martine Rodier sampled for and analysed Chl data; France Van Wambeke and Ulrike Pfreundt equally wrote the manuscript and made the other figures. All the authors reviewed the manuscript.
Acknowledgements. Funding for this research was provided by the Agence Nationale de la Recherche (ANR starting grant VAHINE ANR-13-JS06-0002), INSU-LEFE-CYBER programme, GOPS, IRD and M.I.O. The participation of UP and WRH was supported by the German-Israeli Research Foundation (GIF), project number 1133-13.8/2011 and the MiSeq-based microbial community analysis by the EU project MaCuMBA (Marine Microorganisms: Cultivation Methods for Improving their Biotechnological Ap-plications; grant agreement no: 311975) to WRH. The authors thank the captain and crew of the R/V Alis. We acknowledge the SEOH divers service from the IRD research centre of Nouméa (E. Folcher, B. Bourgeois and A. Renaud) and from the Observa-toire Océanologique de Villefranche-sur-mer (OOV, J. M. Grisoni) as well as the technical service of the IRD research centre of Nouméa for their helpful technical support. C. Guieu, F. Louis and J. M. Grisoni from OOV are warmly thanked for the mesocosms design and their useful advice for deployment. We are grateful to the Regional Flow Cytometry Platform for Microbiology (PRE-CYM) of the Mediterranean Institute of Oceanography (MIO) for the flow-cytometry analyses. We acknowledge Anne Desnues for help in sampling, Karine Leblanc, Bruno Charrière, Jules Héliou for analysing TOC, POC and Chl data and four referees which helped to improve the manuscript.
Edited by: F. Lacan
References
Aranguren-Gassis, M., Teira, E., Serret, P., Martínez-García, M., and Fernández, E.: Potential overestimation of bacterial respi-ration rates in oligotrophic plankton communities, Mar. Ecol.-Prog. Ser., 453, 1–10, 2012.
Béjà, O. and Suzuki, M.: Photoheterotrophic marine prokaryotes, in: Microbial Ecology of the Oceans, Second Edn., edited by: Kirchman, D., John Wiley & Sons, New York, 131–157, 2008. Berman-Frank, I., Spungin, D., Rahav, E., Van Wambeke, F.,
Turk-Kubo, K., and Moutin, T.: Dynamics of transparent exopoly-mer particles (TEP) during the VAHINE mesocosm experi-ment in the New Caledonia lagoon, Biogeosciences Discuss., doi:10.5194/bg-2015-612, in review, 2016.
Berthelot, H., Moutin, T., L’Helguen, S., Leblanc, K., Hélias, S., Grosso, O., Leblond, N., Charrière, B., and Bonnet, S.: Dinitro-gen fixation and dissolved organic nitroDinitro-gen fueled primary pro-duction and particulate export during the VAHINE mesocosm experiment (New Caledonia lagoon), Biogeosciences, 12, 4099– 4112, doi:10.5194/bg-12-4099-2015, 2015.
Biegala, I. and Raimbault, P.: High abundance of diazotrophic pico-cyanobacteria (< 3 µm) in a south-west Pacific coral lagoon, Aquat. Microb. Ecol., 51, 45–53, 2008.
Bombar, D., Taylor, C. D., Wilson, S. T., Robidart, J. C., Rabines, A., Turk-Kubo, K. A., Kemp, J. N., Karl, D. M., and Zehr, J. P.: Measurements of nitrogen fixation in the oligotrophic North Pacific Subtropical Gyre using a free-drifting submersible incu-bation device, J. Plankton Res., 37, 727–739, 2015.
Bonnet, S., Guieu, C., Bruyant, F., Prášil, O., Van Wambeke, F., Raimbault, P., Moutin, T., Grob, C., Gorbunov, M. Y., Zehr, J. P., Masquelier, S. M., Garczarek, L., and Claustre, H.: Nutrient limitation of primary productivity in the
South-east Pacific (BIOSOPE cruise), Biogeosciences, 5, 215–225, doi:10.5194/bg-5-215-2008, 2008.
Bonnet, S., Rodier, M., Turk-Kubo, K., Germineaud, C., Menkes, C., Ganachaud, A., Cravatte, S., Raimbault, P., Campbell, E., Quéroué, F., Sarthou, G., Desnues, A., Maes, C., and Eldin, G.: Contrasted geographical distribution of N2fixation rates and
nifH phylotypes in the Coral and Solomon Seas (South-Western Pacific) during austral winter conditions, Global Biogeochem. Cy., 29, 1874–1892, doi:10.1002/2015GB005117, 2015. Bonnet, S., Berthelot, H., Turk-Kubo, K., Fawcett, S., Rahav, E.,
L’Helguen, S., and Berman-Frank, I.: Dynamics of N2
fixa-tion and fate of diazotroph-derived nitrogen in a low-nutrient, low-chlorophyll ecosystem: results from the VAHINE mesocosm experiment (New Caledonia), Biogeosciences, 13, 2653–2673, doi:10.5194/bg-13-2653-2016, 2016a.
Bonnet, S., Moutin, T., Rodier, M., Grisoni, J.-M., Louis, F., Folcher, E., Bourgeois, B., Boré, J.-M., and Renaud, A.: In-troduction to the project VAHINE: VAriability of vertical and tropHIc transfer of diazotroph derived N in the south wEst Pa-cific, Biogeosciences, 13, 2803–2814, doi:10.5194/bg-13-2803-2016, 2016b.
Briand, E., Pringault, O., Jacquet, S., and Torréton, J.-P.: The use of oxygen microprobes to measure bacterial respiration for deter-mining bacterioplankton efficiency, Limnol. Oceanogr.-Meth., 2, 406–416, 2004.
Cole, J. J., Findlay, S., and Pace, M. L.: Bacterial production in fresh and saltwater ecosystems : a cross – system overview, Mar. Ecol.-Prog. Ser., 43, 1–10, 1988.
Conan, P., Turley, C., Stutt, E., Pujo-Pay, M., and Van Wambeke, F.: Relationship between phytoplankton efficiency and the propor-tion of bacterial producpropor-tion to primary producpropor-tion in the Mediter-ranean Sea, Aquat. Microb. Ecol., 17, 131–144, 1999.
Church, M. J., Ducklow, H. W., Letelier, R. M., and Karl, D. M.: Temporal and vertical dynamics in picoplankton photo-heterotrophic production in the subtropical North Pacific Ocean, Aquat. Microb. Ecol., 45, 41–53, 2006.
del Giorgio, P. A. and Cole, J. J.: Bacterial growth efficiency in natural aquatic systems, Annu. Rev. Ecol. Syst., 29, 503–541, 1998.
del Giorgio, P., Cole, J. J., and Cimbleris, A.: Respiration rates in bacteria exceeds phytoplankton production in unproductive aquatic systems, Nature, 385, 148–151, 1997.
Ducklow, H. W., Kirchman, D. L., and Anderson, T. R.: The magni-tude of spring bacterial production in the North Atlantic Ocean, Limnol. Oceanogr., 47, 1684–1693, 2002.
Duhamel, S., Moutin, T., Van Wambeke, F., Van Mooy, B., Rim-melin, P., Raimbault, P., and Claustre, H.: Growth and specific P-uptake rates of bacterial and phytoplanktonic communities in the Southeast Pacific (BIOSOPE cruise), Biogeosciences, 4, 941– 956, doi:10.5194/bg-4-941-2007, 2007.
Evans, C., Gómez-Pereira, P. R., Martin, A. P., Scanlan, D., and Zubkov, M. V.: Photoheterotrophy of bacterioplankton is ubiq-uitous in the surface oligotrophic ocean, Prog. Oceanogr., 135, 139–145, 2015.
Fichez, R., Chifflet, S., Douillet, P., Gérard, P., Gutierrez, F., Jouon, A., Ouillon, S., and Grenz, C.: Biogeochemical typology and temporal variability of lagoon waters in a coral reef ecosystem subject to terrigeneous and anthropogenic inputs (New Caledo-nia), Mar. Pollut. Bull., 61, 309–322, 2010.