ACHIEVING MASS CUSTOMIZATION IN THE BOEING WIRE RESPONSIBILITY CENTER
By
MATTHEW KIRK NAPIER
Bachelor of Science in Molecular Biology University of Washington (1990)
Submitted to the Sloan School of Management and the Department of Civil and Environmental Engineering in partial fulfillment of the requirements for the degrees of
Master of Science in Management and
Master of Science in Civil and Environmental Engineering In conjunction with the Leaders for Manufacturing Program
at the Massachusetts Institute of Technology June, 2000
* 2000 Massachusetts Institute of Technology. All rights reserved.
Signature of Author_
Sloan School of Management, MIT Department of Civil and Environmental Engineering, MIT May 5, 2000
Certified by
Duncan Simester, Thesis Supervisor Associate Professor of Management Science, MIT
Certified by
Kevin Otto, Thesis Supervisor Associate Professor of Mechanical Engineering, IT
Certified by:
Sarah Slaughter, Thesis Reader Assistant Professor of Civil and Environmental Engineering, MIT
Accepted by
Daniefe Veneziano, Chairman, Departmental Committee on Graduate Studies Department of Civil and Environmental Engineering, MIT
Accepted by
Mdgart Addrews, Executive Director of the MBA Program j AQAiCHUSETTS INSTITUTC I Sloan School of Management, MIT
ACHIEVING MASS CUSTOMIZATION IN THE BOEING WIRE
RESPONSIBILITY CENTER
By
MATTHEW KIRK NAPIER
Submitted to the Sloan School of Management and the Department of Civil and Environmental Engineering in partial fulfillment of the requirements for the degrees of
Master of Science in Management and
Master of Science in Civil and Environmental Engineering
Abstract
Customized options are costly to produce using the current production and design methods of the Boeing Commercial Airplane Group (BCAG). The company is
redesigning its engineering and manufacturing processes in order to enhance its ability to deliver customized options cost effectively. The majority of the company's continuous improvement efforts to date have centered on either its manufacturing operations or its engineering processes, and significant progress has been made in the areas of lean production and reduced flowtimes. While there is still plenty of room for improvement within each functional group of the business, there is arguably much more opportunity for improvement in the relationships between functional groups.
The thesis analyzes the potential for significant cost improvements of initiatives that focus on formalizing cross functional continuous improvement relationships between the engineering and manufacturing groups. The analysis is conducted in the form of a case study of the company's Wire Responsibility Center (WIRC), which has the distinction of handling more customization, variability and change than most other areas of the
company. This high degree of variation is coupled with large volumes of product
-hundreds of units per plane -to produce fertile ground for the study of process improvements between engineering and manufacturing teams.
This study shows the significant impact of the WIRC's Change, Error, and Rework (CER) Initiative on the quality and cost of its products and offers suggestions for further
improvement. The thesis concludes with a discussion of how effective application of the lessons learned from this pilot project could greatly improve the profitability of The Boeing Company's Commercial Airplane Group.
Thesis Advisors:
Duncan Simester
Professor of Marketing, Sloan School of Management, MIT Kevin Otto
Acknowledgements
I would first like to thank The Boeing Company for their membership in the Leaders For
Manufacturing Program and for sponsoring my internship. I am very fortunate to have had the opportunity to learn from such an enormously talented group of people.
Next I would like to thank the sponsors, directors, and affiliates of the Leaders For Manufacturing program. I have been blessed with opportunities to participate in some outstanding academic programs in my life but none have been nearly as rewarding. I also need to thank the Sloan Business School, the Department of Civil and Environmental Engineering, and the Massachusetts Institute of Technology and for their significant roles in the LFM experience.
My corporate and academic advisors were instrumental in making the internship and thesis
project the incredible learning experiences that they were. I would like to acknowledge them individually.
I would first like to thank Mike W. Morse, my corporate advisor at Boeing, for the
inordinate amount of time he spent making my internship experience so highly valuable. His experience, industry and company knowledge, list of contacts, patience, and political and social acumen were all made available to me and were greatly appreciated.
I am also very grateful for the opportunity to have worked with my incredibly talented
academic advisors. Their patience and input have been invaluable. Thank you to Kevin Otto, Professor of Mechanical Engineering, for making my thesis infinitely better by taking the time to provide highly value-added feedback. Thanks also to Duncan Simester, Professor of Management Science in the Marketing Department, for taking the time to help me out despite also teaching four sections of Marketing this term. The efforts of Sarah Slaughter, Professor of Civil and Environmental Engineering, who took the time to provide valuable feedback despite short notice, are also greatly appreciated.
Many individuals at Boeing need to be recognized individually for their time and efforts. They are: Mike Denton, my executive sponsor, Blake Emery, Archie Cohn, Bill Greene,
Rob Reimers, and Bob Lebo from the ACPS group, Bruce Moravec, Dave Ball, Matt Gianni, Garth Windley, Ron Ericksen, Tasha Rankin, Bob Carnahan, and others from the WIRC, Steve Rolling from Customer Engineering, and Mike Mesick from 737/757 QA. I would also like to thank all the LFM alumni at Boeing whose hospitality, time,
experience, and knowledge were greatly appreciated. I would especially like to
acknowledge Keith Jackson, Lindsay Anderson, Mike Carnette, Tim Copes, and Sharon Reickels for their availability and/or for greatly improving my final presentation.
I would like to thank my fellow LFM intern Oliver Weir for sharing his knowledge,
contacts, and input before, during, and after our seven months at The Boeing Company.
Finally, I would like to thank my friends, family, and classmates for their guidance, patience, and friendship during this stressful process.
My fiancee, Sarah Evans, is especially appreciated for her love, companionship,
Table of Contents
LIST OF FIGURES 9
1 INTRODUCTION AND OVERVIEW 10
1.1 MASS CUSTOMIZATION - DEFINITION 10
1.1.1 EXAMPLES 10
1.1.2 APPLICATION TO THE BOEING COMMERCIAL AIRPLANE GROUP (BCAG) 11
1.2 GENERAL METHODS FOR ACHIEVING MASS CUSTOMIZATION 12
1.2.1 PROJECT FOCUS - THESIS STATEMENT 13
1.2.2 CONTINUOUS IMPROVEMENT - DEFINITION 13
1.2.3 MODULARITY - DEFINITION AND EXAMPLES 14
1.3 PROJECT OVERVIEW 16
1.4 RELATED RESEARCH 17
1.5 THESIS OUTLINE 17
2 PRODUCTION SIDE OF INTEGRATION TO SUPPORT MASS
CUSTOMIZATION 18
2.1 COMPANY BACKGROUND, POSITION, AND OUTLOOK 18
2.1.1 MASS CUSTOMIZATION - PROGRESS TO DATE 18
2.2 THE WIRE RESPONSIBILITY CENTER (WIRC) 19
2.2.1 THE WIRC'S POSITION IN THE AIRPLANE PRODUCTION PROCESS 20
2.3 UNIQUE ASPECTS OF THE WIRE RESPONSIBILITY CENTER 21 2.4 PROJECT FOCUS -ADVANCED DESIGN CHANGE NOTIFICATIONS (ADCN's) 21
3 DEVELOPMENT SIDE OF INTEGRATION TO SUPPORT MASS
CUSTOMIZATION 23
3.1 OVERVIEW OF WIRC DEVELOPMENT PROCESSES 23
3.2 FEEDBACK SYSTEMS/INTERFACES 26
3.3 WIRC SHOP FLOOR LAYOUT 26
3.4 THE ELECTRICAL CORRECTIVE ACTION TEAM (ECAT) 28
4 ANALYSIS OF DIFFICULTIES IN INTEGRATION TO SUPPORT MASS
CUSTOMIZATION 29 4.1 4.2 4.2.1 4.3 4.3.1 4.3.2 PROBLEM DISCOVERY
THE CHANGE, ERROR, AND REWORK (CER) INITIATIVE
COST IMPACT OF ERRORS
THE FIRST ITERATION
INITIAL RESULTS
THE REST OF THE STORY
29 30 31 32 33 35
4.3.3 4.3.4 LESSONS LEARNED NEXT STEPS 36 37
5 SOLUTION TO THE DIFFICULTIES OF INTEGRATION TO SUPPORT MASS
CUSTOMIZATION 39
5.1 SHORT TERM OPPORTUNITIES 39
5.1.1 INTEGRATION OF THINKING AND DOING 39
5.2 LONG TERM POSSIBILITIES 40
5.3 ENABLING MASS CUSTOMIZATION 41
6 CONCLUSIONS 43
6.1 CONTINUOUS IMPROVEMENT IN ENGINEERING 43
6.2 IMPACT ON BCAG'S PROFITABILITY 44
7 APPENDIX 45
List of Tables
Table 1: Five Fundamental Strategies for Mass Customization 12 Table 2: Estimated Cost Savings From Reduction in WIRC ADCN's 737NG Program 32
List of Figures
Figure 1: Continuous vs. Breakthrough Improvement 14
Figure 2: Six Types of Modularity for Mass Customization 15
Figure 3: Overview of Airplane Production Process 20
Figure 4: Overview of WIRC Processes 23
Figure 5: Engineering and Design Layout and Process Flow 25
Figure 6: WIRC Fabrication Shop Floor Layout 27
Figure 7: Sources of ADCN's for the 737NG 29
Figure 8: Total Number of WIRC ADCN's for the 737NG April - July 1999 30 Figure 9: Sample CER Initiative Error Type Feedback Form 33
Figure 10: Percent of Error Free Drawings 34
Figure 11: Total Number of WIRC ADCN's for the 737NG, July - Oct 1999 35
1
Introduction and Overview
1.1 Mass Customization - Definition
It sounds so simple. Mass customization is the production and distribution of customized goods and services on a mass basis. It is a paradox. Until recently, the terms mass and
customized were considered to be mutually exclusive opposites in the manufacturing world.
Modem technology is challenging this assumption and transforming the idea of mass customization from an impossible dream to a tangible and attainable competitive advantage.
As an "umbrella concept2,,,
mass customization covers a broad range of techniques and possibilities, depending on the industry being observed. Mass is a relative term, not only within a specific industry, but also between industries. There are also varying degrees of customization within and across industries. The ultimate goal of mass producing individually customized goods and services is more attainable in some industries than others. The tenets of mass customization, however, can be applied universally to achieve tremendous increases in variety without corresponding increases in cost.
1.1.1 Examples
Customization in the form of product proliferation is running rampant in every industry from banking to breakfast cereals. There are dozens of choices to be made during what used to be a simple task of buying toothpaste and a toothbrush. Setting up phone service and subscribing to cable television involve deciding between an ever-increasing number of options and packages3.
The computer industry is well known for its ability to offer personalized systems at little or no additional cost. Toyota is allowing customers to design their own cars, from a limited set of options, with a delivery target of five days.
Cars are a good example of a product that is relatively large, complex, and highly integrated, much like airplanes. The auto industry has not matched the level of mass customization of other industries, but companies like Toyota have achieved significant
competitive advantages by pursuing the ideal. Houses are another relatively large example. Modular housing companies in Japan and Scandinavia are mass customizing highly individualized manufactured homes that bear no resemblance to the prefabricated version sold in the United States4.
Even specialized machine makers, like Ingersoll Milling Machines in the United States, and Valmet Paper Machinery in Finland, are achieving lower costs and higher quality in their craft-produced products5 by applying the principles of mass customization. Craft manufacturing is the antithesis of mass production (it is the way cars were made before Ford introduced standardized parts and the moving assembly line). If this costly, inefficient, labor-intensive means of production can benefit from mass customization, any company with modem production methods can as well. If craft manufacturers of paper machines, which produce highly specialized products in volumes of only one or two per year, can apply the technological principles of mass customization, so too can The Boeing Company.
1.1.2 Application to the Boeing Commercial Airplane Group (BCAG)
This logic also works in reverse. Industries with simpler products and shorter product life cycles like computers also gain tremendous competitive advantage through mass customization. The "DNA" of mass customization is as applicable to these "fruit fly7"
products and companies as it is to larger, more complex products and companies.
The term mass customization can also be used as a communication tool for managers to explain why development and production cycle times must decrease, why hierarchies are flattening, and why the business is re-engineering its processes.
Customization is a very familiar concept to Boeing. BCAG's products are already customized to a very large degree. For example, customers often differentiate their airplanes around interior layout, such as seating arrangements and positioning of galleys and lavatories. The problem for Boeing is the cost associated with the customization. Proper application of the mass customization strategies that are germane to Boeing's business can have a profound effect on the company's competitiveness and profitability.
1.2 General Methods for Achieving Mass Customization
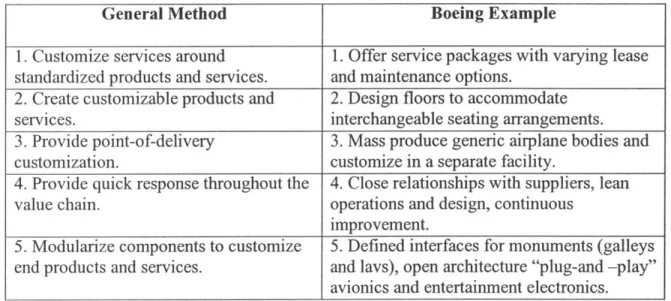
In research on a variety of products, B. Joseph Pine found that there are five fundamental strategies for achieving the low cost-production of customized products8. They are listed in Table 1 along with examples from within BCAG.
Table 1. Five Fundamental Strategies for Mass Customization
General Method Boeing Example
1. Customize services around 1. Offer service packages with varying lease
standardized products and services. and maintenance options.
2. Create customizable products and 2. Design floors to accommodate
services. interchangeable seating arrangements.
3. Provide point-of-delivery 3. Mass produce generic airplane bodies and
customization. customize in a separate facility.
4. Provide quick response throughout the 4. Close relationships with suppliers, lean
value chain. operations and design, continuous
improvement.
5. Modularize components to customize 5. Defined interfaces for monuments (galleys end products and services. and lavs), open architecture "plug-and -play"
avionics and entertainment electronics. The relevance of these methods varies from industry to industry, depending on a myriad of factors such as product size, production volume, number of suppliers, and product complexity, among many others. As Table 1 shows, however, they are all potentially applicable to BCAG. They also represent a huge opportunity for Boeing to decrease production costs, increase customer satisfaction, and bury its competition.
As will be seen in Chapter 2, the company has made some progress in these areas. Teams have been formed to perform feasibility studies on all five of these methods to determine which of them make the most sense for Boeing to pursue and in what order they should be implemented. Point-of-delivery customization (#3), also known as "Last-Stage Customization", may be an option for some airplane models but implementation of this strategy would be overly disruptive and costly to Boeing's business and isn't expected to become viable in the foreseeable future. The high degree of integrality in airplanes, which causes customization decisions to impact early steps in production (extra cargo capacity requires thicker airplane "skin", for example), is another sizable deterrent for this strategy.
Boeing's progress in applying these customization methods will be discussed further in section 2.1.1. A brief overview is presented here. Method #1, customizing around services, is being pursued in conjunction with methods 2, 4, and 5, which deal more with the production of customized products. The company has recognized the opportunities and advantages of creating customizable products (#2), providing quick response throughout the value chain, called lean production and design (#4), and designing modularized components such as "plug-and-play" entertainment electronics (#5) that can be easily combined to create customized products. Creating customizable products and designing modularized components, however, require enormous engineering resources that cannot be
spared at this time.
1.2.1 Project Focus - Thesis Statement
The company has explored ways of providing quick response throughout the value chain (method #4), mostly through close relationships with suppliers and lean production initiatives. This project focuses on providing this quick response by capitalizing on continuous improvement opportunities between the engineering and manufacturing teams of BCAG. It shows how cost-effective mass customization can be achieved by formalizing cross-functional continuous improvement methodologies between engineering and manufacturing teams.
1.2.2 Continuous Improvement - Definition
Continuous improvement has many meanings. For the purpose of the thesis, continuous improvement will be distinguished from "breakthrough improvements". As Figure 1 shows, continuous improvement can be thought of as refining the processes that occur in between breakthrough innovations9. As will be discussed further in Chapter 2 and Chapter 6, the company has a long and successful history of achieving breakthrough
improvements during new model introductions. New wing designs, two-person cockpits, and extended range are examples of breakthrough improvements. Defect reduction efforts such as GE's six sigma program and incremental cost improvements driven by new materials sourcing or supply chain management are examples of continuous improvement.
The thesis will show how added emphasis on continuous improvement between new product introductions can help the company achieve its cost reduction goals.
Figure 1. Continuous vs. Breakthrough Improvement
Continuous Improvement Results Breakthrough Improvement Time
1.2.3 Modularity - Definition and Examples
In Mass Customization: The New Frontier in Business Competition, B. Joseph Pine II
identifies modularity as "the best method for achieving mass customization'". He cites several examples of companies who have minimized costs while maximizing individual customization by creating (modular) components that can be configured into a wide variety of products.
Lutron Electronics Company in Coopersburg, Pennsylvania, produces over 11,000 different lighting control systems on a single assembly line from modularized, standard components. Lutron engineers work with individual customers to discover their needs and develop customized products for them. When Lutron has 100 or so models designed, engineering and production get together and "rationalize" the product line down to fifteen or twenty standardized, modular components that can be configured into the same 100 models that customers can purchase
Black & Decker put a number of competitors out of business in the 1970's by creating a new line of products out of standardized, modular components. As a result of simplifying, modularizing, and standardizing, they were able to produce 122 basic tools such as handsaws, drills, and sanders, out of a relatively small set of standardized components. Their costs plummeted while their variety increased'.
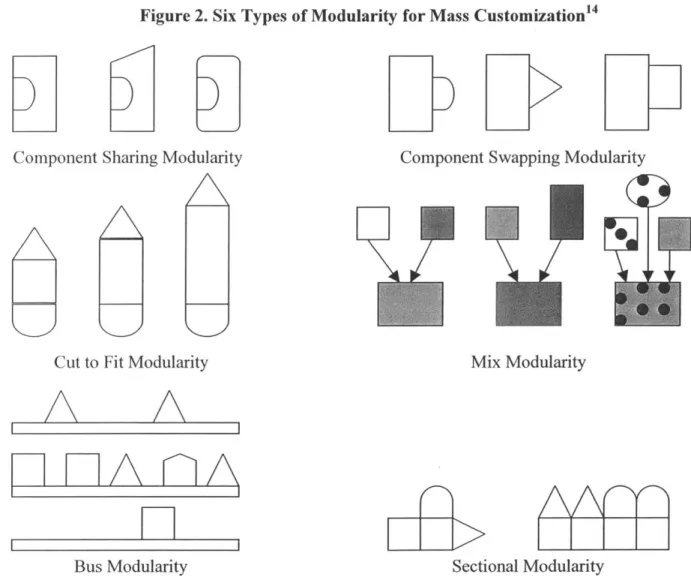
There are six different kinds of modularity 3. Figure 2 shows simplified illustrations of each.
Figure 2. Six Types of Modularity for Mass Customization 4
Component Sharing Modularity
Cut to Fit Modularity
Bus Modularity
Component Swapping Modularity
Mix Modularity
Sectional Modularity
In component sharing modularity, the same component is used in multiple products. There are numerous examples of this type of modularity, such as common parts (tires, batteries, oil filters, steering wheels) in several models of automobile. Component swapping modularity involves pairing different components with the same basic product. Swatch
watches and personalized T-shirts are good examples. Levi's offers cut to fit modularity in its "Levi's Original Spin" custom-made jeans. Paint, fertilizer, and Mexican food are good examples of mix modularity. Bus modularity uses a standard structure that can attach a number of different components. Laptop computers with multi-use ports that can be used to plug in extra batteries, a floppy drive, or a compact disc drive are good examples. The final type of modularity, sectional modularity, provides the greatest amount of flexibility and customization. Standard interfaces are the key to achieving sectional modularity. Legos are the ultimate example. Standard interfaces, sometimes referred to as open architecture, are also the centerpiece of any platform strategy for customization and are part of the reason for the incredible pace of innovation in the computer industry.
1.3 Project Overview
The project began as an attempt to understand the sources of complexity, rework, and flow disruptions in the design teams of the Wire Responsibility Center (WIRC). Production ramp-ups and new customer introductions are known to be the sources of increased complexity and rework in this area. New customer introductions and production increases require additional capacity from design teams and manufacturing groups. There is simply more opportunity for error and miscommunication between design and manufacturing teams during these events. The increased pace of operations during these events exacerbates the rework problem caused by errors and prevents effective continuous improvement. This project studies an initiative launched by the engineering leadership of the WIRC for the purpose of improving the process capabilities between engineering and manufacturing groups in the WIRC.
This initiative, called the Change, Error, and Rework (CER) initiative, is basically a vehicle for imbedding continuous improvement methods in the design teams and processes of the
WIRC. It is currently viewed as a tool for reducing rework in the design teams by
identifying the causes of errors and providing feedback to the design team responsible for them. The thesis contends that this reduction in rework is an opportunity to liberate needed resources for the pursuit of new designs that will enable cost-effective mass customization.
1.4 Related Research
Formalized, cross-functional continuous improvement efforts such as the one described in Chapter 4 can also be thought of as enablers to "concurrent engineering". Fine and Cohen
(1998)15 discuss the attributes and benefits of "three dimensional concurrent engineering"
from a product architecture perspective. The role of modular architecture in product variety deployment is shown by Fujita et al. (1999)16. Meyer and Lehnerd (1997)17 have demonstrated the power of modular product platforms for enabling product variety and cost savings. Henderson and Clark (1990)1" and Sanderson and Uzumeri (1995)19 have also shown how the use of modular product platforms has given companies an edge on the number of products they can offer and on their profitability over competitors.
1.5 Thesis Outline
Chapter 2 provides background information for the company and describes the setting in which the project was initiated. Chapter 3 gives a detailed description of the complex processes and organizational structure of the Wire Responsibility Center. The CER initiative is described in Chapter 4, from its inception through the second iteration. Lessons learned from the events covered in Chapter 4 are then used to develop recommendations, which are presented in Chapter 5. Chapter 6 concludes the thesis by discussing the potential impact of successful implementation of cross-functional continuous improvement methods in other areas of the company.
2 Production Side of Integration to Support Mass Customization
2.1 Company Background, Position, and Outlook
The Boeing Company dominated the commercial aircraft industry for three decades. Its superior technology, world class customer support, and ability to provide customized products propelled the company to a market share of 60% throughout the 80's and into the 90's. Stiff competition from Airbus, however, is threatening Boeing's dominant position in the commercial airplane industry.
Several factors have contributed to this dramatic turnaround. Deregulation of the airline industry created a highly competitive environment for Boeing's biggest customers. Cost is now the main focus of the airlines. With cost of airplane ownership reaching 54% of the total direct costs of operating an airline20, cost reduction has become the predominant
concern for commercial aircraft manufacturers as well.
Stiff price competition from a highly capable international competitor has added significantly to Boeing's need to reduce costs. In 1998, Boeing delivered a record number of airplanes, but made only .5% returns on $58 billion in revenues. Sales were not the
problem - production costs were.
To succeed in this new competitive environment, Boeing must reduce the cost of ownership of new commercial aircraft. This will require major reductions in the cost of designing and manufacturing airplanes. To achieve these significant cost reductions, Boeing must fundamentally re-think the way it configures and produces commercial aircraft. In other words, it must fully embrace and achieve the goal of cost-effective mass customization.
2.1.1 Mass Customization - Progress to Date
BCAG has made significant progress in some areas toward the goal of cost-effective mass
customization, especially on the production side of the business. In an effort to "provide quick response throughout the value chain" (#4 from Table 1), a company-wide Lean Production Initiative has been launched with the full support of a Lean Central Office and
significant organizational infrastructure and visibility. "Make-it-flow" initiatives on the
777 line have led to a 50% reduction in the number of days required to perform final assembly on a 777. Dozens of Kaizen teams are working on projects to reduce part counts and improve the efficiency of production processes. Boeing has retained the services of the Shingi Jutsu Co., a manufacturing consulting firm, to direct and monitor the efforts of employees on various lean production teams.
Continuous improvement is a vital component of any lean strategy. It is also a centerpiece for achieving cost-effective mass customization. Boeing has made significant progress in training its manufacturing workforce on continuous improvement methods and on implementing continuous improvement plans in production. On the engineering side of the house, however, the company has mostly relied on expensive "breakthrough innovations" and new product introductions. Prior to the earnings surprise of 1998, there was insufficient attention paid to design and engineering costs. Continuous improvement is a very powerful tool for cost reduction and is just now beginning to find its way over to the engineering side of BCAG.
The company has also formed cross-functional teams in order to create plans for achieving modularity of components (#5 from Table 1) and creating customizable products (#2). These teams represent a bold new attempt at integrating production and design, which will undoubtedly pay off handsomely in the end, but they haven't had time to implement any of their ideas so far.
The bottom line is that the vast majority of the company's continuous improvement efforts to date have centered on the production side of the business. While this is an important first step, no amount of improvement in manufacturing alone will be enough to achieve the necessary cost reductions. Cost-effective mass customization will only be accomplished with a coordinated effort between manufacturing and engineering.
2.2 The Wire Responsibility Center (WIRC)
The WIRC designs, routes, and installs every wire and wire bundle on every model of airplane Boeing produces. It also fabricates about 70% of the wire bundles that are
installed on Boeing planes. There are hundreds of bundles on every model and up to 100 miles of wire on a 777.
There are hundreds of wire types that carry everything from small signal currents to large power currents for running motors. Some bundles run the entire length of the airplane and have very few connections while others cover short distances and end with dozens of connectors that plug into electrical and avionics equipment.
The WIRC is one of many "responsibility centers" that provide components to Boeing's final assembly plants. Its organization and information flows, which will be covered thoroughly in Chapter 3, are very similar to the structure of other responsibility centers, such as the Wing Responsibility Center (WRC). In this respect, the WIRC is a good representative sample of a typical Boeing design and production organization. It is also a very appropriate place to study the implementation of continuous improvement initiatives in an engineering environment at Boeing.
2.2.1 The WIRC's Position in the Airplane Production Process
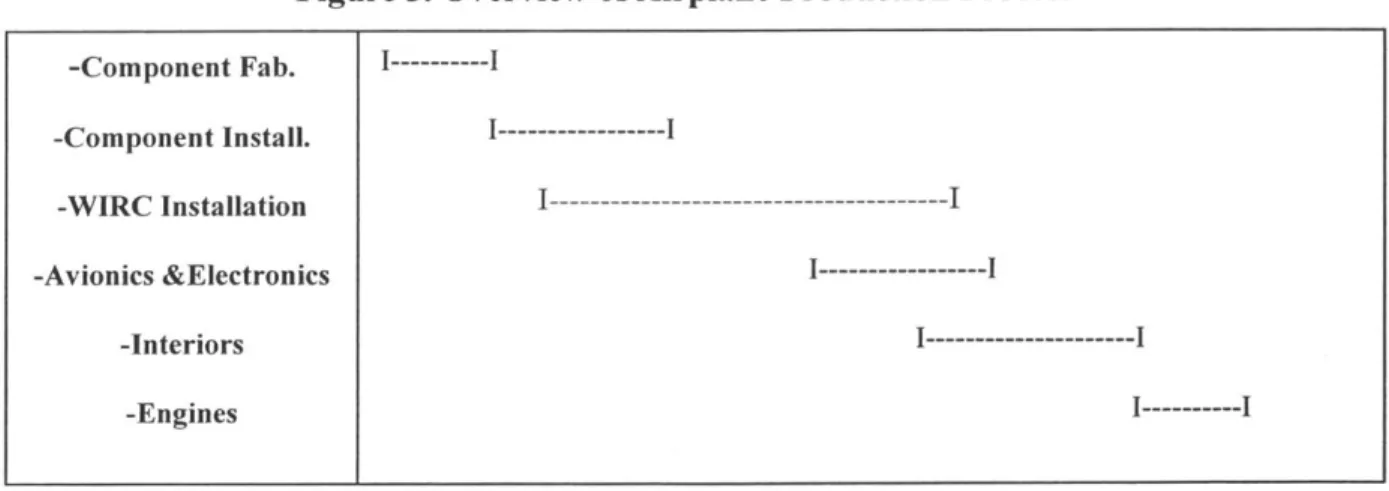
Figure 3 shows how the WIRC fits into the airplane production process.
Figure 3. Overview of Airplane Production Process
-Component Fab. I---I
-Component Install.
---WIRC Installation
I---Avionics &Electronics
I---Interiors I---I
-Engines I---I
This very general representation shows how WIRC installations are performed throughout most of the airplane production process. More detailed diagrams of the WIRC's design team structure and shop floor layout are presented in Chapter 3.
2.3 Unique Aspects of the Wire Responsibility Center
Boeing's strategy of providing customized products results in an enormous amount of customized design work and engineering in all the responsibility centers. The WIRC is uniquely positioned at the end of the whip for most of these changes. This positioning gives the WIRC the distinct honor of being the best place within BCAG to study mass customization.
Nearly every custom design and mid-production design change that BCAG encounters affects the WIRC in some way. For example, upgrades in avionics packages or technology require new combinations and designs of the supporting wiring. Similarly, changes in in-flight entertainment (IFE) options are frequent and also require corresponding design changes in the WIRC.
Even changes that do not involve electronics require design changes in wire bundles. Under Boeing's current system, new bundle drawings and designation numbers are required whenever the length of a wire bundle is changed. If a customer chooses to move a "monument" (a galley or a lavatory, for example), any wiring that was routed to go around the monument must be re-routed. This re-routing affects the length of the wires in these bundles, which requires a new bundle design from the WIRC.
The average wire bundle undergoes 15 design changes prior to installation. The bundle that connects the cockpit to the rest of the airplane averages 80 design changes. These changes dramatically impede the flow of information and output of the design teams in the WIRC.
2.4 Project Focus - Advanced Design Change Notifications (ADCN's) The vast majority of these changes take place prior to any physical handling of wire and only impact the design teams. Changes that occur after wire is cut affect the product flow of the shop in addition to the flow of output from the design teams. For example, if a customer's needs change during production (their marketing data says to add more first-class seats), any bundles that require rerouting as a result of this change would need to be
redesigned. These changes require an Advanced Design Change Notification, known as an
ADCN.
Advanced design changes can be generated for a variety of reasons, such as customer requests. There can be a year or more of lag time between order placement and the end of production of airplanes. New innovations in avionics and electronics occur during this lag time and must be incorporated into the production system. Customers also request new seating arrangements and layouts for galleys and lavatories (called "footprints") in order to differentiate themselves from their competitors.
As will be shown in Chapter 4, a large number of ADCN's are generated internally. As part of Boeing's efforts toward lean production, the WIRC has a system for communicating feedback from the shop to the engineering/design teams in order to enhance DFMA, Design for Manufacturability and Assembly. These "squawks" can lead to the production of an ADCN. Squawks that identify out-of-date reference numbers on design drawings are one example. The focus of this project is ADCN's that are generated in order to resolve errors made internally by the design teams.
Chapter 3 will provide a description of the organizational structures and information flows of the design teams and of the shop floor. This background information will facilitate the discussion of the WIRC's continuous improvement initiative in Chapters 4 -6.
3 Development Side of Integration to Support Mass
Customization
3.1 Overview of WIRC Development Processes
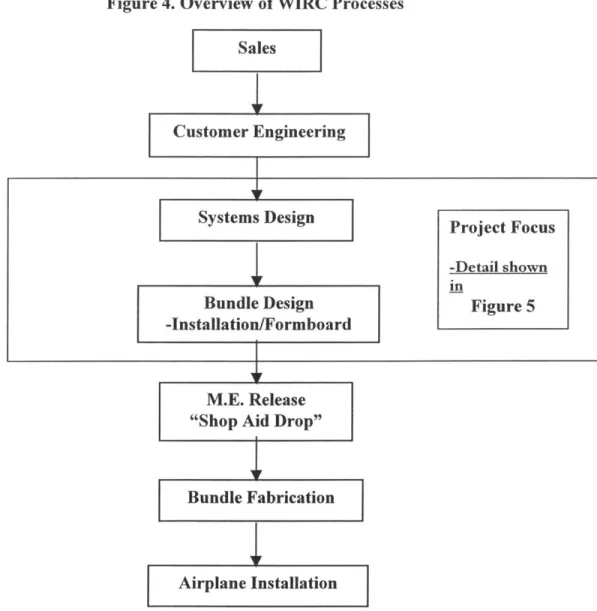
Figure 4 provides a very general overview of information and material flows in the design teams of the Wire Responsibility Center. The figure depicts an ideal scenario, in which design drawings flow smoothly from one area to the next. Figure 5 will show how this complex this straightforward-looking process really is and how changes and feedback from downstream customers can disrupt the process.
Figure 4. Overview of WIRC Processes
Bundle Design -Installation/Formboard Project Focus -Detail shown in Figure 5
Sales and customer engineering work with customers to define the airplane orders and general systems to be designed and produced. This is the product definition stage where seating arrangements (number of first class seats vs. coach and business class) and "footprints", which specify locations of galleys and lavatories, are specified.
Systems Design then takes this information and generates more specific drawings that provide a macro level guideline for integration of the systems ordered. These schematics define the routing and connection points for each bundle, for example.
Systems Design provides 3-D computer-generated designs to the Bundle Design groups. The groups in Bundle Design are responsible for several types of drawings that are used on the WIRC shop floor. These include formboard drawings, attach point drawings, and production illustration drawings.
Formboard drawings are used to specify wire type and length and provide a blueprint for fabrication of the wire bundles (wire bundles are built on large boards called formboards). Attach Point drawings specify how the bundles are to be supported by and attached to the airplane's structural components. Production Illustration (PI) drawings include all the information factory workers need to install the wire bundles in a section of the airplane. Each of these steps is an opportunity for workflow to be interrupted by upstream errors. Systems Design and Bundle Design are the focal areas of the project and are presented in more detail in Figure 5.
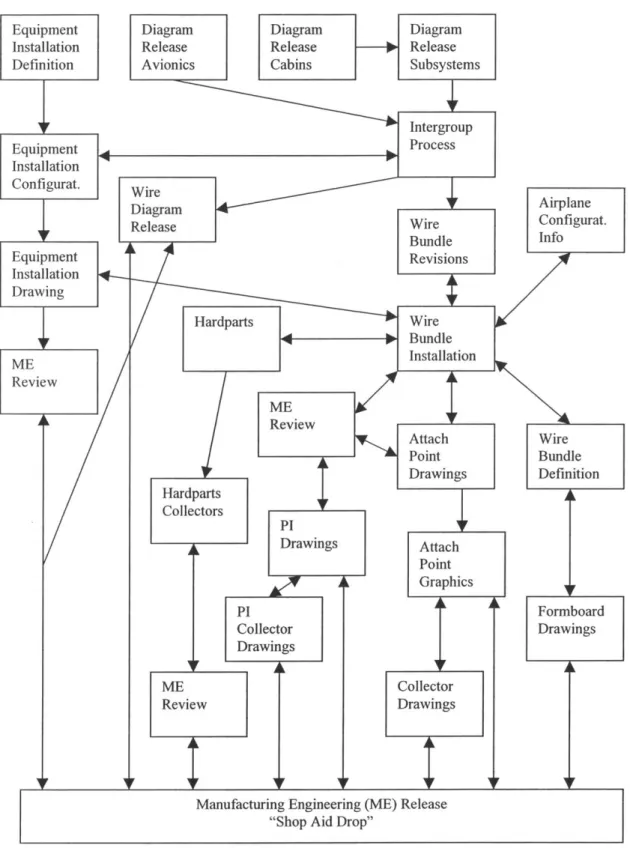
Figure 5 illustrates the degree of complexity involved in designing electrical wiring systems for commercial aircraft22. The figure depicts only the processes from the Systems Design groups (from Figure 4) on the left to M.E. Release "Shop Aid Drop" on the right. This figure, like Figure 4, only shows the optimal situation.
Even in an ideal scenario, the interdependence of the various functional groups and the timing of drawing releases from upstream processes lead to a high degree of iteration within the WIRC design organization. For example, Customer-driven ADCN's are generated in the Systems Design groups, shown as "diagram release - avionics", for example, on the left side of the figure. It must then pass through 12 separate areas, from
"intergroup processes" to "wire bundle revisions" then to all 9 groups between "wire bundle installation" and "ME release".
Figure 5. Engineering and Design Layout and Process Flow
Manufacturing Engineering (ME) Release
Customer-driven changes are especially difficult to incorporate into a process with this degree of interdependence and complexity. Industry cyclicality is especially painful for the design teams in the WIRC due to the complexity of the process as well as the significant amount of training time that is necessary to become proficient within the system. Rework and errors add another layer of complexity and cause further disruptions and more iteration. Any reduction in rework and errors achieved by applying continuous improvement methods to the design organization in Figure 5 would allow the teams to focus on designing modularized components that are necessary for mass customization.
From Bundle Design, the drawings travel to ME (Manufacturing Engineering) Release where they are reviewed for release to the shop floor. This is also referred to as "Shop Aid Drop". Bundle Fabrication follows the release of the drawings to the shop floor and Airplane Installation is the step where wire bundles are actually installed on the airframe.
3.2 Feedback Systems/Interfaces
Providing timely and efficient feedback is also extremely difficult and time-consuming in this organization. The majority of the work is done in sequence with months between completion of tasks. In addition, each step is difficult in and of itself, so very few people are able to provide feedback to members of teams other than their immediate suppliers2 4.
The sheer volume of change that impacts the WIRC due to its unique position at the end of the whip for most design changes also exacerbates the problem. This is especially evident during production ramp-ups (as in 1998), which are difficult to prepare for and very unpredictable.
3.3 WIRC Shop Floor Layout
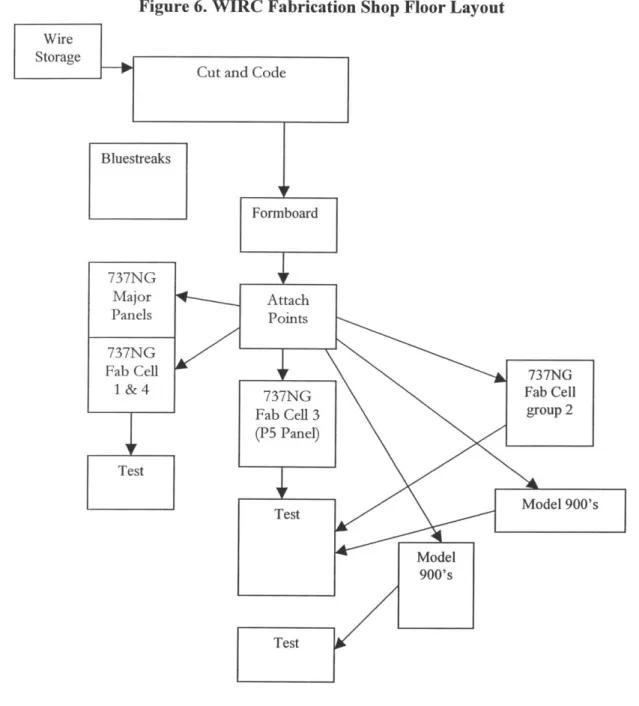
Figure 6 shows a basic layout of the WIRC shop floor25. The common operations in WIRC production are: cut and code, formboard, and attach points. Final assembly and test are performed in separate work cells that are grouped by bundle type. The "model 900" designation, for example, is for complex bundles that connect electronics boxes and power panels to other electric components. The "bluestreak" area is reserved for bundles that require major late-stage design changes and/or extensive rework.
Fabrication begins with "cut and code" on the top of the figure. This is where the properly coded wire is identified, drawn from storage, and cut to length. The "formboard" area is where wire is routed around pegs placed in large boards and grouped into bundles. Attach point hardware (connectors, etc.) is affixed next. From here the bundles go to their family station (737NG group 1,2,3,4, 737NG major panels) for final assembly and testing.
Figure 6. WIRC Fabrication Shop Floor Layout
3.4 The Electrical Corrective Action Team (ECAT)
In response to the drawing interpretation difficulties that were being experienced in the factory, the Electrical Corrective Action Team (ECAT) was set up to provide real-time "ship-side support" to manufacturing teams on the shop floor. The team is comprised of engineers from the design teams. They are on-site in the factory to resolve technical questions, clarify drawings, and answer questions. They also coordinate and direct feedback from the shop to the appropriate design teams.
Currently, documented feedback comes in the form of "shop squawks", as mentioned earlier. Squawks are categorized by defect type and tallied by ECAT in order to identify defect patterns and increase the quality of the drawings released from shop-aid drop. There are four categories of squawks. "F-type" squawks are called "producability squawks" and are provided to help the design team's DFM efforts. The other three types of squawks document drawing errors such as incorrect reference numbers, missing lines or specifications, and missing or mislabeled components (such as connectors).
Squawks that can only be resolved with major re-design work can generate ADCN's. For example, if a wire type or gage was specified incorrectly and improperly incorporated into a bundle, the entire bundle would have to be reprocessed under an ADCN. If there were sufficient time to reproduce the bundle using "normal" processes, the work package would be queued at the beginning of the line at "cut and code". If the job is more urgent, it will be handled as a "bluestreak".
These squawks are the first attempt at formalizing cross-functional continuous improvements between the engineering and manufacturing teams in the WIRC. They provide documented feedback from the production floor to the design teams in order to improve the quality of the output from the design teams and reduce rework, costs, and lead times. Their effectiveness is limited, however, since errors that reach the production floor have already made it through the entire process and possibly caused secondary errors. A formalized system for catching errors as soon as possible would be much more effective. The additional resources that would be liberated by such a system could be used to pursue improved designs that would enable cost-effective mass customization.
4 Analysis of Difficulties in Integration to Support Mass
Customization
4.1 Problem Discovery
BCAG experienced an unprecedented ramp-up in airplane production in 1998 and 1999,
shipping a record of 569 commercial airplanes in 1998 and another record 620 planes in
1999. The WIRC, with its complex, iterative processes and unique position at the end of
the change whip, became one of the bottleneck processes in commercial airplane production, with lead times between six months and a year26. The organization was able to settle in to the increased pace by Q2 of 1999, and its leadership was able to begin searching for opportunities to cut costs and improve performance.
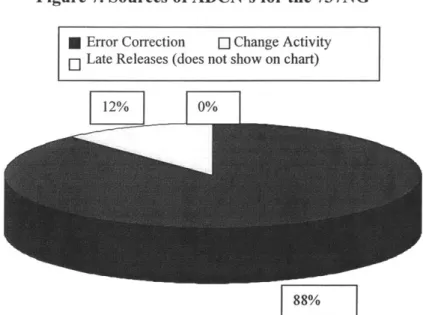
Figure 7 shows the results of an inquiry by the WIRC leadership team into the causes of ADCN's for the 737NG-model airplane. It shows that 88% of the ADCN's for a given airplane were, on average, caused by errors in the documents delivered to production. Only
12% were due to customer changes. Late releases were insignificant.
Figure 7. Sources of ADCN's for the 737NG* * Error Correction [ Change Activity
Late Releases (does not show on chart)
88%
The results shown in Figure 7 were a surprise for the leadership of the WIRC design teams. The entire organization expected these results to show customer-driven change activity as the clearly dominant cause of ADCN's.
The data shown in Figure 7 was extracted from a database used to track ADCN's. As is explained in Appendix 1, ADCN's that affect multiple bundles are recorded in multiple places and were counted multiple times. The number of ADCN's resulting from errors is slightly exaggerated as a result of the data extraction method used, but the discovery of errors being a greater cause of ADCN's than change activity is still valid.
4.2 The Change, Error, and Rework (CER) Initiative
As a result of this discovery, the Change, Error, and Rework (CER) Initiative was launched in June of 1999 for the purpose of reducing the number of errors being generated in the Production Illustration (PI) design groups of the WIRC. Recall from Figure 5 that Production Illustration (PI) drawings include all the information factory workers need to install the wire bundles in a section of the airplane.
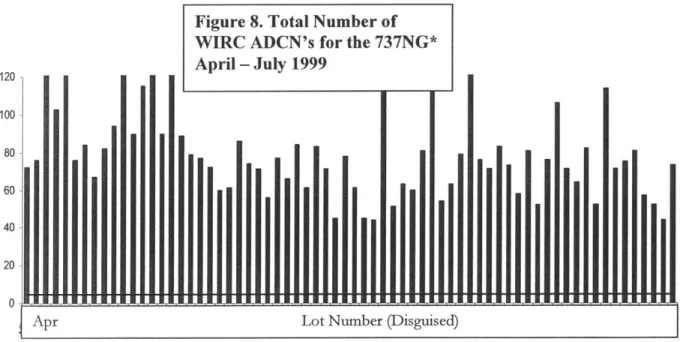
Figure 8 shows the total number of WIRC ADCN's after shop-aid drop for the 737NG model from April through June 1999. As the figure shows, the average number of ADCN's per airframe is roughly 70.
Figure 8. Total Number of WIRC ADCN's for the 737NG*
120 April - July 1999 100
80
.1I
l
i
o||l 40 20 0'11111
z (3 C 0 CEl
The purpose of this chart is to show the average number of ADCN's that were being generated by the WIRC on the 737NG model airplane prior to the implementation of the CER Initiative. As will be shown in Figure 11, significant improvements in the number of ADCN's being generated by the WIRC were achieved simply by monitoring the output of the design teams in Production Illustration and providing feedback to their upstream suppliers in order to improve the output of the entire design team of the WIRC.
The data shown in Figure 8 is a simple tally of WIRC-generated ADCN's per airplane. All changes in design and production procedures of airplanes must be documented and sent to the customer upon delivery. These changes are stored in a database that represents the work package for the airplane affected. Each work center in Boeing has its own reference number which it uses to record each ADCN it generates.
The variability shown in Figure 8 is known to have several causes such as increased production rates and new customer introductions. There is simply more opportunity for error when designing new products and producing more products. Even during level production on well-known products, however, there are still 40-50 ADCN's being generated by the WIRC per airplane. Since roughly 88% of those are caused by errors as shown in Figure 7, an effective program for eliminating errors could have a significant impact on the design and production costs of the WIRC.
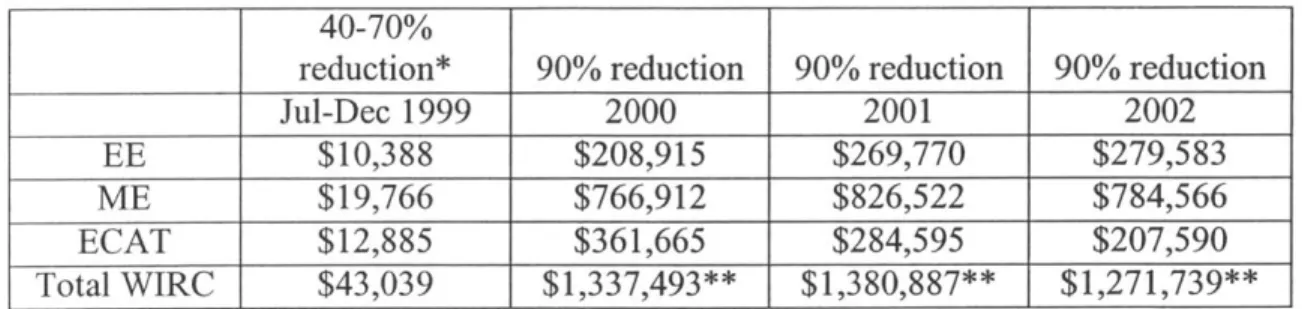
4.2.1 Cost Impact of Errors
The cost implications of these errors are enormous and are shown in Table 227. These figures were obtained by estimating the impact of reworking a drawing at 1.5 hours per reworked drawing and then multiplying that number by the design groups' run rate (costs of operation).
These cost estimates, while significant, do not include the lost opportunity costs caused by these errors. The flow disruption of these errors alone increases the lead times for getting products to the customer. Rework also causes confusion in estimating component costs and production costs for individual airplanes accurately, which has also been a huge
problem for Boeing in recent years. Feedback and continuous improvement are hindered when ECAT members are constantly fixing and documenting errors.
Table 2. Estimated Cost Savings From Reduction in WIRC ADCN's 737NG Program
40-70%
reduction* 90% reduction 90% reduction 90% reduction
Jul-Dec 1999 2000 2001 2002
EE $10,388 $208,915 $269,770 $279,583
ME $19,766 $766,912 $826,522 $784,566
ECAT $12,885 $361,665 $284,595 $207,590
Total WIRC $43,039 $1,337,493** $1,380,887** $1,271,739**
* First year of inception. Numbers shown in this column are actuals through October 1999. ** Figures in these columns increase or decrease due to projected sales and sales mix.
Eliminating these errors by formalizing a method for cross-functional continuous improvement between engineering and production would also allow the WIRC to pursue the ideal goal of mass customization.
4.3 The First Iteration
The CER team's first step in their effort to reduce the number of ADCN's caused by design errors was to categorize the errors. When an error is found on the shop floor or in an upstream process, a member of the CER initiative records the cause of the error. This data is then used to generate feedback to the designers. Figure 9 is an example of a CER
initiative feedback form28. It shows the errors generated by one illustrator over a period of
one month.
The graph also serves as a pareto diagram and highlights the most recurrent errors. The WIRC used this data to identify problem areas within the design teams in an attempt to increase the number of error free drawings being released to the shop floor.
This first attempt simply identified all errors in order to get a handle on the types of errors that were occurring. Some of the errors, such as Rev. Block, Title Block, and Text Size are more administrative in nature and have more impact on the design side of the WIRC than on the manufacturing side. These errors create problems in matching design drawings to
than errors involving actual design flaws. The Rev and Title Block errors, for example, are new and are part of an effort to reuse design drawings. The classification system employed
by this drawing reuse effort is extremely complex, but there is enormous cost saving
potential in being able to reuse design drawings. These errors are expected to decline as the designers gain more experience with the classification system.
Figure 9. Sample CER Initiative Error Type Feedback Form
Error Count 16% .... 14% () 12% 10% 8% 0-1- 6% -0 4%-2% 0%
-misin parts ormssn or inoretgomti spcfiaios Thes eror ar( mr
0 0 -M~ M' 'D) F3 Fn 0 (U0 0 - 01 ) Z C 0 o . R ~~ -0 0 . E cc 1 . . :~(0u, 0 10 C 0 0~~ W ~w~0
cope-ncrqiemr exeine tannanUkl o lmnt thn thr 0or
o: LL U C E > 0 n 2 E 0 Error Type
Other errors, such as Callouts, Geometry, and View, involve actual design flaws such as missing parts or missing or incorrect geometric specifications. These errors are more complex and require more experience, training, and skill to eliminate than other more administrative errors. These issues will be discussed further in Chapter 5.
4.3.1 Initial Results
The discovery of design errors as the leading cause of self-induced rework and subsequent focus on error feedback by the CER team had an immediate and dramatic impact on the quality of the WIRC's drawings. Figure 1017 shows the step increase in the percentage of
error free drawings in the month of July, 1999, which was the first month after the WIRC design teams received their packaged feedback from the CER team.
Figure 10. Percent of Error Free Drawings
% Error Free Drawings
80% 70%
60% _
50% -- Actual % Error Free
40% % o Drawings
-u-*Projected % Error Free
30% Drawings
20% 10% 0%
June Jul Aug Sep Oct Nov Dec
The projected line is the target set by the leadership of the WIRC design teams. The was calculated by members of the CER team. The percentage of error free drawings determined by designating each drawing with no errors as error free, and dividing number by the total number of drawings produced that month.
data was that
As the graph shows, the WIRC's percentage of error free drawings more than doubled in July. Since the initial focus of the CER initiative was to reduce the number of ADCN's caused by drawing errors, it was then necessary to determine whether the increase in error free drawings actually translated into a reduction of ADCN's. Figure 11 was generated using the same methods that were used to generate Figure 8.
Figure 11 is a continuation of Figure 8 and shows the total number of ADCN's per airframe from the beginning of the CER initiative in July through Dec. 1999.
Figure 11. Total Number of WIRC ADCN's for the 737NG, July - Oct 1999
120 -CER Initiative 100 - - Launched 80 - -40 2040
Jul Lot Number (Disgised)
As the graph shows, the number of ADCN's per airplane was reduced from an average of
70 to an average of approximately 20 immediately following the first iteration of the CER
initiative. This 70% reduction in ADCN's was achieved by formalizing a continuous improvement methodology between the manufacturing and design teams of the WIRC.
4.3.2 The Rest of the Story
A surprising discovery was made upon investigating the impact of the CER initiative on the
shop floor. Minimal impact was expected initially since the first step of the process was to clear up the clutter of rework on the design side of the equation in order to get a clearer picture of the root causes of errors and design rework. Negative impact on the shop floor was not expected, however. In its zeal to reduce the total number of ADCN's on the 737, the CER team also eliminated the F-type squawks and ADCN's that provide DFM feedback from the shop to the design teams. This caused some concern and negatively affected the CER initiative's image in the eyes of employees on the manufacturing side of
the WIRC.
Eliminating the overall clutter caused by all types of ADCN's was a sound strategy, but the strategy was not communicated properly to ECAT or to the shop floor. If the elimination
of producability ADCN's had been communicated as a temporary event with the long term goal of improving the percentage of error free drawings sent from the design teams to manufacturing, the transition would have been better received and supported in the shop.
4.3.3 Lessons Learned
There were also some concerns in the design teams around the analysis of data on the sources of errors. Designers were concerned that their career evaluations would be unfairly affected by the new error performance measurements. One concern revolved around differences in complexity between the designs of some wire bundles versus others. Another similar concern centered on complexity differences between these design changes.
These concerns were addressed by the addition of simple quality, quantity, and complexity indices to the CER feedback forms. The indices compare each individual illustrator's performance to the overall performance of the team. Members of the CER team assign complexity values to each drawing based on the size and scope of the design job. These complexity scores range from 1-5. The complexity index comparison values are simply the result of adding up each complexity score and dividing by the total number of drawings scored. The quantity index is a comparison of each illustrator's output to the average output of the team members, by sheer number of drawings produced. The quality index is the number of errors per drawing produced.
Figure 12 shows an example of the complexity index and individual to team comparisons on a new and improved CER feedback form.
The addition of these comparison indices, along with assurances from management that the data collected from CER would primarily be used for team-based continuous improvement efforts and not for individual performance evaluations, alleviated the tension that can be associated with receiving individual performance feedback.
Figure 12. Sample of Improved CER Feedback Form
4.3.4 Next Steps
The CER team must continue to pursue the continuous improvement process it has begun under the CER initiative. It has achieved a doubling in the percentage of error free drawings simply by monitoring errors and providing feedback to the design teams. Looking back at Figure 10, however, will show that there is still room for improvement.
As the figure shows, the WIRC error free drawing percentage has stabilized in the 40-50% range since the initial step improvement seen in July. Achieving the stated short-term goal of 70% and the long-term goal of 100% will require further improvements in the CER process. Reintroducing the producability ADCN's that were put on hold will aid the WIRC's efforts to reduce errors by reopening the lines of communication between the design teams and the shop floor.
The additional design team capacity that has been realized by reducing the clutter and rework caused by errors and miscommunication can now be put to work improving the CER process. The complexity indices are an example of an improvement to the process
Quantity Index 25 23 20 17 15 10 Illustrator Team Quality Index 0.8 0.67 0.6 0.47 0.4 u 0.2- 0-Ilustrator Team Complexity Index 3.4 3.3 3.2 3 2.8 2.8 2.4 Ilustrator Team
that requires additional time but can now be accomplished since the extra time has been made available by reducing rework caused by errors. The more experienced designers can devote more of their time to training and developing new ways to eliminate or detect errors at their source. Designers can spend more time understanding their customers' needs and processes in order to find new ways to eliminate errors caused by miscommunication or misunderstanding.
The continuous improvement cycle that was launched by the CER initiative has enormous potential for cost savings in the WIRC, as shown in Table 2. The CER initiative is also a great opportunity to formalize tighter working relationships between the design teams and manufacturing teams of the WIRC. If used for the purpose of realizing efficiency gains in the relationship between design and manufacturing, it also has tremendous potential for enabling the WIRC to achieve the ultimate goal of cost effective mass customization.
5 Solution to the Difficulties of Integration to Support Mass
Customization
5.1 Short Term Opportunities
The additional design team capacity realized through the continuous improvement process of the CER initiative can be used to accomplish significant improvements in the efficiency, productivity, cost performance, flexibility, and quality of the entire WIRC.
5.1.1 Integration of Thinking and Doing
As the WIRC design teams become more comfortable with receiving and incorporating feedback, the CER team can focus its efforts on eliminating the problems that have the greatest impact on the shop floor. As mentioned in section 4.3.2, the negative impact of temporarily eliminating producability ADCN's created some concern among ECAT members on the shop floor. Once the shop experiences a reduction in drawing errors and ADCN's, the WIRC will have the opportunity to better integrate the efforts of its design teams with its manufacturing teams.
Once the WIRC gets a handle on the situation by eliminating the errors that are easily fixed, it could begin to regroup errors according to impact/cost. The CER team could categorize errors by the amount of disruption they cause to each functional group in the WIRC. Errors could first be categorized as Administrative or Technical. This could help identify the source of new errors more quickly. For example, if a new classification system for reusing drawings is initiated and the number of administrative errors spikes, the CER team could immediately identify the new classification system as the source.
Since total WIRC engineering costs are 150% of WIRC shop floor costs , errors that affect the design teams will generally have greater cost impact than errors that affect the floor. Communicating this fact and the overall goal of the CER process to the shop would allow the members of manufacturing teams to understand why the CER initiative must concentrate on errors that affect the design side first. The shop will also be better able to communicate which errors impact it the most. Errors that cause major disruptions in the
shop (called "Bluestreaks") would be targeted for elimination before errors that have limited effect. For example, more emphasis should be placed on errors that result in cutting the wrong type of wire or cutting the wrong length of wire, such as missing geometry or bad reference numbers, than on errors such as text size which have little or no effect on the costs of the WIRC.
5.2 Long Term Possibilities
The clarity of a stable process provided by the CER initiative has enormous potential to improve the way work is accomplished in the WIRC. One intriguing possibility is the attachment of financial incentives to future improvements in cost reduction or productivity achieved by the functional teams of the WIRC, the WIRC as a whole, or a combination of both.
The complexity index could be modified and used as a classification system to classify wire bundles according to complexity. This would allow the members of the WIRC design teams the opportunity to pinpoint troublesome bundles. The design teams would then be able to anticipate flow problems caused by bottleneck bundles and make arrangements to handle them separately. One possibility would be to reorganize the teams around the complexity classification system. Designers with more experience, expertise, or a stronger desire to challenge themselves by solving complex problems could be assigned to the teams that handle these problem bundles. Designers with less experience, less training, or a strong affinity for volume production would be assigned to teams that crank out more routine product.
Another possibility for realigning the workforce would be to classify bundles according to their change history. Bundles that have a track record for late-stage changes could be identified and handled by team members who enjoy the challenge of fast-paced change and are better able to deliver in that environment. This knowledge on bundle change history could also be used to identify which bundles are the most important to customers. A special process or team could handle bundles that serve important features that tend to change in late stages of the production process. These bundles could be targeted as