AIR NEW ENGLAND (1970-1974)
A Case Study of a
Commuter Air Carrier
Raymond A. Ausrotas
Terry P. Blumer
October 1975
FTL Report R-75-9
AIR NEW ENGLAND (1970-1974)
A Case Study
of a
Commuter Air Carrier
Raymond A. Ausrotas
Terry P. Blumer October 1975
Flight Transportation Laboratory Massachusetts Institute of Technology
Cambridge, Mass. 02139
Table of Contents
1. Industry Background ... 1
2. Chronological History of Air New England ... 12
3. Evolution of Route Structure, Fare Policy and Competitive Position ....16
4. Aircraft Fleet, Traffic and Financial Status...46
5. Summary ... 61 -domin INNIIIIN ii lik I iii I w wiiii dMI1111 IWI wk i0im I I. , , 1111,11 IIIHIII IN&
Acknowledgement
This study was sponsored by the Department of Transportation. The authors would like to acknowledge the
helpful assistance of Mr. James J. Gansle of the Industry Analysis Division, Department of Transportation.
1
1. INDUSTRY BACKGROUND
Commuter air carriers operate under Part 298 of the Civil Aero-nautics Board's Economic Regulations as a sub-classification of air
taxi operators. Commuters perform at least five round trips per week between two or
more points pursuant to published flight schedules, or transport mail under contract with the U.S. Postal Service. They are currently
allowed to operate aircraft with a maximum passenger capacity of 30 seats and a maximum payload capacity of up to 7,500 pounds. Apart from
these aircraft capacity limitations, the CAB imposes almost no regulatory controls over commuter carriers: there is complete freedom of entry and exit from markets, and no rate or route control. Part 298 regulations, however, do require that commuter carriers register with the CAB, report certain operating and traffic statistics, carry a specified level of liability insurance and waive liability limits under the Warsaw Convention. The commuters are also
subject to varying degrees of safety and operational regulations of the Federal Aviation Administration, depending on the type of equipment that they operate.
In addition to the limited regulation at the federal level, in recent years some states have exercised varying degrees of regulation of the com-muter air carriers which operate within their jurisdiction. State regulation
has tended to be far more extensive than federal regulation and has often in-cluded entry and exit controls, and rate/reporting regulations. In some more heavily regulated states, state regulation has sometimes included specification of a minimum number of flights; specification on aircraft size which differs
from that allowed by Part 298; route certificates; carrier justification for
2
beginning or suspending servicein a market, denied boarding regulations and a number of other provisions. The following of the 48 contiguous states have enacted some degree of commuter regulation: Alabama, Arizona, Arkansas, California, Colorado, Florida, Idaho, Illinois, Montana, Nebraska, Nevada, North Dakota, Pennsylvania, Tennessee, Texas, Utah, Vermont, Virginia, Washington, and Wyoming.*
Commuter air carriers are an increasingly important component of the
national air transportation sytem. This is evident form the growth in commuter route networks form 1966 to 1974, shown in Figures I-1 and 1-2, to the point where it is possible to cross the country using commuters.
Commuter air carrier traffic has grown rapidly since 1964 with traffic more than doubling in the successive years 1968 and 1969. The number of com-muter type operators, however, has fluctuated during the period. This is shown in Table I-1. In addition to the variation over time within the industry, the
current size of commuters vari-es from those which carried fewer than 5,000 passengers in 1973 to those which carried more than 200,000 passengers, or about 800 passen-gers a day.**
In addition to the generally favorable climate at the CAB the late sixties saw the development of two lightweight twin-engine turbine powered aircraft that were almost ideally suited for larger commuter operations: the
DeHavilland of Canada DHC-6 Twin Otter and the Beech Aircraft B-99. This was a case of technology practically creating a market: in the quarter ended December 31, 1973, 171 of these aircraft were in service out of a total of 210 *
National Air Transportation Conferences, 1971
**NATA Commuter Airline Assocation, The Commuter Airline Industry, Annual
FIGURE I-i'
SC-DvL.E AIR TAXI IOUTES *
NOVEMBER 1966 - -'.' A H 1W%1 "' t ORIC01 *A -4 CA;- CARLIN ARI20%A KNA KI- N' aw AsC a.,.~~~SUT ... R-...IN"vii r.AMV -ERI iaM.-SISSI.P. 0....T"'"* -OUISI.. ALA... 50019 DAFLAR-D--HCPW5YIVI .. 10.VA ~h - ,Icae.
FIGURE 1-2
COAM1 UTER AIR CARRIER
ROUTES
SEPTEMBER 1974
PASSENGER /CARGO /MAIL*
WA. vfl 0-k. "%v X -: ft * o.. - *
tip
11
71A"'0 ~ tN! 0%sw- _A!;le''o ~pt V.901,I~LAOc ~ W k . AN't.
a"C
J
a.- TOAL.;. 0El
turbine powered aircraft operated by the commuters. Table 1-2 shows the pattern of growth of the commuter air carrier industry fleet from 1965. It can be seen that the growth of traffic has been met by an expansion of the larger aircraft classes, rather than an overall increase in number of aircraft.
Table 1-3 presents various statistics which show the current role of the commuter airline industry in the air transportation system of the United States. An average trip length of 100 miles indicates the short-haul character of commuter service. Although commuters basically connect
passengers to other certificated carrier flights, origin and destination-type passengers also exist. Commuters now constitute over 3% of the total U.S. domestic passenger market, while providing passenger service at about
half the airports that receive scheduled service. Furthermore, commuters offer the only scheduled passenger flights at about half the cities they serve; these exclusive points tend to be small, low density communities at which commuters can provide the only economical air service.
An analysis of 1974 data shows that there were over 665 airports in
the 50 states served by 30 certificated carriers and 131 commuter carriers. Of
these, 256 or 38.5 percent were served solely by the certificated carriers, 210 or 31.6 percent were served jointly by both groups of carriers. The
analysis further shows that in serving the 409 airports, the commuters provided
service in over 1,700 city-pairs by connecting with certificated carriers.* Table 1-4 shows the distribution of service by the numberofcarriers in the 665 airports served by the commuters.
*NATA Commuter Airline Association, Commuter Airlines, Report Number 3,
Replacement began on July 17, 1967, when Apache, a scheduled air taxi, was authorized by the CAB to provide substitute service for American Airlines at Douglas, Arizona.* Thereafter suspension of certificated carrier opera-tions at marginal points in favor of commuter carriers became a part of
CAB policy. As of January 1975, replacement service was in effect at forty-nine points, forty seven for local service carriers and two for trunkline carriers.
In many cases applications for suspension/substitution have involved a
service agreement between the commuter and the certificated carrier. The nature of the agreements has varied, but the most comprehensive have been those contracted under the "Allegheny Commuter" program.** Subject to CAB
approval, Allegheny has selected its commuters, awarded them ten-year
con-tracts, and guaranteed a breakeven financial result during the first two
years through subsidy. Carriers so chosen go by the name "Allegheny Commuter," painting their aircraft in Allegheny colors and offering joint fares. Allegheny provides its computerized reservation service, interline ticketing and
baggage handling, and includes the complete schedules of the commuters in its own timetable. In return Allegheny requires that the commuter carry the same level of liability insurance as it does itself, that flights have a uni-formed captain and first officer, and operations have a 95% completion fac-tor. (An interesting sidelight to Allegheny Commuter traffic statistics is *
CAB Report to Congress, Fiscal 1968, p.119.
**CAB Bureau of Operating Rights Staff Study, Service to Small Communities:
Part 2 (March, 1972), p. 35-38.
that because the tickets are written on Allegheny stock, this commuter traffic appears in the CAB O-D statistics as Allegheny traffic).
Closely related to the issue of substitution of commuters for certifi-cated service is the issue of subsidy. Some of the routes where commuters re-placed certificated carriers had been served on a subsidy basis. The need for air service to isolated communities and the difficulties in providing that service gave rise to both the CAB's Competitive Bid Proposal and to the Flow-Through Subsidy alternative. Although the former remained a proposal the latter was implemented in 1974 by allowing Air Midwest to receive flow-through subsidy as a replacement for service by Frontier Airlines. Air Mid-west received $132,000 annually in flow-through subsidy until the U.S. Appeals Court said the Board could not subsidize an air carrier which is not certifi-cated. To insure service to communities for which it had received subsidy, Air Midwest has requested the CAB for a temporary certificate.* Cochise Airlines is expected to follow suit.**
At the time that Air New England began operations in late 1970, the com-muter air carrier industry was relatively stable; the technology of small
aircraft had advanced to the point where the appropriately sized aircraft (B-99, Twin Otter which had proven acceptable to the travelling public) existed to serve markets of medium size; and the regulatory environment was such as to allow competition to take place in the commuter markets.
* Aviation Daily, Vol. 221, No.3, (Sept. 4, 1975), p.17 1. **Aviation Daily, Vol. 221, No. 7, (Sept. 10, 1975), p.52.
Table 1-1
Commuter Industry Traffic Growth*
Year Number of Passengers Number of Operators
1964 199,000 32 1965 223,000 82 1966 328,000 116 1967 553,000 165 1968 725,000 240 1969 1,800,000 153 1970 4,300,000 -183 1971 4,700,000 161 1972 5,200,000 184 1973 5,700,000 216 1974 6,800',000 213
TABLE 1-2
COMMUTER AIR CARRIER FLEET
(by Aircraft Type)*
Aircraft Type Year 1965 1966 1967 1968 1969 1970 1971 1972 1973 1974 Fixed Wing Jet 7 Turboprop 1 4 22 118 200 187 175 171 191 216 Single-engine Piston '105 150 200 318 141 124 103 94 125 169 Multi-engine Piston 249 348 452 814 515 424 459 455 504 550
Helicopters
6
7
9
18
8
6
6
23
8
2
TOTAL 361 570 685 1272 864 741 743 751 8451982
Sources: (1) Commuter Air Carrier Operators as of Sept.,1969,
(2) Commuter Air Carrier
(3) Commuter Air Carrier June 30,
Operators as of Sept.,1972,
Traffic Statistics,
1973, CAB
(4) Commuter Air Carrier Traffic Statistics, June 30, 1974, CAB FAA FAA Year Ended Year Ended MIX
Table 1-3
Comparison of Domestic Trunk Airlines, Local Service Airlines and Commuter Air Carriers* (Year ended December 31, 1973)
Passengers
(000)
Revenue Pas. Miles (000)
Departures Ave. Passenger
(000) Trip Lenqth (m) Domestic Trunk Airlines 144,800 115,400,000 3,020 797 10 204 Local Service Airlines 32,450 9,827,000 1,527 303 8 412 Commuter Air Carriers 5,690 576,000 925 101 216 550
*Source: CAB statistics
Number of Carriers
Airports Served
urnI
11
Table 1-4
Distribution of Service By Number of Commuter Air Carriers*
Number of Commuters Number of Airports Percent of Airports
365 131 10 or more 30 665 54.9 19.7 9.2 4.1 1.6 3.2 0.6 1.6 0.6 4.5 100.0%
Source: NATA Commuter Airline Association, Commuter Airlines, Report Number 3, July 1975, p.34.
2. CHRONOLOGICAL HISTORY OF AIR NEW ENGLAND
Summer 1970 - Policy disagreements at Executive Airlines between Walter Beinecke, majority stockholder, and Joe Whitney, President
since 1962 (when the airline began operations), lead to
de-parture of Whitney and others at Executive. During 1970 Executive grosses $8 million and has deficit of $4 million.
Fall 1970 - Whitney and some associates join forces with George Parmenter (formerly founder & president of bankrupt Cape & Island Air-lines) to form Air New England and begin operations on the Cape and Island routes.
December 31, New England Service Investigation (Docket 22973) begins.
1970
December 10,- Executive Airlines files for bankruptcy under Chapter 11 of
1971 the Bankruptcy Act, reorganizingits New England operations and
totally dropping its Florida operations.
February 9, - Beinecke relinquishes control of Executive Airlines to group
1972 headed by Henry Harding.
July, 1972 - Associated New England Airlines, a loose conglomerate of six commuters (Air New England, Aroostook Airways, Bar Har-bor Airways, Command Airways, Downeast Airlines, and Win-nipesaukee Aviation) files a plan with the CAB to receive subsidy eligible certificates for specific points. Air New England proposes service on the following routes with a fleet of 5 DC-3's, 5 F-27's and 5 DHC-6's: (1) Boston-Hyannis-Martha's Vineyard-Nantucket; (2) New York-New Bedford-Martha's Vineyard-Nantucket-Hyannis; (3)
Boston-Lebanon-Montpelier-Burlington; (4) New York-Lebanon-Montpelier-Bur-lington-Portland; (5) Boston-Augusta-Waterville; and (6)
August, 1972-November 1, -1972 December 4, -1972 December 5, -1972 December 20,-1972 July 9, 1973-13
New York-Portland-Augusta. For this operation, Air New England
forecasts revenues of $8.29 million in 1973 with an operating loss
of $233,548. The company anticipates it will require $679,798 in subsidy during the year to undertake the proposed operations.
Executive Airlines also files for subsidy eligible certifi-cation for a somewhat larger route structure, using six
CV-580's and five DHC-6's. Total subsidy need is estimated at $721,000 annually.
Northeast Airlines is merged into Delta Air Lines.
Executive Airlines emerges from bankruptcy following a stringent cost reduction program and layoff of about
75% of personnel.
CAB's Bureau of Operating Rights opposes certification of
any commuters in New England.
Executive Airlines asks CAB to prohibit commuters from starting new services at markets in question in New
Eng-land until the New EngEng-land Service Investigation is completed. Fol-lowing announcement of plans by Air New England, Executive said: "The schedules and fares proposed by Air New.England
cons-titute a flagrant case of predatory and destructive com-petitive practices designed to drive Executive out of business..."
Air New England adds Burlington, Vt., Barre/Montpelier, Vt. and Lebanon, N.H. to its route system.
In the initial decision in the New England Service Investigation,
CAB Administrative Law Judge Murphy says that commuters can
provide adequate service in New England without certification.
December 19,- Executive Airlines goes out of business effective
Dec-1973 ember 21. Air New England purchases some of its assets and says it will try to fill any service void created by Executive's departure.
July 17, - The Civil Aeronautics Board, in a unanimous decision in the
1974 New England Service Investigation, certificates Air New England effective October 15, 1974. Joe Whitney tells
Aviation Daily: "We anticipate our subsidy need to be zero. We are having a very successful year and should be extremely profitable. We see no reason to drastically change that just because of the CAB order. We have been looking at fleet
improvements mainly under Part 298(small aircraft) require-ments. Now, of course, we will be reviewing our fleet as a local service carrier. We don't intend to go out and buy airplanes because we are eligible for subsidy. We would rather stay in the profit column." Whitney says Air New England expects 110% revenue growth to about $9 million, compared to 1973 revenues of $4.6 million.
July 19, - Quoted in Aviation Daily, Sen. Norris Cotton (R-N.H.), views the
1974 CAB decision "as a personal victory in a very long, arduous and difficult struggle." Cotton says the Board's decision is not far removed from what he had realistically hoped for. Cotton, perhaps one of most vocal critics of CAB, compliments the Board for its show of backbone by disagreeing with portions of the law judge's decision, the position taken by the Bureau
of Operating Rights "and much to my own self-gratification, the position of the Department of Transportation."
Cotton expressed his pleasure with the CAB decision during senate aviation subcommittee confirmation hearings yesterday for CAB Member Richard J.O'Melia and credited O'Melia with
October 11, -1974 November 12,-1974 December 2, -1974 December 23,-1974 January 21, -1975 January 24, -1975 15
playing a large part in the Board's decision. When O'Melia was first appointed to the Board, he personally
"traveled through the northern New England region receiving
first-hand knowledge of our air service problem. This I am sure, was helpful to the Board in reaching its decision...," Cotton said.
CAB agrees to an Air New England petition delaying
certifi-cation to January 1, 1975.
Air New England announces plans to buy all six FH-227's of Delta Air Lines.
Air New England petitions to keep operating as a Part 298 carrier until it is qualified for FAA licencing as a certi-ficated airline. On December 20, the CAB agrees.
Air New England orders six SD 3-30's for delivery in February
1976. Aircraft are valued at $1.25 million each.
Delta Air Lines and Air New England ask CAB to approve a loan of $1.5 million from Delta to Air New England.
Air New England certificate of public convenience and necessity takes effect.
3. EVOLUTION OF ROUTE STRUCTURE, FARE POLICY AND COMPETITIVE POSITION
The growth of Air New England's route structure, fare structure, and competitive position was analyzed for the four year period of its existence as a commuter, December 1970 - December 1974. The analysis is based upon data derived from the Official Airline Guide (OAG).
The analysis is split into nine periods, the Decembers and Junes
corresponding to the low and peak periods of traffic in the Northeast. For each period, Air New England's route structure, fare structure, and competi-tive position is discussed. A tenth section summarizes the key events and strategies in Air New England's history as a commuter air carrier.
1. December 1970
Air New England began operations serving eight cities on a sparsely connected network stretching from New York to Waterville, Maine (Figure 3-1). The network was composed of two markets, one in the Islands* and the
other in the North.* The Northern market was more highly connected, but the Islands received greater frequencies of service, so that overall the two markets were given equal attention.
There was considerable competition in New England at the time (Table
3-1). Executive Airlines, the dominant commuter carrier, had extensive routes
throughout the area, and competed with Air New England on nearly every route the new carrier flew. Northeast Airlines, a regional carrier, flew routes
in and out of New York, and between Boston and Portland, Maine. Small *Nantucket, Martha's Vineyard, Hyannis and New Bedford.
--K
F/GII2E 3i.
Rle
/240/JTD//7?RRM,
NE/V
EV6 fND
DECftEER
/170
.1
(
/
-__
* Ii IIMIIWIIIIIM N 11 Ili III IJ 1 11111
RCK - NNTCKET M17.
RL16 -/7&1S 77 ME,
B05-105TO /W. 13T1V- 3URUN?1tO/V Y
EWB3- NEW 8EDFORD 47.
Y Y/7- HYRN/1V/S /W.
L17,6-LE0/7//91OA/ N.#Il
LEIF-/EANIS TON AE..
L G/7- ZR U1R/RD/w/7 ?I I MPV -'O'VPELI/ER VT
MVY- /1RRTH'5
VINEYRD 111.
)Pb/7- POR TLRAD /IE.
commuter competitors included Downeast Airlines, Aroostook Airways, and Massachusetts Air Industries, each serving a single market.
Air New England originally set its fares equal to Executive's and matched or underpriced its competitors in other markets.* An exception was New York, where Air New England priced above Northeast's fares. This exception remained true throughout the study period. The intense
competi-tion, therefore, was between Air New England and Executive for the small city-pairs. The New York routes went to Northeast by default.**
2. June 1971
Air New England ended service to Waterville but initiated service to
Martha's Vineyard ( Figure 3-2 ). This change concentrated Air New England's network around the Islands, to take advantage of the heavy summer tourist traffic.
Competition in the Islands became intense with Air New England, Executive, and Northeast all offering greatly expanded services, and Massachusetts Air
and North American Airlines also fighting for traffic (Table 3-2 ). For Air New England, control of the Islands was essential since it was concentrating nearly all of its effort there, whereas both Executive and Northeast had sub-stantial networks elsewhere.
That summer Executive raised most of its fares while Air New England held all of its fares constant. This change gave Air New England a competitive advantage, particularly in the Islands where Executive made most of its fare changes. Meanwhile Northeast charged the lowest fares on city pairs to New *Table 10 lists Air New England's fares for every city-pair served over the
nine periods.
* It is assumed that Air New England did not seriously compete on a route unless it priced at or below its main competitor.
-' -'N
F/GU/2E
34:
//
/201/T
D/RGRRI
q1V
NEI
EIV6LRIND
TIUNE
/171
-3
J(EVT
II -3 - I * -* -.-.-. wa . PCK - V17N TICKET 1/1. RYI& - /7U&LISTR
E.
05-D3OSTON /W. 3 T V- 13LURUINTON V7. EWB3- /VEM/ 8EDFORD /7/.HY17- HYRNIS /18.
LC EB-Z EBRNY0N N..
LE M-LEN/S TON 11. PV -t1ONPELR/ER VT /1 VY- /RRTH7'5VINF1.1RD 111.
P)/1- 'POR TlRN'D L M E. UVL- JRERU/LLE 4./
(
York and generally charged the highest fares elsewhere. The result was that Air New England had equal or lower fares than its main competitors on all markets except those into New York.
3. December 1971
Air New England thinned its network by deleting several city-pair connections. Other than this seasonal shrinkage, its route structure was
unchanged ( Figure 3-3 ).
Competition in the islands between Air New England and Executive continued at an aggressive pace, with both carriers offering near summer-level frequencies ( Table 3-3 ). Meanwhile, Northeast pulled out of the
Islands for the winter, and Massachusetts Air and North American disappeared forever.
As events later showed, the winter of 1971-72 was Executive's last
attempt to retain a prominent position in the islands. It lowered many of its fares to match Air New England's and even undercut Air New England on the New Bedford-Boston run. The intent of the fare cuts was to lessen Air New England's competitive advantage; but as will be seen later, it was to no avail.
4. June 1972
Service was reinstated to Waterville by Air New England, where it flew four times daily from Augusta, in competition with Executive. In the Islands, Air New England's activity increased to the previous summer's level ( Figure 3-4
)-Executive Airlines conceded the islands, flying but a single loop:
I I
FIGJ2E
3-3:
/7/2
ROL/TE D/1R/RM,
NE
/4/
EV6
L
fND
DEC EMe 1971
--- -.| -a.. cw 30/-oo
RCK - N1/NTICKFT M?.RIO -/71/IUS TR IE, 1305-3OSTON 1W.
3TV-3RUN/'GTON Y7 EWB- IVEM 1ED19FORD '/97
H YR- HYR/VA/S
4-LrE8- Z EBR.NON /V.h.
LEU - E'/S TON AME.
L &b- ZR G7/7l//7 /i ,
IPV -1ONPELI/ER VT / VY - IWRRTHR7'S
VINEYRRD1P. f/1.
Ph,/7- POR T&VD IfE.
JVL- fRERU/LLE 4-.
r/GY2E 3-f:-7/C
QOLT/7E
D/71GR7M
NAEli
E/V6
LfND
a7LINE
q7
* ; - --- -3 - - -I %-,. C (f PCK - IINTICKFT 17.RUO - /?UGUS T7 IE,
1305-3O5TON 1W.
13TV-13LRUN/GTO/V V7.
EW3- IVEa 3EDFOW /71.
H Y17 R- HYRNM/1S 1-11. L E- ZE NOA /V. #. LE/-ENISTON YE. LGC?17- Z/7 GURRO?01/U. Y.4 AIPV -'O/VPEL/ER VT p V'- /1RRTH'S
R)/Y- PO/ T'LD 1E. JV L-U(RTERuU E /'6E
,i~imuIl,
23
flew roughly equal frequencies on competitive routes in the North, but
Executive flew to ten cities while Air NewEngland flew to only three (Boston
not included). Meanwhile, Northeast re-entered the Islands, again concentra-ting on routes in and out of New York. Pilgrim Airlines initiated flights between New York (JFK) and Boston at $23 one way, the lowest coach fare avail-able.
Air New England held all of its fares constant except on the Boston-Augusta flight where an increase coincided with an Executive increase,
retaining a relative price advantage. This advantage was network wide, a result of Executive's fare increases a year earlier. Air New England continued to price above Northeast Airlines on routes to New York and underprice Northeast elsewhere. Table 3-10 shows this phenomenon to be true in every market where the two airlines competed.
5. December 1972
As the Islands experienced their seasonal decline in-traffic, Delta (which
had absorbed Northeast) and Executive pulled out completely and Air New England trimmed its schedule (Figure 3-5). Up North, however, Air New England added a Boston-Waterville non-stop and held its frequencies at summer levels.
Air New England had captured sole control of the Islands; it now looked to the North where Executive dominated. It strengthened its existing network
in the North, a harbinger of things.to come. Executive flew higher frequencies on most routes, but it also charged a higher fare than Air New England
F/GIPE3-E /7/2
20LTE D/RIRJ,
WEAl EIV&Lc1/VD
NE
EVFR 1ND
LffCEMBER
* -(VT C33 T,%
.,r- ..
.11'\ .
--,I
PCK - A1IATCKFT 1117. RUG -RUGUL5 TH /E , 305 -505 TON 1W . 13 TV- 3LURULNTO/V V7EWB- IVEWV fEDFOR/D /7.
H YR- HYRNNVIS A7/.
L E3- ZE/7/OA 1Y.#.
LEt/-EA/S TON //E.
L GR-N- ZR GURR-71O//? /,1V
IPV -tlOIVPEL/ER VT
/1 VY- /1lRTHR'S
VV-U IELRD 4 IR. ipW/7- POR, TLND 11E.
25
At last, Air New England started to raise fares, but only in the Islands where its competition had just ended. In every market where it faced
competi-tion, it held its fare constant ( Table 3-10).
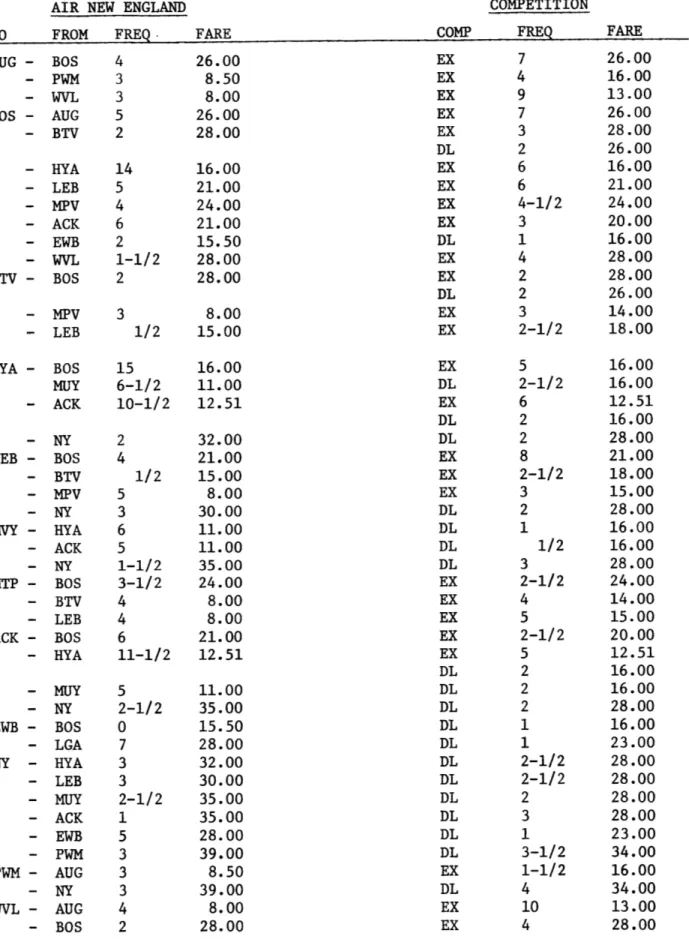
6. June 1973
Air New England had doubled its Northern network adding Lebanon, Montpelier,
Burlington, and a non-stop between Hyannis and Augusta (Figure 3-6). - Mean-while, the Islands were maturing into a stable market, with only seasonal changes occurring throughout the remainder of the study period.
The competitive battlefield shifted to the North where Air New England was mounting a full scale assault. It flew to every city served by Executive,
except Lewiston and severely undercut Executive's fares on many of the
routes , as shown below. Executive responded by flying higher
Fares During June, 1973
ANE
City Pair Air New England Executive EX
AUG - PWM 8.50 16.00 53
- WVL 8.00 13.00 62
BTV - MPV 8.00 14.00 57
LEB - BTV 15.00 18.00 83
- MPV 8.00 15.00 53
frequencies than Air New England on most routes ( Tabl-e 3-6 ). Meanwhile in
the Islands, Delta was flying from New York and Executive flew
F/GY2E
m
17/2
20/
T
D//G/lf ,
NEU E7VGLRND
TUNE
/173
m/
hL(
:
VI C RCK - N RN/TICKET MR. RUG -//US T I. BO5-B05 7TON 1W. 3T V- UL/INGTON V T.EWBJ.- /VE/-9 6,EDFORD A7. H YI-R- HYRM/S MRl. L E- Z EI7/ON 41A. E/M-LEAIIS TON M. L GR17- Z17 G741/RD/7 Al IPY -110/PEL/ER VT iVY - /KTHR'5 VINEYR1RD /YIR. Pt"L- PgoR TL6WND IE. LJV L-t.JFrTEReU/LLZE 4/E. | |
27
Nantucket.
7. December 1973
Air New England's network thinned slightly, but no cities were added
or deleted (Figure 3-7).
Executive made the next move.* It reduced fares in the Northern market and raised fares on flights from Boston so that all of its fares were $1-2 above Air New England's (Table 3-7 ). This gave Air New England a
system wide edge with fares ,but Executive continued running higher frequencies.
Illustrative Fare Changes Made by Executive
June Air NE 26.00 8.50 8.00 28.00 21.00 24.00 1973 EX 26.00 16.00 13.00 28.00 21.00 24.00 December Air NE 26.00 8.50 8.00 28.00 21.00 24.00 1973 EX 27.00 10.00 9.00 29.00 22.00 25.00
Delta flew routes out of New York and Boston, with Air New England over-pricing the New York flights and underover-pricing the Boston flights. Air New England was the lone carrier in the Islands.
*In fact, Executive sold its assets to Air New England on December 19, 1973. The above was Executive's scheduled plan as recorded by the December 1973 QAG.
City Pair AUG- BOS - PWM - WVL BOS - BTV - LEB - MPV . Iwl 11011 , , , I 1 11 , W , .1111M ON111111111do
28
7
<.
r/GUI2E
3-7
//2 /NE. /a
E/VGLRND
QOLTE
D/RGIRM DCEt1BER
1973
(VT
WV
PCK - JWYNTLCKFT 11/7.
RU6-
1/US T
EII.
/305-O5TON /r.
B/TV-BURU1NITON
VT-EWB4- /VEW/ 1EDFORD /1.
--- - -/..-...- Y/7- H YI RN IS 1ll6 . LCEB-Z E?6ON 4/.N.
LEM-ZEIS TON AE.
L CF - ZR GR/fl ORI7 /5i APV -IONPEL/ER VT SIvY- /MRRfTH'S VINElRRD /YIR. PW1d- POR TbLRND /E. IVL- JrTERL/IL l /.
29
8. June 1974
Lewiston, Maine was added to Air New England's itinerary. This, with
numerous additional links in its system, gave its network excellent coverage
over the New England region ( Figure 3-8).
Executive Airlines went out of business in December 1973, leaving Air New
England and Delta as the two major carriers in the region. Delta entered the
Islands again and flew from Boston to Burlington and Portland (Table 3-8).
Air New England priced over Delta on New York and Boston flights and priced under Delta elsewhere. Also, Bar Harbor Airlines began flights between Boston and Portland and Pilgrim continued serving New York-Boston.
Now Air New England raised all of its fares to a level as high or higher than Executive had been charging in December of 1973.
9. December 1974
No changes occurred: Delta made its seasonal withdrawal from the Islands and Air New England reduced most of its frequencies.
10. Summary
Air New England captured the Northeast regional market by
out-performing Executive Airlines. It began by splitting the region into two
markets, the Islands and the North, then entering the Island market, the
stronger of the two, at fares and frequencies equal to Executive's. Executive responded by raising its fares slightly. When Air New England appeared to be gaining control, Executive lowered its fares to match Air New England's - but lost its hold on the Island market despite this. Then Air New England expanded into the Northern market at fares far below and frequencies slightly below
_ _Vwl fo, 1 1 1-,, I , 11 , III NIJI, I j11101,141 1, 111 411111111 MMMI
Executive's. Executive responded by adjusting its fares to a level just above Air New England's. Soon Executive went bankrupt, due in part to Air New England's aggressive competition.
Air New England used several successful strategies. First, it entered one market at a time, but entered the market completely. This was demon-strated when it entered the Islands first and only later went into the North. It also held its fares constant, while Executive's levels continually changed. Only when it drove Executive out of a market did Air New England raise its fares. It also offered a continuous, year round service, rather than entering during the summer and leaving during the winter. This continuity gave Air New England a greater identity with the market.
F0L12E3-J. /7/C
WE/A
EIVGLR/VND
YThNF
/87Y
f
CI.
) PCK - IA/7ICKFT MR7,. FZI6 - 1-7/ICS 7 /M' /305-30.5 TO/N /1W B3TI/-8fL1RfrQ/ V7' EWf3- IVEWI 93E,9FOAL 1/71. Y1 Y1- /III 1/q?Lt7-LE/3/7//9hOA'
.#/.
LEI/-LEA'IS TO/V PIE. LC-17 -Z/7 G?1I'/F / I. IIPV -pO1VPfL/?gR VT7
V/N6 llqT17RV 11?
bUVL- URTERULLE AF,
K
F/GJE
3-.
/7/2
20LUTE
D/R&GR7,
WE/A
EIVGLF/ND
DECEMBER1
/
W4VL U&0 D RCK - NTICKET MR?.RU6 -R/G7LUS 7 ME.
/305-105TON /WR.
/3TV-13YRN7ON VT
EWB- /F 3ED9FORD P7R.
H YR-H/-YRNNIVS MR..?
L6EB-Z EBR1NON N..
LEM-ZE'/S TON 1?E.
Z GR9- Z 1- (74/9111D/V, /tv.
AIPV -tONPEL/,ER VT /1 VY - /IR/715
VINE17R /1MR.
Ptd/7- POR TLRID 1E.
33
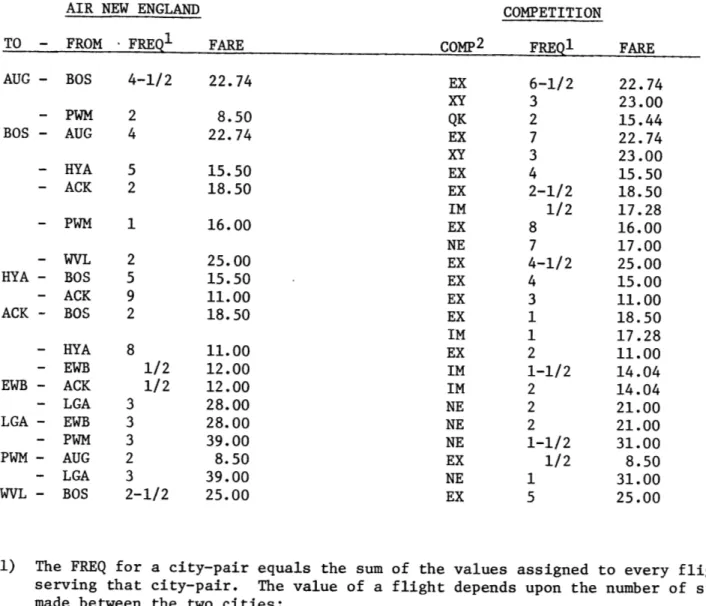
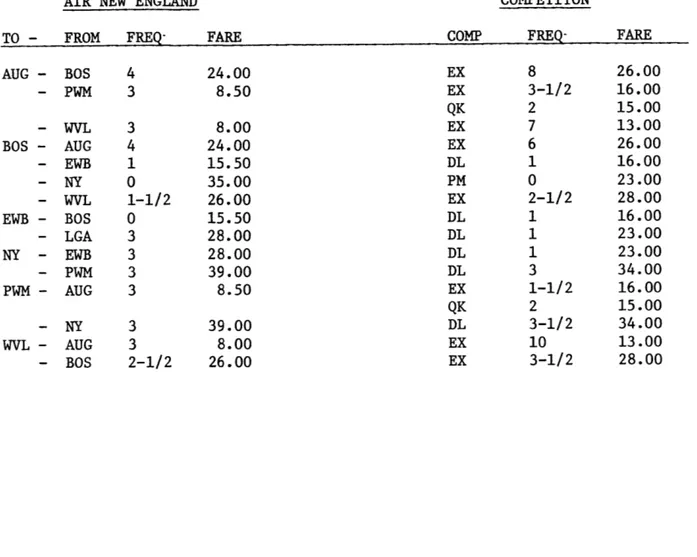
TABLE 3-1 AIR NEW ENGLAND CITY-PAIR COMPETITION, DECEMBER
AIR NEW ENGLAND
TO - FROM - FREQ0
COMPETITION
FARE COMP2 FRFOl
AUG - BOS 4-1/2 22.74 - PWM 2 BOS - AUG 4 - HYA 5 - ACK 2 - PWM 1 HYA -ACK -WVL BOS ACK BOS - HYA - EWB EWB - ACK - LGA LGA - EWB - PWM PWM - AUG - LGA WVL - BOS 8.50 22.74 15.50 18.50 16.00 25.00 15.50 11.00 18.50 8 11.00 1/2 12.00 1/2 12.00 3 28.00 3 28.00 3 39.00 2 8.50 3 39.00 2-1/2 25.00
1) The FREQ for a city-pair equals the sum of the values assigned to every flight
serving that city-pair. made between the two citi
non-stops = 1
one-stops = 1/2
2) EX - Executive
IM - Mass. Air Ind.
NE - Northeast
The value of a flight depends upon the number of stops es: two stops = 1/4 > three stops =0 QK - Aroostook XY - Downeast DL - Delta 3) Airport Codes: ACK - Nantucket AUG - Augusta BOS - Boston BTV - Burlington EWB - New Bedford HYA - Hyannis
MVY - Martha's Vineyard
LEB - Lebannon LEW - Lewiston LGA - La Guardia MPV - Montpelier PWM - Portland WVL - Waterville
(NY - New York, same as LGA)
4) Only city pairs where Air New England faced competition are shown; monopoly routes are not included.
1970 FARR EX XY QK EX XY EX EX IM EX NE EX EX EX EX 6-1/2 3 2 7 3 4 2-1/2 1/2 8 7 4-1/2 4 3 1 1 2 1-1/2 2 2 2 1-1/2 1/2 22.74 23.00 15.44 22.74 23.00 15.50 18.50 17.28 16.00 17.00 25.00 15.00 11.00 18.50 17.28 11.00 14.04 14.04 21.00 21.00 31.00 8.50 31.00 25.00 FRFQl 'FA'P'F , 11 00111i, I ,
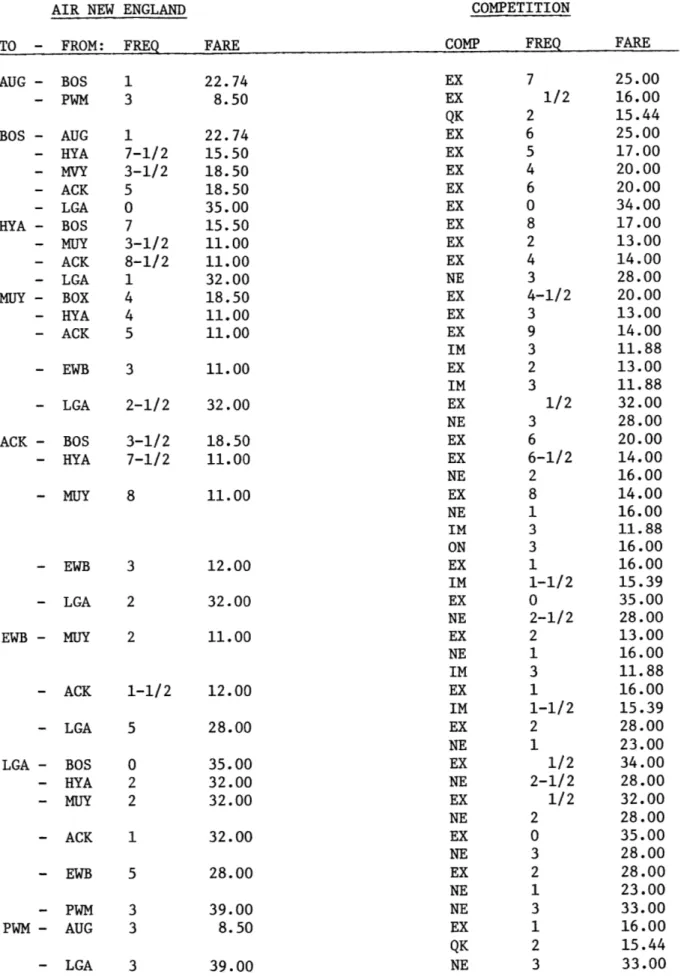
TABLE 3-2: AIR NEW ENGLAND
CITY-PAIR COMPETITION, JUNE 1971
AIR NEW ENGLAND COMPETITION
TO - FROM: FREQ FARE COMP FREQ FARE
AUG - BOS 1 22.74 EX 7 25.00 - PWM 3 8.50 EX 1/2 16.00 QK 2 15.44 BOS - AUG 1 22.74 EX 6 25.00 - HYA 7-1/2 15.50 EX 5 17.00 - MVY 3-1/2 18.50 EX 4 20.00 - ACK 5 18.50 EX 6 20.00 - LGA 0 35.00 EX 0 34.00 HYA - BOS 7 15.50 EX 8 17.00 - MUY 3-1/2 11.00 EX 2 13.00 - ACK 8-1/2 11.00 EX 4 14.00 - LGA 1 32.00 NE 3 28.00 MUY - BOX 4 18.50 EX 4-1/2 20.00 - HYA 4 11.00 EX 3 13.00 - ACK 5 11.00 EX 9 14.00 IM 3 11.88 - EWB 3 11.00 EX 2 13.00 IM 3 11.88 - LGA 2-1/2 32.00 EX 1/2 32.00 NE 3 28.00 ACK - BOS 3-1/2 18.50 EX 6 20.00 - HYA 7-1/2 11.00 EX 6-1/2 14.00 NE 2 16.00 - MUY 8 11.00 EX 8 14.00 NE 1 16.00 IM 3 11.88 ON 3 16.00 - EWB 3 12.00 EX 1 16.00 IM 1-1/2 15.39 - LGA 2 32.00 EX 0 35.00 NE 2-1/2 28.00 EWB - MUY 2 11.00 EX 2 13.00 NE 1 16.00 IM 3 11.88 - ACK 1-1/2 12.00 EX 1 16.00 IM 1-1/2 15.39 - LGA 5 28.00 EX 2 28.00 NE 1 23.00 LGA - BOS 0 35.00 EX 1/2 34.00 - HYA 2 32.00 NE 2-1/2 28.00 - MUY 2 32.00 EX 1/2 32.00 NE 2 28.00 - ACK 1 32.00 EX 0 35.00 NE 3 28.00 - EWB 5 28.00 EX 2 28.00 NE 1 23.00 - PWM 3 39.00 NE 3 33.00 PWM - AUG 3 8.50 EX 1 16.00 QK 2 15.44 - LGA 3 39.00 NE 3 33.00 , w. - --1 404 m 0 "' Wwwmlw wowel
-35
TABLE 3-3 : AIR NEW ENGLAND
CITY-PAIR COMPETITION, DECEMBER 1971
AIR NEW ENGLAND COMPETITION TO FROM FREQ AUG - BOS - PWM BOS - AUG - HYA - MUY - ACK - EWB - LGA HYA - BOX - MUY - ACK - EWB - LGA MUY - BOS - HYA - ACK - EWB - LGA ACK - BOS - HYA - MUY - EWB - LGA EWB - BOS - HYA - MUY - ACK - LGA LGA - HYA - MUY - ACK - EWB - PWM PWM - AUG - LGA 1 3 1 5 1-0 0 7 5-3 1 2 5-6 2 1 2 5-5 1 0 3 3-1 4 1 0 3 3 3 3 22.74 8.50 22.74 15.50 1/2 18.50 1/2 18.50 15.50 35.00 15.50 1/2 11.00 1/2 11.00 11.00 32.00 18.50 1/2 11.00 11.00 11.00 32.00 18.50 1/2 11.00 11.00 12.00 1/2 35.00 15.50 11.00 1/2 11.00 12.00 28.00 32.00 32.00 35.00 28.00 39.00 8.50 39.00
FARE COMP FREQ FARE EX QK EX EX EX EX EX EX EX EX EX EX EX EX EX EX EX EX EX EX EX EX EX EX EX EX EX EX EX EX EX EX NE QK NE 4 2 4 5 2 2 0 1 5 5-1/2 5-1/2 2 1 2 4-1/2 3 3 0 2 4-1/2 5 1-1/2 0 1/2 3 1 1/2 2 1 0 0 2 1-1/2 2 2 25.00 15.44 25.00 17.00 20.00 20.00 15.00 34.00 17.00 13.00 14.00 11.00 30.00 20.00 13.00 11.00 11.00 32.00 20.00 14.00 11.00 12.00 32.00 15.50 11.00 11.00 12.00 28.00 30.00 32.00 32.00 28.00 33.00 15.44 33.00
TABLE 3-4: AIR NEW ENGLAND CITY-PAIR COMPETITION, JUNE 1972
AIR NEW ENGLAND COMPETITION
TO - FROM FREQ FARE COMP' FREQ
AUG - BOS 5 - PWM 3 BOS -HYA - MVY-ACK -WVL 4 AUG 5 MUY 4 ACK 6 NY 0 WVL 2 MUY 5 ACK 1 NY 1 BOS 4 HYA 7 ACK 6 NY 1 BOS 6 MUY 7 - NY EWB - BOS - LGA NY - HYA -MUY - ACK - EWB - PWM PWM - AUG WVL--1/2 -1/2 1-1/2 -1/2 1 4 1-3 3 3 NY 3 AUG 4 BOS 2 24.00 8.50 8.00 24.00 18.50 18.50 35.00 26.00 11.00 11.00 32.00 18.50 11.00 11.00 32.00 18.50 11.00 1/2 35.00 15.50 28.00 1/2 32.00 1/2 32.00 1/2 35.00 28.00 39.00 8.50 39.00 8.00 26.00 FARE EX EX QK EX EX EX EX PM EX NE NE NE EX NE EX NE NE EX EX NE NE NE NE NE NE NE NE NE EX QK NE EX EX 4-1/2 1 2 4 4-1/2 5 4 1/2 2 1/2 4 2 4 3 4 1-1/2 3 5 2 1 1 1 1 2-1/2 3 1 1 2-1/2 1 2 3 4 2 26.00 16.00 15.00 13.00 26.00 20.00 20.00 23.00 28.00 16.00 16.00 28.00 20.00 16.00 11.00 16.00 28.00 20.00 11.00 16.00 28.00 16.00 23.00 28.00 28.00 28.00 23.00 33.00 16.00 15.00 33.00 13.00 28.00
37
TABLE 3-5 AIR NEW ENGLAND
CITY-PAIR COMPETITION, DECEMBER 1972 AIR NEW ENGLAND
TO - 1~'ROM FREO FARE COMP
COMPETITON FREQ-AUG - BOS 4 - PWM 3 BOS -EWB -NY -PWM -a WVL-WVL AUG EWB NY WVL BOS LGA EWB PWM AUG NY AUG BOS 3 4 1 0 1-1/2 24.00 8.50 8.00 24.00 15.50 35.00 26.00 15.50 28.00 28.00 39.00 8.50 3 39.00 3 8.00 2-1/2 26.00 FARE EX EX QK EX EX DL PM EX DL DL DL DL EX QK DL EX EX 8 3-1/2 2 7 6 1 0 2-1/2 1 1 1 3 1-1/2 2 3-1/2 10 3-1/2 26.00 16.00 15.00 13.00 26.00 16.00 23.00 28.00 16.00 23.00 23.00 34.00 16.00 15.00 34.00 13.00 28.00 ... -FO RO FA
38
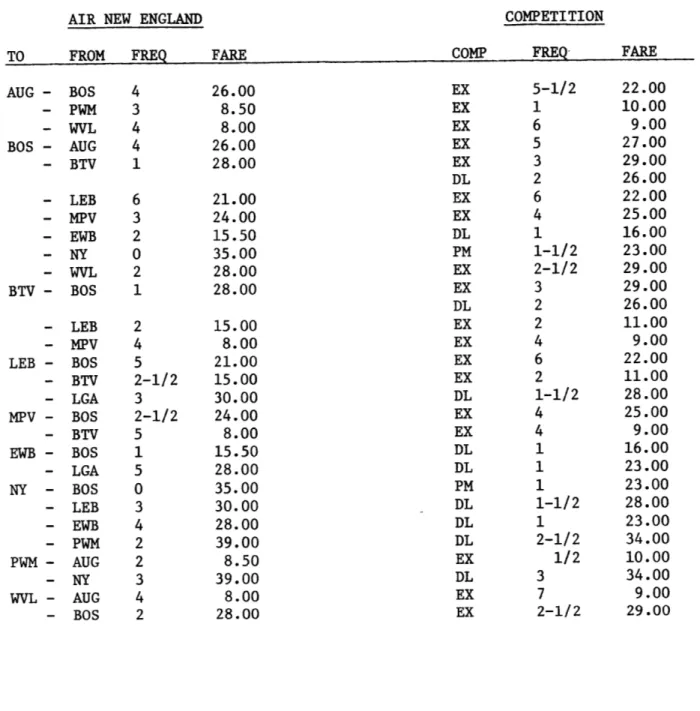
TABLE 3-6.: AIR NEW ENGLAND CITY-PAIR COMPETITION, JUNE 1973
AIR NEW ENGLAND COMPETITION
TO FROM FREQ- FARE COmP FREQ FARE
AUG - BOS 4 26.00 EX 7 26.00 - PWM 3 8.50 EX 4 16.00 - WVL 3 8.00 EX 9 13.00 BOS - AUG 5 26.00 EX 7 26.00 - BTV 2 28.00 EX 3 28.00 DL 2 26.00 - HYA 14 16.00 EX 6 16.00 - LEB 5 21.00 EX 6 21.00 - MPV 4 24.00 EX 4-1/2 24.00 - ACK 6 21.00 EX 3 20.00 - EWB 2 15.50 DL 1 16.00 - WVL 1-1/2 28.00 EX 4 28.00 BTV - BOS 2 28.00 EX 2 28.00 DL 2 26.00 - MPV 3 8.00 EX 3 14.00 - LEB 1/2 15.00 EX 2-1/2 18.00 HYA - BOS 15 16.00 EX 5 16.00 MUY 6-1/2 11.00 DL 2-1/2 16.00 - ACK 10-1/2 12.51 EX 6 12.51 DL 2 16.00 - NY 2 32.00 DL 2 28.00 LEB - BOS 4 21.00 EX 8 21.00 - BTV 1/2 15.00 EX 2-1/2 18.00 - NPV 5 8.00 EX 3 15.00 - NY 3 30.00 DL 2 28.00 MVY - HYA 6 11.00 DL 1 16.00 - ACK 5 11.00 DL 1/2 16.00 - NY 1-1/2 35.00 DL 3 28.00 MTP - BOS 3-1/2 24.00 EX 2-1/2 24.00 - BTV 4 8.00 EX 4 14.00 - LEB 4 8.00 EX 5 15.00 ACK - BOS 6 21.00 EX 2-1/2 20.00 - HYA 11-1/2 12.51 EX 5 12.51 DL 2 16.00 - MUY 5 11.00 DL 2 16.00 - NY 2-1/2 35.00 DL 2 28.00 EWB - BOS 0 15.50 DL 1 16.00 - LGA 7 28.00 DL 1 23.00 NY - HYA 3 32.00 DL 2-1/2 28.00 - LEB 3 30.00 DL 2-1/2 28.00 - MY 2-1/2 35.00 DL 2 28.00 - ACK 1 35.00 DL 3 28.00 - EWB 5 28.00 DL 1 23.00 - PWM 3 39.00 DL 3-1/2 34.00 PWM - AUG 3 8.50 EX 1-1/2 16.00 - NY 3 39.00 DL 4 34.00 WVL - AUG 4 8.00 EX 10 13.00 - BOS 2 28.00 EX 4 28.00
39
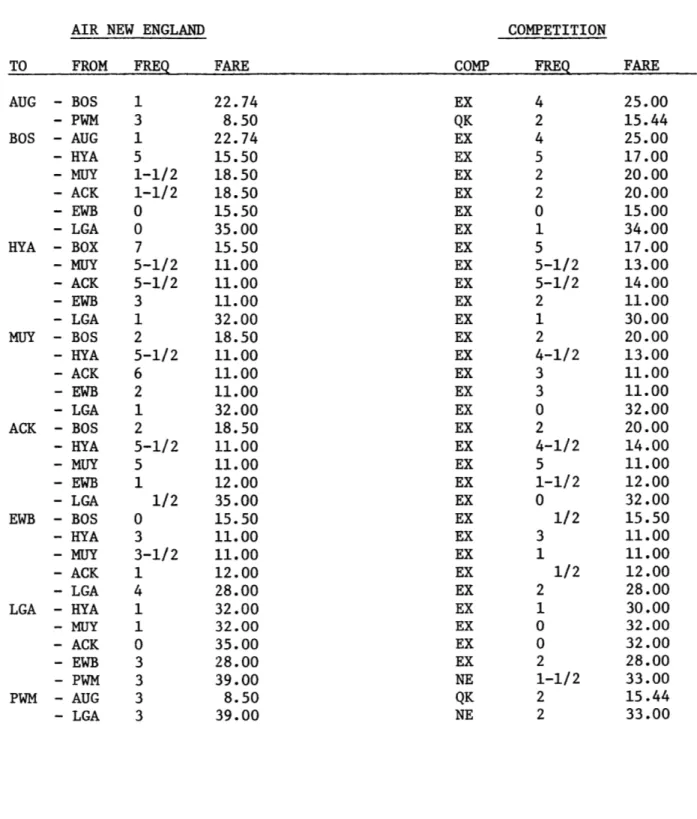
TABLE 3-7: AIR NEW ENGLAND CITY-PAIR COMPETITION, DECEMBER 1973 AIR NEW ENGLAND
AUG -BOS - BTV- LEB- MPV- EW- NY-PTV -WVL -BOS PWM WVL AUG BTV LEB MPV EWB NY WVL BOS LEB MPV BOS BTV LGA BOS BTV BOS LGA BOS LEB EWB PWM AUG NY AUG BOS COMP? 26.00 8.50 8.00 26.00 28.00 21.00 24.00 15.50 35.00 28.00 28.00 15.00 8.00 21.00 15.00 30.00 24.00 8.00 15.50 28.00 35.00 30.00 28.00 39.00 8.50 39.00 8.00 28.00 EX EX DL PM EX EX PM COMPETITION FREO 5-1/2 1 6 5 3 2 6 4 1 1-1/2 2-1/2 3 2 2 4 6 2 1-1/2 4 4 1 1 1 1-1/2 1 2-1/2 1/2 3 7 2-1/2 TO FROM FREQ O 2 4 5 2-1/2 3 2-1/2 5 1 5 0 3 FARE 22.00 10.00 9.00 27.00 29.00 26.00 22.00 25.00 16.00 23.00 29.00 29.00 26.00 11.00 9.00 22.00 11.00 28.00 25.00 9.00 16.00 23.00 23.00 28.00 23.00 34.00 10.00 34.00 9.00 29.00 TA VR () COH
Awl iii,1111 1011,111 ii,
TABLE 3-8 : AIR NEW ENGLAND
CITY-PAIR COMPETITION, JUNE 1974
AIR NEW ENGLAND COMPETITION
TO FROM FREQ FARE COMP FREQ FARE
BOS - BTV 4 31.00 DL 1 28.00 - EWR 1 18.00 DL 1 17.00 - NY 0 40.00 PM 1/2 23.00 - PWM 5 21.00 DL 5 20.00 QO 8 21.00 BTV - BOS 4 31.00 DL 1 28.00 HYA - MUY 7-1/2 13.00 DL 1-1/2 17.00 - ACK 19-1/2 14.00 DL 2 17.00 - LGA 3 36.00 DL 1 30.00 LEB - LGA 3 34.00 DL 1-1/2 30.00 MUY - HYA 9 13.00 DL 1 17.00 - ACK 6-1/2 13.00 DL 1/2 17.00 - LGA 5 39.00 DL 2 30.00 ACK - HYA 13-1/2 14.00 DL 1 17.00 - MUY 11 13.00 DL 1-1/2 17.00 - LGA 4 39.00 DL 2 30.00 EWB - BOS 1 18.00 DL 1 17.00 - LGA 5 32.00 DL 1 24.00 NY - BOS 0 40.00 PM 1 23.00 - HYA 3 36.00 DL 2 30.00 - LEB 2 34.00 DL 1-1/2 30.00 - MUY 5 39.00 DL 1-1/2 30.00 - ACK 4 39.00 DL 2 30.00 - EWB 3 32.00 DL 1 24.00 - PWM 2 44.00 DL 3 38.00 PWM - BOS 4 21.00 DL 5 20.00 QO 7 21.00 - LGA 3 44.00 DL 2 38.00
41
TABLE 3-9: AIR NEW ENGLAND
CITY-PAIR COMPETITION, DECEMBER 1974
AIR NEW ENGLAND COMPETITION
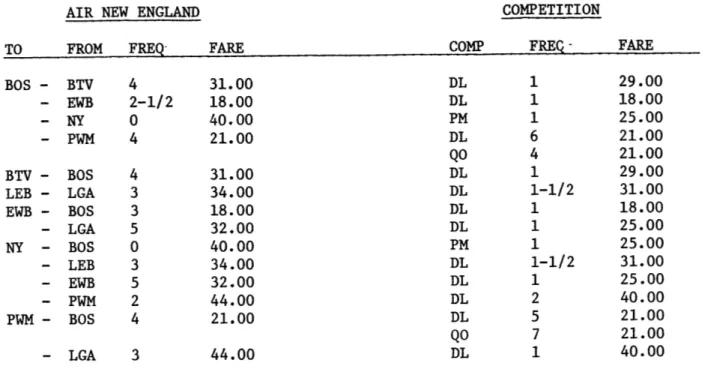
TO FROM FREQ FARE COMP FREQ- FARE
BOS - BTV 4 31.00 DL 1 29.00 - EWB 2-1/2 18.00 DL 1 18.00 - NY 0 40.00 PM 1 25.00 - PWM 4 21.00 DL 6 21.00 QO 4 21.00 BTV - BOS 4 31.00 DL 1 29.00 LEB - LGA 3 34.00 DL 1-1/2 31.00 EWB - BOS 3 18.00 DL 1 18.00 - LGA 5 32.00 DL 1 25.00 NY - BOS 0 40.00 PM 1 25.00 - LEB 3 34.00 DL 1-1/2 31.00 - EWB 5 32.00 DL 1 25.00 - PWM 2 44.00 DL 2 40.00 PWM - BOS 4 21.00 DL 5 21.00 QO 7 21.00 - LGA 3 44.00 DL 1 40.00 , li 1114, m li
42
TABLE 3-10: AIR NEW ENGLAND FARES
R = Relationship of Air New England's Fares to its Competitor's fares.
L = Less than
E = Equal to G = Greater than N = No Competition
CM = Competitor; if more than one exists, only the competitor flying the highest FREQ is listed.
DECEMBER 70 FARE R CM 22.74 E EX 30.59 N JUNE 71 FARE R 22.74 L 30.50 N TO - FROM AUG - OS - HYA - LEW - MVY - NY - PWM - WVL BOS - BTV - HYA - LEB - LEW - MVY - MPV - ACK - EWB -NY -PWM - WVL BTV - LEB - MPV HYA - LEB - MVY HYA - MPV - ACK - EWSB - NY - WVL LEB - MPV - NY LEW - PWM -WVL NVY - ACK - EWS - NY - WVL MPV - NY ACK - EWB - NY EWB - NY 15.50 I L IEX 18.50 18.50 35.00 18.50 E EX 16.00 E EX 25.00 E EX 11.00 IL 11.00 11.00 32.00 11.00 11.00 32.00 12.001 L 35.00 G 28.00 1q.0n EX 11.00 11.00 11.00 32.00 11.00 11.00 32.00 12.00 35.00 28.00 1.no 42.00 8.50 6.50 15.50 DECEMBER 71 FARE R 22.74 L 30.50 N 42.00 8.50 15.50 18.50 18.50 15.50 35.00 42.00 QK 8.50 11.00 11.00 32.00 12.00 L 35.00 N MV - Du 28.00 20 nn
TO -FROM FARE R CM FARE 'R CM FARE R CM AUG - 80524.00 L EX 24.00 L EX 26.00 E EX - HYA 30.50 N 30.50 N 30.50 N - LEW - MVY . 32.00 N -NY 42.00 N 42.00 N 42.00 N -PWM 8.50 L QK 8.50 L EX 8.50 L EX -WVL 8.00 L EX 8.00 L EX 8.00 L EX SOS - BTV 28.00 E EX - HYA 15.50 N 15.50 N 16.00 E EX - LEB 21.00 E EX - LEW - MVY 18.50 L EX 20.00 N 21.00 G EX - MPV 24.00 E EX - ACK 18.50 L EX 20.00 N 21.00 N - EWB 15.00 N 15.50 L OL 15.50 L OL - NY 35.00 G PM 35.00 G PM - PWR - WVL 26.00 L EX 26.00 L EX 28.00 E EX BTV -.LEB 15.00 L EX - MPV 8.00 L EX HYA - LEB 28.00 N - MY 11.00 L NE 11.00 N 11.00 L DL HYA - MPV 32.00 N - ACK 11.00 L NE 12.51 N 12.51 E EX - ENB 11.00 N 11.00 N 11.00 N - NY 32.00 G NE 32.00 N 32.00 G DL - WVL 32.75 N 32.75 N LEB - MPV 8.00 L EX - NY 30.00 G DL LEN - PWM -WVL
MVY - ACK 11.00 E EX, 11.00 N 11.00 L OL
- EWB 11.00 N 12.00 N 12.00 N -NY 32.00 G NE 35.00 N 35.00 G DL -WVL 34.25 N MPV - NY 36.00 N ACK - EWS. 12.00 N 15.00 N 15.00 N - NY 35.00 G NE 35.00 N 35.00 G DL EWS - NY 28.00 G NE 28.00 G DL 28.00 G OL NY - PWM 39.00 IG NE 39.00 G DL 39.00 G DL
DICIMIR 73 JUNE 74 DECEMBER 74
TO - FARF R CM FARE R CM FARE R CM 45 AUG - BOS 26.00 L EX 29.00 N 29.00 N - HYA -LEW - 9.00 N 9.00 N -MY - NY 42.00 N 47.00 N 47.00 N - PWM 8.50 L EX 10.00 N 10.00 N - WVL 8.00 L EX 9.00 N 9.00 N SOS - STV 28.00 L EX 31.00 G DL 31.00 G DL - HYA 16.00 N 18.00 N 18.00 N - LEB 21.00 L EX 23.00 N 23.00 N - LEW 27.00 N 27.00 N - MVY 21.00 N 23.00 N 23.00 N - NPV 24.00 L EX 27.00 N 27.00 N - ACK 21.00 N 23.00 N 23.00 N - EWS 15.50 L DL 18.00 G DL 18.00 E DL - NY 35.00 G PM 40.00 G PM 40.00 G PM - PWM 21.00 G DL 21.00 E DL - WVL 28.00 L EX 31.00 N 31.00 N BTV - LEB 11.00 L EX 16.00 N 14.81 N - MPV 8.00 L EX 9.00 N 7.00 N HYA - LEB - MY 11.00 N 13.00 L DL 13.00 N HYA - MPV -ACK 12.50 N 14.00 L DL 14.00 N - EWB 11.00 N 14.00 N 14.00 N - NY 32.00 N 36.00 G DL 36.00 N - WVL LEB - MPV 8.00 N 9.00 N 9.00 N - NY 30.00 G DL 34.00 G DL 34.00 G DL LEW -PWM 9.00 N 9.00 N - WVL 16.00 N 14.81 N MVY - ACK 11.00 N - 13.00 L DL 13.00 N - EWB 12.00 N 13.00 N 13.00 N - NY 35.00 N 39.00 G DL 39.00 N - WVL MPV - NY 36.00 N 40.00 N 40.00 N ACK - EWB 15.00 N 17.00 N 17.00 N - NY 35.00 N 39.00 G DL 39.00 N EWB - NY 28.00 G D1. 32.00 G DL 32.00 G NY - PWM G.00 44.00 G DL 44.00 G OL PWM - WVL 17.00 IN DL
4. AIRCRAFT FLEET, TRAFFIC, AND FINANCIAL STATUS
Air New England began operations with a fleet of the larger of the
commuter aircraft, three Twin Otters (DHC-6's) and one Beech 99, plus two
C-45's and an Aero Commander. It used the Twin Otters and B-99 for scheduled passenger traffic. (Of these aircraft, only one of the used Twin Otters was purchased.) Although Air New England was a brand new airline competing
against Executive Airlines, which at that time had a fleet over twice its
size, it did not hesitate to open operations with comparable aircraft, rather than a mix of smaller aircraft such as Cessna 402's.
By the end of its first year of operations Air New England had innovated
the use of old DC-3's, which it bought and refurbished extensively and used successfully in the Islands market. By March of 1972 Ai-r New England was flying DC-3's, Twin Otters and B-99's exclusively in passenger service.
The success of Air New England in its competitive strategy against Executive during the first critical year, 1971, can best be shown by an
examination of comparative statistics for 1971 of Air New England and Executive. Tables 4-1 and 4-2 show the total passengers enplaned and deplaned at the points served by both airlines and the city pair market shares. By concentrating on the Islands market, Air New England was able to capture almost 60% ofthis market in its first year of operation, although Executive was still carrying more overall passengers on its network.
Despite its substantial revenues, Executive's losses were mounting
steadily. Table 4-3 shows the income statements for both companies. Although the percentages of expenses for flying operations and aircraft and traffic
47
perfectly reversed for maintenance and general and administrative, showing the relatively lean corporate overhead at Air New England. The overall loss
as a percentage of total revenue is shownto be substantially higher for
Executive.
Figure 4-4 shows that passenger yield for both airlines, on a system basis, was comparable during 1971, with both airlines displaying seasonality
in their yield, rising in the summer passenger months when the higher yielding Islands market was peaking. However, Table 4-5 reveals that operating expenses per passenger flown on Executive were nearly double those of Air New England. Thus although Air New England's competitive strategy may have hastened the
initial bankruptcy of Executive in December 1971, Executive's high operating expenses were the ultimate cause.
Although Executive remained as a commuter air carrier in New England fol-lowing the voluntary bankruptcy, and continued carrying a substantial number of passengers, its corporate image was substantially damaged. Air New England had gained greater market acceptance as a responsible carrier for the rest of
its competitive fight with Executive.
During the summer of 1972 Air New England (Tables 4-6 and 4-7) almost doubled its capacity by purchasing two additional DC-3's and two more used
Twin Otters. Table 4-8, the balance sheet for Air New England (March 72), reveals that the financing for the purchases of the aircraft came basically from long term debt to banks. The initial financing for Air New England came basically
from equity investments made by two major stockholders, Mssrs. Kanzler of
Michigan and Dickinson of New Jersey, who continued to make equity investments in
![[PDF] Cours d’introduction à l’algorithmique et à la programmation avec le langage Cobol | Formation informatique](data:image/gif;base64,R0lGODlhAQABAIAAAP///wAAACH5BAEAAAAALAAAAAABAAEAAAICRAEAOw==)