HAL Id: hal-00329226
https://hal.archives-ouvertes.fr/hal-00329226
Submitted on 1 Jan 2003
HAL is a multi-disciplinary open access
archive for the deposit and dissemination of
sci-entific research documents, whether they are
pub-lished or not. The documents may come from
teaching and research institutions in France or
abroad, or from public or private research centers.
L’archive ouverte pluridisciplinaire HAL, est
destinée au dépôt et à la diffusion de documents
scientifiques de niveau recherche, publiés ou non,
émanant des établissements d’enseignement et de
recherche français ou étrangers, des laboratoires
publics ou privés.
Simulation and analysis of the mesoscale circulation in
the northwestern Mediterranean Sea
Vincent Echevin, Michel Crépon, Laurent Mortier
To cite this version:
Vincent Echevin, Michel Crépon, Laurent Mortier. Simulation and analysis of the mesoscale
circu-lation in the northwestern Mediterranean Sea. Annales Geophysicae, European Geosciences Union,
2003, 21 (1), pp.281-297. �10.5194/angeo-21-281-2003�. �hal-00329226�
Annales
Geophysicae
Simulation and analysis of the mesoscale circulation in the
northwestern Mediterranean Sea
V. Echevin1, M. Cr´epon1, and L. Mortier2
1Laboratoire d’Oc´eanographie Dynamique et de Climatologie, Paris, France 2Ecole Nationale Sup´erieure des Techniques Avanc´ees, Paris, France
Received: 6 July 2001 – Revised: 23 September 2002 – Accepted: 6 October 2002
Abstract. The large-scale and mesoscale circulation of the
northwestern Mediterranean Sea are simulated with an eddy-resolving primitive-equation regional model (RM) of 1/16◦ resolution embedded in a general circulation model (GM) of the Mediterranean Sea of 1/8◦resolution. The RM is forced by a monthly climatology of heat fluxes, precipitation and wind stress. The GM, which uses the same atmospheric forc-ing, provides initial and boundary conditions for the RM.
Analysis of the RM results shows that several realistic fea-tures of the large-scale and mesoscale circulation are evident in this region. The mean cyclonic circulation is in good agreement with observations. Mesoscale variability is in-tense along the coasts of Sardinia and Corsica, in the Gulf of Lions and in the Catalan Sea. The length scales of the Northern Current meanders along the Provence coast and in the Gulf of Lions’ shelf are in good agreement with obser-vations. Winter Intermediate Water is formed along most of the north-coast shelves, between the Gulf of Genoa and Cape Creus. Advection of this water by the mean cyclonic circulation generates a complex eddy field in the Catalan Sea. Intense anticyclonic eddies are generated northeast of the Balearic Islands. These results are in good agree-ment with mesoscale activity inferred from satellite altimet-ric data. This work demonstrates the feasibility of a down-scaling system composed of a general-circulation, a regional and a coastal model, which is one of the goals of the Mediter-ranean Forecasting System Pilot Project.
Key words. Oceanography: physical (currents; eddies and
mesoscale processes; general circulation)
1 Introduction
The aim of the Mediterranean Forecasting System (Pinardi et al., 2001a) is to forecast the circulation and character-istics of the Mediterranean water masses on a global scale (∼10–50 km), to a coastal scale (∼2 km). To satisfy this
Correspondence to: V. Echevin
(echevin@lodyc.jussieu.fr)
goal, several ocean-circulation models with different spatial scales have been implemented. The Modular Ocean Model (MOM; hereafter referred to as the Global Model, GM), a rigid-lid primitive-equation model derived from the GFDL model, has been used by the ISAO-CNR team to simulate the circulation and water-mass characteristics in the Mediter-ranean basin (Demirov and Pinardi, 2002). At the regional scale (4–5 km), a circulation model of the Liguro-Provenal basin has been developed. The rigid-lid primitive-equation OPA model (Madec et al., 1998) has been implemented in the area north of 39.9◦N (the southern boundary of the model
intersects the northern extremity of Minorca, the easternmost Balearic Island), and between 0◦E (the Catalonian coast) and
10.5◦E (the Italian coast). This regional model (hereafter re-ferred to as RM), initialised and forced at its open boundaries by outputs of the GM, was used to simulate the circulation in the Ligurian Sea, the Gulf of Lions, and the north Catalan Sea. The RM will provide initial and open boundary condi-tions for shelf models of the Gulf of Lions and the Catalan Sea (Pinardi et al., 2001b).
The operational forecasting of the circulation at global, re-gional and coastal scale in the Mediterranean can only be achieved if (a) the models are forced by realistic atmospheric fluxes, (b) the model results are validated with the available observations, and (c) data-assimilation methods are imple-mented to increase the model predictability. The first step to achieving these goals is to run the models in a climatolog-ical mode (i.e. taking into account climatologclimatolog-ical forcing), and validate the output with Mediterranean Sea climatolog-ical data. A GM simulation using a climatologclimatolog-ical forcing has been performed by the ISAO-CNR group. The results of this experiment were used to initialise and force the RM at its open boundaries. In the present work we focus on the results of the regional model.
The present paper is structured as follows: Sect. 2 de-scribes the climatological atmospheric forcing used in the simulations; Sect. 3, the GM and RM configuration; Sect. 4 presents the results of the RM simulation; Sect. 5, the con-clusions.
282 V. Echevin et al.: Simulation and analysis of the mesoscale circulation
2 Atmospheric forcing
The same climatological forcing was used both for the GM and the RM. The wind stress and heat (solar, latent, sensi-ble) fluxes were built from a 1◦by 1◦monthly climatology of the European Centre for Medium-term Weather Forecast-ing (ECMWF) model Re-analysis over the period 1979–1993 (Korres, 2002). Latent and sensible heat fluxes were calcu-lated using the ECMWF re-analysis atmospheric parameters following Kondo (1975). The longwave heat flux was cal-culated according to Bignami et al. (1995). For more de-tails on the computations of the surface fluxes, the reader is refered to the Korres (2002) paper . The net annual heat budget is positive, +17.9 W/m2, the annual evaporative bud-get is 1.0 m/year. This net heating is in contradiction with the heat loss estimates from hydrographic measurements, which lay in the range of −7±3 W/m2(Bethoux, 1979) and
−5.2±1.3 W/m2(Macdonald et al., 1994). The biased heat budget may induce a temperature drift in the long term. How-ever, the heat-flux formulation includes an additional restor-ing term to the climatological MODB sea-surface tempera-ture, with a restoring coefficient set to 25 W/m2/◦C. After eight years of GM climatological integration, the annual heat budget is equal to −4.9 W/m2(Korres, 2002). The same heat fluxes formulation was used in the RM, to remain consis-tent with the GM. Since a relatively short integration of 3 years was performed with the RM, the drift is negligible (less than 0.01◦C in 3 years). Evaporation fluxes are computed from the latent-heat flux, and precipitation is specified by the LEGATES climatology (Legates, 1987).
3 Mediterranean global model (GM) and regional model (RM)
The GM used is the MOM which was adapted to the Mediter-ranean Sea. The model grid has 31 z-levels in the verti-cal, as in Korres et al. (2000), and a horizontal resolution of 1/8◦·1/8◦. At this spatial resolution, the model is eddy-permitting. Horizontal turbulent mixing is biharmonic with tracer coefficients equal to 1.5·1010m4/s and momentum co-efficients equal to 2 · 1010m4/s. Vertical turbulent processes are parameterised by a constant turbulent-diffusion coeffi-cient set equal to 0.3 · 10−4m2/s, a viscosity coefficient equal
to 1.5 · 10−4m2/s. A standard convective adjustment scheme
is applied when static instability appears in the water column. A six-year-long simulation was performed with the GM. Monthly mean GM ouputs of the sixth year of simulation were used for the initialisation and open-boundary forcing of the RM.
The primitive equation OPA7 model, which has been used to study dynamical processes in the Mediterranean Sea (Madec et al., 1991; Herbaut et al., 1996, 1997), was imple-mented in a regional configuration with lateral open bound-aries (Deleville, 1997). The model is eddy-resolving and has a horizontal resolution of 1/16◦in longitude, 1/16◦.cos(φ) in latitude (where φ is the latitude), which ensures an exact
isotropy of the horizontal grid. The resolution varies between 5.3 km at 40◦N and 4.9 km at 44.5◦N. The vertical grid
com-prises 37 z-levels whose resolution varies between 6 m near the surface and 200 m at 2800 m depth. The horizontal dif-fusion is biharmonic, with tracer and momentum coefficients equal to 5·108m4/s. Vertical diffusivity of the tracers and ve-locity are calculated with a mixed-layer model based on a tur-bulent kinetic energy scheme (Blanke and Delecluse, 1993). A no-slip boundary condition is used at the coasts and at the bottom.
The bottom topography of the model is that of the 1/16◦by 1/16◦.cos(φ) Mediterranean model of the French MERCA-TOR project (Bahurel, 1999). The bottom topography was modified in a band of ∼50 km width north of 39.9◦N, the latitude of the southern open boundary of the RM, and in the Tyrrhenian Sea, in such a way that the bottom topography of the RM matches that of the GM.
At the initial time, tracer and velocity fields from the GM were interpolated on the RM grid. The interpolation scheme is bilinear in the horizontal, linear in the vertical. The scheme does not take into account any dynamical constraint. The in-terpolation of velocity on the RM grid requires special care: with brute-force interpolation from the GM vertical grid onto the RM one may produce divergent transport fields which are inconsistent with the rigid-lid hypothesis of the OPA7 model. Therefore, the barotropic components of the velocity were modified so that the integrated barotropic transport was non-divergent.
The interpolated temperature, salinity and velocity fields determine the initial state of the RM. After the initialisation, the GM fields are imposed along the southern open boundary of the RM, and in the part of the Tyrrhenian Sea included in the RM domain (between 9◦E and 10.5◦E, and south of the
Corsican channel). In this last region, Newtonian relaxation (with a time scale of 1 week) towards the GM temperature and salinity fields was imposed.
Note that the tracer and velocity data produced by the GM simulation, forced by climatological atmospheric fluxes, are not climatological data, since they contain the large mesoscale eddies. An ensemble mean on each month of a multi-annual GM simulation would be necessary to filter out these eddy structures without smoothing the seasonal cycle. Consequently, some mesoscale eddies are present in the ini-tial state and in the open-boundary forcing of the RM. The former is not a problem, since new eddies are created during a spin-up phase of approximately two months, owing to the adjustment of the initial field to the dynamics and topogra-phy of the RM. The latter may induce spurious effects. Con-sider the case of an eddy which slowly propagates along or across one of the open boundaries of the RM domain during the year. When this open-boundary forcing is used repeat-edly to force the RM for several years, a discontinuity in the open-boundary forcing (which is partially smoothed by the temporal interpolation between monthly averages) occurs at the end of the year. This may have an impact on the dynam-ics near the open boundary, even though we did not estimate it (only one year of GM data was provided).
Different open-boundary formulations were used for ve-locity and tracers. The barotropic stream function was spec-ified along the open boundary, as in Stevens and Johnson (1997). The baroclinic velocity was also specified at the open boundary. Temperature and salinity values were spec-ified in the case of inflow into the RM domain, whereas an upstream advection scheme was used in the case of outflow. This allows tracer boundary values to evolve when fluid is advected out of the RM domain. This formulation of the open-boundary conditions was found to be efficient and did not produce artifacts in the circulation. The introduction of an Orlanski-type radiation scheme (Orlanski, 1976) was not necessary.
The Rhone River runoff was introduced into the RM via a constant precipitation flux of 1000 m3/s into one RM grid cell located at the river mouth. Seasonal variations in the river flux were not taken into account. An upstream advec-tion scheme for tracers was used in the vicinity of the river mouth. This runoff was introduced differently in the GM: the GM surface salinity was relaxed towards the climatolog-ical MED5 surface salinity, in which the Rhone signature is apparent over the whole Gulf of Lions’ shelf.
The RM was initialised on 1 January, year I, with the GM temperature, salinity and velocity. Open-boundary values were interpolated linearly in time for each RM model time step. During the first 10 days, a time step of 6.7 min was used, to allow the propagation of short-scale inertia-gravity waves generated by the adjustment of the dynamics to the ini-tial state. During the rest of the simulation period (3 years), the model was run with a time step of 20 min.
4 Results
4.1 Adjustment of the RM dynamics during the spin-up phase
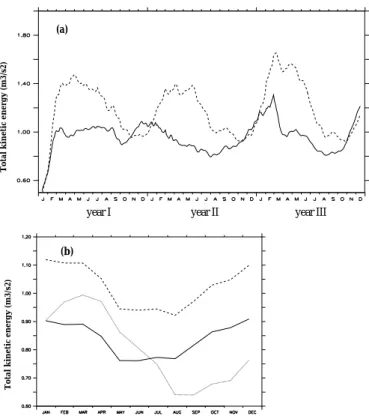
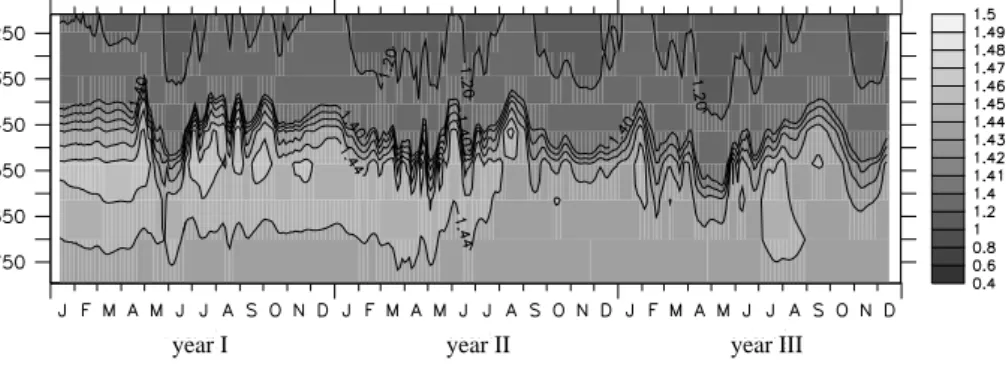
During a two-month period following the initialisation (here-after referred to as the spin-up phase), the density and veloc-ity fields adjust to the RM topography, spatial resolution and dynamics, which are different from those of the GM. The total kinetic energy in the top 100 m of the water column approximately doubles in the RM during the spin-up phase. Starting from an initial value of 0.5 m3/s2, which corresponds to the GM initial state interpolated on the RM grid, it reaches 1 m3/s2at the end of February. During the rest of the sim-ulation, it oscillates between 0.8 m3/s2and 1.4 m3/s2, show-ing a clear seasonal cycle with minimum values in summer (Fig. 1a). Note that these energy values are relatively close to those of the GM (Fig. 1b). However, this result is very sensitive to the vertical resolution of the GM grid.
A cyclonic gyre covers the entire basin at the initial time (1 January). At the end of the spin-up phase, several mesoscale eddies have appeared in the RM (Fig. 2). Meandering of the current around the cyclonic gyre has been generated by baroclinic instability which is able to develop in the RM. Cy-clonic eddies are generated all around the gyre. The intense
000 000 111 111 00 00 11 11 00 00 11 11
year II year III year I
(a)
(b)
Total kinetic energy (m3/s2)
Total kinetic energy (m3/s2)
Fig. 1. Temporal evolution of the total kinetic energy vertically
inte-grated, horizontally averaged, and normalized by the mean density
ρ0. (a) RM model. Full line: integration between 0 and 100 m; dashed line: integration between 100 m and 500 m. (b) GM model. Full line: integration between 0 and 105 m; dash-dotted line: inte-gration between 0 and 140 m, dashed line: inteinte-gration between 105 and 500 m.
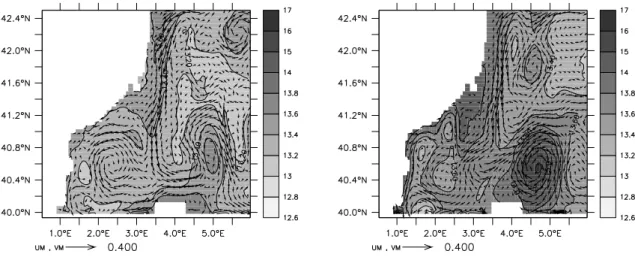
anticyclonic eddy (denoted A in Figs. 2 and 3) northwest of Sardinia, whose signature is evident in the annual mean barotropic stream function of the GM, is present in the RM (Figs. 2 and 3). A cyclonic eddy has developed in the Gulf of Genoa. At the end of the spin-up phase, the boundary cur-rents in the RM are narrower, as shown by the close-packed isolines in Fig. 2.
In the following subsections, we describe and analyse the large-scale and mesoscale circulation in several regions in the basin. We first briefly describe the GM results and com-pare them with the RM results, focusing on the large-scale circulation.
4.2 Large-scale circulation 4.2.1 In the GM
The large-scale cyclonic gyre represented in Fig. 3a is present in the GM during the entire year. The mean an-nual transport of this gyre is 3 Sv, and three smaller cyclonic gyres with radius of ∼75 km and transport ∼0.5–1 Sv coexist within the large gyre. Between these cyclonic gyres, a small anticyclonic gyre of ∼0.5 Sv is located northeast of Minorca (the land area near 4◦E 40◦N indicated in Fig. 2). This
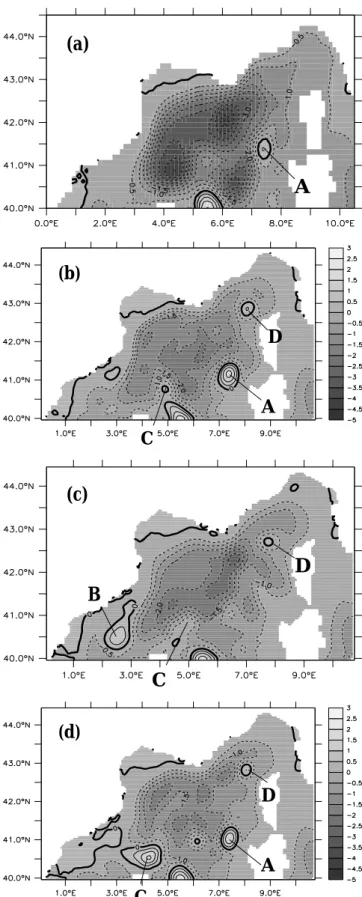
an-284 V. Echevin et al.: Simulation and analysis of the mesoscale circulation Eastern Algero Minorca Rhone Gulf of Valencia Corsica Sardinia A Gulf of Lions (3) (2)Ligurian Sea (4)Catalan sea Eastern Algero Provencal basin (1) Gulf of Genoa
Fig. 2. Barotropic stream function of the RM model on 3 March,
year I. Isoline units are in Sverdrups (Sv), at 0.5-Sv intervals. Four sub-regions, (1), (2), (3), (4) are delimited by dashed lines. (A) denotes an anticyclonic eddy.
ticyclone may have been forced by the northwesterly wind-stress curl at this location, referred to by Millot (1999).
The Sardinian current, which flows northwards along the west coast of Sardinia and Corsica (Millot, 1987), is not trapped near the Sardinian West Coast in the GM. It mean-ders to the west near 7◦E 41.5◦N, owing to the presence of an intense anticyclonic eddy (A in Fig. 3a). A diffuse flow crosses the west Ligurian Sea towards the Provence coast in-stead of following the Corsican coast, as formerly described (Millot, 1987). There it merges with the eastern Corsican current (hereafter referred to as ECC), which flows from the Tyrrhenian Sea into the Ligurian Sea through the Corsican channel, and along the Ligurian coast.
These two currents form the north current (hereafter re-ferred to as NC), east of ∼6◦E–7◦E. It flows along the Gulf of Lions’ shelf break, impinges on the Catalonian coast, leaving it again south of 41.5◦N instead of following the coast farther south, as described by Millot (1987) and Font et al. (1995). This current (now named the Balearic current, hereafter BC) veers eastwards north of Minorca. Most of the NC-BC flow (∼2 Sv) recirculates in the basin-scale cyclonic gyre; little of it (less than 0.5 Sv) flows southwards between Minorca and the Catalonian coast.
4.2.2 In the RMM
Many similar features are evident in the RM annual mean barotropic stream function. The intensity of the large-scale gyre is weaker (∼1.5–2 Sv; Figs. 3b–d) than in the GM (3 Sv; Fig. 3a). The anticyclonic eddy (A) northwest of Sardinia, also present in the GM, is particularly intense during year I (1.5–2 Sv) and year II (1.5 Sv), weaker in year III (less than 0.5 Sv) (Figs. 3b–d). The most striking difference from the GM is the presence of mesoscale eddies in the Catalan Sea in year II (eddy B), north of Minorca (eddy C) and northwest of
A
A
D
C
D
A
C
D
B
C
(a)
(b)
(c)
(d)
A
A
D
C
D
A
C
D
B
C
(a)
(b)
(c)
(d)
A
A
D
C
D
A
C
D
B
C
(a)
(b)
(c)
(d)
A
A
D
C
D
A
C
D
B
C
(a)
(b)
(c)
(d)
Fig. 3. Annual mean barotropic stream function for: (a) the GM; (b)
the RM, year I; (c) year II; (d) year III. Isoline units are in Sverdrups (Sv), 0.5-Sv intervals. (A), (B), (C) and (D) denote eddies.
Corsica (eddy D) during the three years. This mesoscale ac-tivity will be discussed in detail in the following subsections. 4.3 Mesoscale circulation
We divided the RM domain into four subdomains, as shown in Fig. 2.
4.3.1 Eastern Algero Provenc¸al basin (6◦E–9◦E, 40◦N– 43◦N, region (1) in Fig. 2)
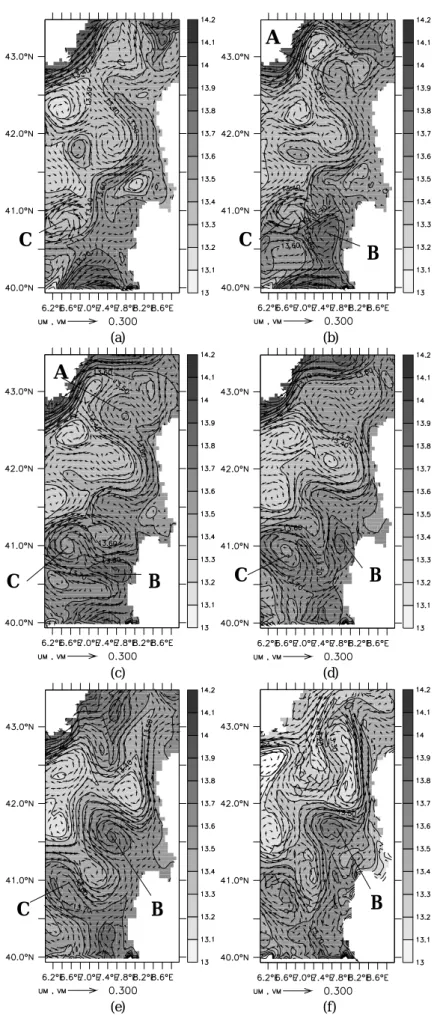
The west Corsican current (hereafter WCC), which flows northwards along the east Sardinian and Corsican coasts (Millot, 1987), is highly unstable in the RM. It can be iden-tified as a 50-km-wide current with large-scale meanders which can deflect the current as far as 150 km off the coast. Anticyclonic eddies (denoted A and B in Fig. 4) are gen-erated by the instability of the WCC. After their forma-tion, these deep eddies are trapped by topography and form quasi-permanent features of the mesoscale circulation. In the southern part (∼41◦N), anticyclonic eddies (denoted B) are generated by the inflow of warm water (T ∼ 13.8◦C) com-ing from the Algerian basin. These warm eddies may in-teract with anticyclonic eddies propagating eastwards from the Catalan Sea. As shown in Fig. 4b, a warm eddy (B) is squeezed against the Sardinian coast by eddy C which comes from the west. Then eddy B propagates along the shelf break between 40.5◦N and 41◦N (Figs. 4c and d), trapped by the topographical beta effect, and detaches from the coast north of 41◦N (Figs. 4e and f). Since eddy B reaches the bot-tom of the Mediterranean Sea, its trajectory is strongly con-strained by the bottom topography. It cannot propagate north of 42.5◦N, because of the topographic rise from 2700 m to 2500 m near 7◦E 42.5◦N. The same occurs for eddy A which cannot propagate north of 43◦N, also because of the topo-graphic rise from 2500 m to 2300 m. The size (∼50 km) of the eddies of type B is in good agreement those observed in the sea-surface temperature data by Wald (1985) and Millot (1991).
A potential mechanism is baroclinic instability. It is favoured by the high resolution of the RM which resolves the first radius of deformation. Another effect may be the width of the current flowing into the RM domain at the south-ern open boundary. This specified current is relatively wide, owing to the low resolution of the GM and to the monthly averaging of the GM outputs. However, the use of a higher temporal sampling (weekly instead of monthly) at the south-ern open boundary imposes a thinner northward current, but does not change significantly the mesoscale variability in the region. Furthermore, a qualitatively similar mesoscale vari-ability was observed in a 1/16◦·1/16◦MERCATOR model of the whole Mediterranean Sea (K. B´eranger, personal com-munication). This tends to demonstrate that the influence of the southern open boundary on the results is not crucial.
Other processes related to the instability of the Levantine Intermediate Water (LIW) vein, which flows along Sardinia, may generate mesoscale variability in this region. First, the
LIW vein advected northwards into the RM domain is un-stable, because of the adjustment to the RM’s smaller-scale dynamics. Second, this intermediate water vein may become unstable and generate lenses at low Rossby numbers (Sadoux et al., 2000), which is the case in the RM and GM simulation (Ro = U/f L ∼ 10−2). Last, “leddies” (LIW eddies) can
be generated southwest of Sardinia (near 7.5◦E 39◦N) when the LIW vein turns from flowing westwards to northwards, in order to balance the zonal momentum budget (Pichevin and Nof, 1996). These “leddies” then propagate northwestwards under the combined effects of advection, which is governed by the mean flow, planetary vorticity and topography. They enter the RM domain between 6◦E and the coast of Sardinia. This process may generate another source of mesoscale vari-ability in the RM.
Near the north Corsican coast (8.8◦E 42.5◦N), the WCC
remains offshore most of the time (Fig. 4). It is de-flected westwards by a quasi-permanent anticyclonic eddy (A, Fig. 4) and may split into two branches: the west branch, reaching the Provence coast near 6◦E 42.6◦N; and the east branch, following the coast of north Corsica near 43◦N (Figs. 4d and e).
4.3.2 The Ligurian Sea (6◦E–11.5◦E, 42.8◦N–44.5◦N, re-gion (2) in Fig. 2)
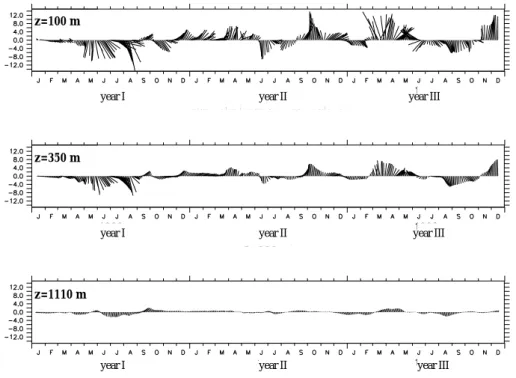
Mesoscale activity in the Ligurian Sea is compared to mea-surements of the 1981–1982 DYOME experiment (Taupier-Letage et Millot, 1986; hereafter referred to as TLM86). Based on current measurements at several sites, these au-thors showed that baroclinic mesoscale activity (limited to the top 300 m) was quasi-permanent in the southern Ligurian Sea during this period (Fig. 3 of TLM86). It is also the case in the RM, as shown by the stick-vector plot at point A north-east of Corsica (see Fig. 6a) in Fig. 5. The mesoscale currents are less intense in the RM than in the observations, especially in winter. This relatively low mesoscale activity is likely due to the climatological forcing, which does not include wind burst and associated cooling events. Closer to the shelf break along the Corsican coast, the RM currents and the TLM86 observations are in relatively good agreement. Both display an along-slope baroclinic coastal WCC, oriented to the north-east in the southern part (point B in Fig. 6a), and to the north in the northern part (point C in Fig. 6a; not shown). The surface velocities are ∼5 cm/s weaker in the model.
The circulation in the eastern and northeastern Ligurian Sea is linked to the east Corsican current (ECC). Its transport through the Corsica channel in the RM is highly constrained by the GM transport values. The magnitude of the annual mean transport is in good agreement (0.5 Sv) with observa-tions (0.36 Sv) in the GM (and consequently in the RM). The amplitude of the seasonal cycle is weaker in the model but in phase with the observations (Fig. 7). This may be due to the smooth ECMWF wind forcing, since this transport has been shown to be mostly wind forced (Herbaut et al., 1997).
Descriptions of the circulation in the northern Ligurian Sea (north of 43.5◦N) are scarce. The ECC has been described
286 V. Echevin et al.: Simulation and analysis of the mesoscale circulation
C
C
C
B
B
A
A
B
B
C
C
B
(a)
(b)
(c)
(d)
(e)
(f)
C
C
C
B
B
A
A
B
B
C
C
B
(a)
(b)
(c)
(d)
(e)
(f)
(a) (b)C
C
C
B
B
A
A
B
B
C
C
B
(a)
(b)
(c)
(d)
(e)
(f)
C
C
C
B
B
A
A
B
B
C
C
B
(a)
(b)
(c)
(d)
(e)
(f)
(c) (d)C
C
C
B
B
A
A
B
B
C
C
B
(a)
(b)
(c)
(d)
(e)
(f)
C
C
C
B
B
A
A
B
B
C
C
B
(a)
(b)
(c)
(d)
(e)
(f)
(e) (f)Fig. 4. Monthly mean temperature
(shaded, in ◦C) and velocity (arrows, in m/s) at 100 m in: (a) August; (b) September; (c) October; (d) November;
(e) December of year II; (f) January of
00000000000000 00000000000000 00000000000000 00000000000000 00000000000000 11111111111111 11111111111111 11111111111111 11111111111111 11111111111111 00000000000000 00000000000000 00000000000000 00000000000000 00000000000000 11111111111111 11111111111111 11111111111111 11111111111111 11111111111111 0000000000000 0000000000000 0000000000000 0000000000000 0000000000000 0000000000000 1111111111111 1111111111111 1111111111111 1111111111111 1111111111111 1111111111111 z=100 m z=1110 m z=350 m year I year I year I year II year II year II year III year III year III
Fig. 5. Stick-vector plot at point A (8.6◦E 43◦N; see Fig. 6a) in the Ligurian Sea for three depths: 100 m, 350 m, 1110 m.
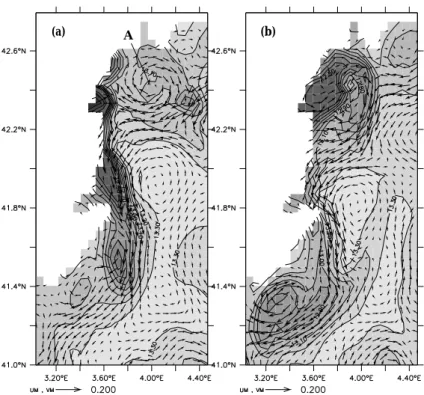
E
(a)
(b)
A B C
Fig. 6. Temperature (shaded, in◦C), velocity (arrows, in cm/s) at 50 m, and bottom topography (isobaths) in the Ligurian Sea in: (a) June,
year I; (b) December, year I. A, B and C denote locations of the current meters during the PRIMO-0 experiment (Taupier-Letage and Millot, 1986). (E) denotes an anticyclonic eddy. 300-m, 500-m, 1000-m, 1500-m, 2000-m, 2500-m isobaths are also plotted.
as a coastal current (Millot, 1987) which follows the coast of the Gulf of Genoa throughout the year. It is the case in the GM, but the variability of the ECC is strong in the RM. First, the ECC cannot be identified as a single current. It splits into several veins north of 43.5◦N. In spring and summer, the main vein north of the Corsica channel is oriented to the northwest until it reaches the Provence coast (Fig. 6a). This behaviour is reproduced every year. The circulation on the Ligurian shelf is quite variable. A northward flow along the coast can be identified in Fig. 6a. This flow displays mean-ders in winter and spring. Between the end of summer and the beginning of winter, i.e. when the northward transport of
the ECC is low, the ECC forms a single vein which spreads over the wide shelf (Fig. 6b).
An anticyclonic eddy of ∼50-km diameter (denoted E in Fig. 6a) develops in the Gulf of Genoa each year at the end of spring. This baroclinic (∼600 m deep) eddy may be due to the instability of the ECC vein. Note that the very steep bottom slope, indicated by the closely packed isobaths, may trap the flow. The eddy dissipates in early or late summer, depending on the year. A similar type of eddy was also sim-ulated by the MERCATOR model which uses the same bot-tom topography as the RM (K. B´eranger, personal commu-nication). A small-scale structure containing Winter
Inter-288 V. Echevin et al.: Simulation and analysis of the mesoscale circulation
0.0
0.2
0.4
0.6
0.8
transport (Sv)
Fall Winter Spring Summer
Fig. 7. Northward transport through the Corsica channel at 42.5◦N.
Light-shaded values correspond to measurements (Astraldi and Gasparini, 1992); dark-shaded values correspond to GM and RM values.
mediate Water (WIW) has been observed at the same loca-tion in spring 1991 (Gasparini et al., 1999). An anticyclonic sea-level anomaly was also evident in Topex/Poseidon (T/P) and Earth Resources Satellite I (ERS-1) altimetric data dur-ing the period January–June 1993 (Ayoub, 1997). However, more observations are needed and the processes that could generate this type of eddy remain to be confirmed.
4.3.3 The Gulf of Lions (93◦E–6◦E,42◦N–43.5◦N, region (3) in Fig. 2)
The North current (NC), which is formed by the convergence of the ECC and WCC in the Ligurian Sea (Millot, 1987), flows along the Provence coast east of ∼5.3◦E and leaves the coast where the shelf break widens. The circulation in the Gulf of Lions is oriented southwestwards by this current (Millot, 1990). The westward flow on the shelf is enhanced by freshwater input by the Rhone River plume. On the shelf, nearshore mesoscale activity is due to coastal upwelling cells forced by the mistral and tramontane winds (Millot, 1979). Offshore, mesoscale activity is associated with the meander-ing of the NC due to baroclinic instability (Conan and Millot, 1995; Flexas et al., 2002).
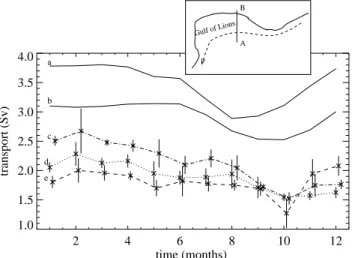
The NC displays realistic features in the RM. The baro-clinic transport of the NC through a meridional section at 5◦E is plotted in Fig. 8. Its annual mean (1.9 Sv with an interannual variability of ±0.1 Sv) and seasonal cycle (maxi-mum transport in winter (∼2.2 Sv) and mini(maxi-mum in summer (∼1.7 Sv)) are in relatively good agreement with previous es-timations (Alb´erola et al., 1995; Conan et al., 1995; B´ethoux et al., 1988). Though it agrees more closely with the obser-vations, the transport of the NC in the RM is still ∼0.5–1 Sv too high. This may be due to the relatively large width of the current which is ∼25 km in the observations (Alb´erola et al., 1995), ∼40 km in the RM, and ∼70 km in the GM and to the high ECC transport in both the GM and the RM. Due to the high spatial resolution of the RM, the baroclinic instabil-ity of the NC is able to develop. Meanders of length scales ranging between ∼30 and 110 km propagate southwestwards along the Ligurian coast and the Gulf of Lions’ continental
2 4 6 8 10 12 time (months) 1.0 1.5 2.0 2.5 3.0 3.5 4.0 transport (Sv) a b d c e B A Gulf of Lions
Fig. 8. Westward transport of the NC through a section (A-B) north
of (5◦E 42.2◦N) for the GM (full line) and the RM (dotted line: year I; dashed line: year II; dash-dotted line: year III). Error bars correspond to the standard deviation of the transport calculated from 3-day-mean transport values.
slope (Fig. 9). This range of spatial scales has been observed by Cr´epon et al. (1982) in the Ligurian Sea and by Flexas et al. (2002) in the Gulf of Lions. The phase velocity esti-mated from Figs. 9a and b is ∼3–5 cm/s. This value is low compared with that inferred from early winter observations of sea-surface temperature (SST; Cr´epon et al., 1982) and velocity measurements (Flexas et al., 2002). However, the phase speed of the baroclinic waves is very sensitive to the vertical velocity shear (Tang, 1975) and to the model’s verti-cal discretisation (Griffiths et al., 2000).
Spectra of the RM current velocity in the Gulf of Lions’ shelf break region have been compared with the results of the March–May 1997 High-Frequency Flux Experiment (Flexas et al., 2002). The spectra display a high level of energy at periods lower than 30 days and in the 15–20 day band. At higher frequencies, no energy was found. This contrasts with previous observations (Flexas et al., 2002; Alb´erola et al., 1995) which show strong mesoscale activity at shorter time periods, namely at 3.5 days and 7 days.
This result can be explained as follows. The propagation of the NC meanders in the RM is quite slow compared to that of the observed instabilities, and this leads to a shift of the mesoscale variability spectrum towards lower frequen-cies. Furthermore, the resolution of the RM (∼4.9 km at 43◦N) is not sufficient to resolve the first Rossby radius of deformation in the Gulf of Lions during the winter season. The energy near 3.5 days corresponds to small-scale mean-ders (Alb´erola et al., 1995) which are not resolved by the RM dynamics.
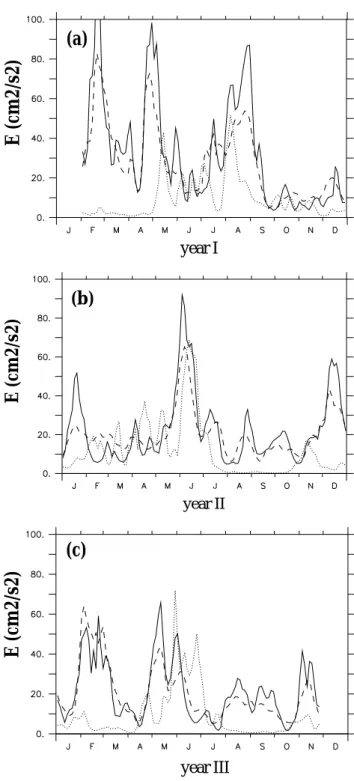
An index of “regional” mesoscale activity was calculated to study seasonal variations (Fig. 10). The eddy kinetic-energy field was calculated from the RM velocity field at 100 m depth, and was spatially averaged in three different areas (Fig. 9a). The mesoscale activity displays strong
intra-(1) (2)
(3)
(1) (2)
(3)
Fig. 9. RM sea-surface height (shaded, in cm) and isolines for three
dates: t0; t0+ 10 days; t0+ 20 days. (a) t0 = 31/07, year I; (b)
t0=19/05, year III. Three areas are delimited by dashed lines.
seasonal and seasonal variability. A clear annual cycle could not be observed over the three years of simulation. Intense mesoscale activity in the Gulf of Lions occurs in the winters of year I (Fig. 10a) and year III (Fig. 10c), but not during year II (Fig. 10b). Mesoscale activity occurs in summer during year I, but shifts towards spring in the other years. The high mesoscale activity in the Gulf in spring-summer is correlated in time with that in the Ligurian Sea. This is not the case in winter, especially in year III of the simulation, which indi-cates that meandering of the NC in this period is not linked to a remote forcing in the Ligurian Sea. It occurs locally in the Gulf of Lions east of ∼6.5◦E and it is reinforced by dense-water formation taking place in the Gulf in winter (see, Sect. 4.7). This process, linking mesoscale variability of the NC and dense-water formation offshore, has been observed by Alb´erola et al. (1995).
4.3.4 Catalan Sea (region (4) in Fig. 2)
Since the Gulf of Lions’ shelf width decreases near the Cat-alonian coast, the NC remains trapped along the coast (Mil-lot, 1987). In the GM, the NC separates from the Catalo-nian coast near 3◦E 41.5◦N and flows southwards towards
000 000 000 111 111 111 0000 0000 0000 1111 1111 1111 000 000 000 111 111 111
year I
year II
year III
E (cm2/s2)
E (cm2/s2)
E (cm2/s2)
(a)
(b)
(c)
000 000 000 111 111 111 0000 0000 0000 1111 1111 1111 000 000 000 111 111 111 year I year II year IIIE (cm2/s2)
E (cm2/s2)
E (cm2/s2)
(a)
(b)
(c)
000 000 000 111 111 111 0000 0000 0000 1111 1111 1111 000 000 000 111 111 111year I
year II
year III
E (cm2/s2)
E (cm2/s2)
E (cm2/s2)
(a)
(b)
(c)
Fig. 10. Eddy kinetic energy (in cm2/s2) calculated from the RM
velocity field at 100 m depth, and averaged horizontally over three different areas indicated in Fig. 8: (1) the Gulf of Lions’ shelf break (4◦E–5◦E 42.4◦N–43◦N), full line; (2) the Gulf of Lions (3.5◦E–5.5◦E 42◦N–43.5◦N), dashed line; (3) the north Ligurian Sea (7.8◦E–8.4◦E 43.6◦N–44.2◦N), dotted line. (a) year I, (b) year II, (c) year III.
Minorca (Fig. 3a). This behaviour is reproduced in the RM owing to the GM forcing at the southern open boundary. Pre-vious observations (Font et al., 1995; Millot, 1987; Pinot et al., 2002) described an NC which flows along the shelf as
290 V. Echevin et al.: Simulation and analysis of the mesoscale circulation 000000 000000 000000 000000 000000 000000 111111 111111 111111 111111 111111 111111 00000 00000 00000 00000 00000 00000 11111 11111 11111 11111 11111 11111 (a) (b)
Fig. 11. Temperature (shaded, isotherms every 0.2◦C) and velocity (arrows, in m/s) at 100 m in the northern Balearic Sea. (a) August, year
I, (b) December, year II.
far south as 40◦N. Consequently, the mean flow of the NC and its mesoscale variability along the Catalonian coast near (1.35◦E 40.7◦N) are low compared with observations (Font et al., 1995).
However, mesoscale activity offshore is intense in the RM. Several cyclonic and anticyclonic eddies are generated by the baroclinic instability of the NC south of 41.6◦N as it leaves the Catalonian coast (Fig. 11). Anticyclonic eddies are formed near the coast when the NC meanders and detaches from the shelf break. These eddies propagate downstream; the small ones (∼40 km) are absorbed by the mean NC cur-rent, the largest one (∼60 km) propagates southwards until it reaches the southern open boundary and dissipates within
∼1 year.
One such anticyclonic eddy was observed in the Gulf of Valencia near the coast at ∼40.5◦N (Font et al., 1995). In-tense eddies may propagate as far south as the Ibiza channel (38.6◦N; Pinot and Ganachaud, 1999). The presence of the southern open boundary at 39.9◦N may have some influence on the dynamics of these eddies, and prevent them from prop-agating southwards. This eddy activity results in an eastward displacement and detachment of the NC from the Catalonian coast.
South of the separation from the Catalonian coast, the NC is deflected eastwards and forms the Balearic current (here-after referred to as BC). The BC path is strongly perturbed by eddies that develop northeast of Minorca. The first type of anticyclonic eddy is generated in summer by the instability of the BC (Fig. 11a) and may be enhanced by the wind shear in summer (Millot, 1999). It propagates northeastwards and crosses the basin. A large (∼60–80 km) anticyclonic eddy is formed east of Minorca, owing to the northward flow of warm water in late summer-early winter (Fig. 11b). This eddy interacts with the mean eddy field and remains in the same area (between 3◦E and 6◦E, south of 41.2◦N) during the rest of the simulation (∼2 years). Note that the eddy is relatively close to the southern open boundary, which may
influence its dynamics.
4.4 Influence of Rhone River runoff
We complete this description of the surface mesoscale cir-culation in the RM with an analysis of the influence of the Rhone River runoff. Freshwater input from the Rhone River mouth (at 5◦E 43.2◦N) was simulated in the RM, as de-scribed in Sect. 3. In the RM, this water has a clear signature on the surface-salinity field, and its influence can be observed as far south as ∼40.5◦N at the end of summer (Fig. 12a). The
extent of the freshwater plume varies seasonally and depends on the wind-stress magnitude and the surface circulation. In winter and spring, the surface fresh water (characterised by a salinity lower than 37 PSU in the RM) is confined to the shelf. The plume extends over ∼50 km southwestwards of the river mouth. The thickness of the surface fresh layer (S<37 PSU) is ∼15 m deep, owing to vertical mixing by the wind. In late spring the wind strength decreases, the plume spreads westwards and reaches the Roussillon coast near 3◦E 42.8◦N. Its depth decreases and is confined to the first layer. The shallow, 6-m-deep plume follows the coast as far south as 1.5◦E 40.5◦N (Fig. 12a). At the beginning of autumn, the wind stress rises and relatively fresh surface waters are mixed, so that low-salinity values are no longer observed south of the Gulf of Lions.
Over the Gulf of Lions, the seasonal cycle of the RM sur-face salinity is in phase with that derived from climatological observations (MEDATLAS; Brasseur et al., 1996). It reaches minimum values in spring (37.1–37.2 PSU, in the observa-tions; 36.4 PSU, in the RM) and maximum in late autumn (37.7 PSU, in the observations; 37.4 PSU, in the observa-tions). During the winter-1998 FETCH experiment, surface-salinity values of ∼37.2 PSU, off the river mouth, and of
∼37.5–37.6 PSU, at 50 km southwestwards from the river mouth, have been measured (Estournel et al., 2001). These values are significantly higher than those in the RM, whether a seasonal cycle or a constant value of the river discharge is
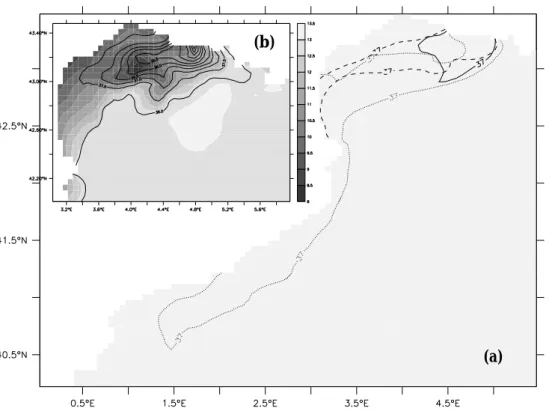
(a)
(b)
Fig. 12. (a) Extension of the fresh surface waters (delimited by the 37 PSU isohaline) in January (full line), March (dashed line), July (dotted
line) of year II. (b) Sea-surface temperature (shaded, values between 8◦C and 13.5◦C at intervals of 0.5◦C) and salinity (isohalines between 33 and 38 PSU at intervals of 0.5 PSU ) in February, year II.
introduced into the model. This bias is caused by the atmo-spheric forcing, which does not include intense wind bursts and thus prevents vertical mixing of the fresh surface wa-ter with underlying salty wawa-ter. Some salinity measurements have confirmed the presence of relatively fresh surface water south of Cape Creus. Low-salinity water (S<37.5 PSU) has been observed recently off the coast of Barcelona in sum-mer (Salat et al., 2000). Chlorophyll-rich water has been ob-served as far south as Cape Creus (42.3◦N) in SeaWiFS (Sea-viewing, Wide-Field-of-view Sensor) colour data (L. Gross, personal communication). This turbid water was advected southwestwards from the Rhone River mouth; it may have contained a low-salinity signature, but information on sur-face salinity cannot be inferred from these satellite data. The freshwater output of the Rhone River has an impact on the air-sea heat exchange. Fresh water at the surface creates a strong stratification in the top ∼10 m of the water column, which inhibits vertical mixing. During winter, the surface water, which cannot mix with underlying water, becomes cooler and cooler. Very low temperatures are reached in the surface layer of the RM. This is confirmed by the spatial correlation between low SST (T<10◦C) and low sea-surface salinity (S<36.5 PSU) patterns in January (Fig. 12b). Even though this process is likely to occur, the magnitude of this effect is very strong in the model due to the strong stratifica-tion near the surface.
In the following sections, we focus on the RM circulation of the Levantine Intermediate Water between 200 and 700 m
depth, and of the dense water formed in winter, the Winter Intermediate Water (WIW).
4.5 Levantine Intermediate Water (LIW) circulation In situ measurements show that LIW, which is formed in the Eastern Mediterranean basin, flows cyclonically around the Liguro-Provenal basin coasts. A LIW vein trapped along the shelf break circulates west of Sardinia, follows succes-sively the west Corsican, the Ligurian, the Provence coasts, the Gulf of Lions’ shelf break, and the Catalonian coast (Mil-lot, 1987).
In the GM, the LIW found in the basin is slightly less saline (38.4 PSU) and too deep relative to the climatology (38.45 PSU). Near the coast, the LIW vein follows the cy-clonic path previously described. A LIW vein of ∼50 km width follows the coasts at ∼300–400 m depth, depending on the location. The maximum salinity values in the core of the vein are 38.4–38.5 PSU, the maximum temperature in the vein varies between 13.5◦C and 13.7◦C. In the RM, the T and S maxima which characterise the LIW vein are quite well marked. Off the Provence coast the LIW vein is identified by a salinity (respectively, temperature) maximum of 38.44– 38.45 PSU (resp. 13.3–13.4◦C) (Fig. 13). In situ measure-ments off Nice (∼7◦E) and Marseille (∼5.5◦E) show higher salinity (38.52–38.56 PSU) and temperature (13.3–13.5◦C) values (Alb´erola et al., 1995, Conan and Millot, 1995). How-ever, the maximum values of LIW tracers decreased during
292 V. Echevin et al.: Simulation and analysis of the mesoscale circulation 0000 0000 0000 1111 1111 1111 0000 0000 0000 1111 1111 1111 00000 00000 00000 11111 11111 11111
year I year II year III
Fig. 13. Temporal evolution of the vertical profile of the salinity anomaly (1S = S − 37.0, shaded, isohalines in PSU) near the coast of Nice
(7.5◦E 43.3◦N–43.5◦N). Isohalines are spaced so as to better show the location of the LIW vein flowing along the coast.
000 000 000 000 111 111 111 111 000 000 000 000 111 111 111 111 0000 0000 0000 0000 1111 1111 1111 1111
year I year II year III
Fig. 14. Temporal evolution of the vertical profile of temperature (shaded, isotherms in◦C) in the central Gulf of Lions (5◦E 41.5◦N–42◦N).
years II and III in the RM (Fig. 13).
The differences between the GM and RM in respect of LIW may be explained as follows. First, different vertical diffusivities are used in the GM and RM. The GM uses con-stant vertical diffusivities and the RM a turbulent kinetic-energy scheme (Blanke and Delecluse, 1993). Consequently, the T and S maxima have decreased, owing to the effect of the RM vertical mixing, and the depth of the LIW vein has slightly increased from ∼400 m in the GM (not shown) to
∼500 m in the RM (Fig. 13). Second, the high variability of the mesoscale circulation near the southern open bound-ary of the RM, where the LIW vein flows northwards, may enhance mixing of LIW with other water masses. Indeed, mesoscale eddies (such as those described in Sect. 4.3) may perturb the LIW vein near the Sardinian coast and advect LIW westwards into the deep ocean (Millot, 1991, Fuda et al., 2000).
4.6 Winter Intermediate Water (WIW) circulation
WIW (T ∼ 12.5–13◦C, S ∼ 38.1–38.3 PSU) is formed dur-ing the winter, mainly in the north Liguro-Provenc¸al basin, when the surface cooling is moderate, so that the cooled Mediterranean Atlantic Water (MAW) does not mix with the underlying LIW which is soon capped by the warmer and less dense MAW, and, therefore, does not interact with the atmo-sphere anymore. WIW formation has been observed several times in the northwestern Mediterranean basin (Alb´erola et al., 1995; Conan and Millot, 1995; Fuda et al., 2000).
In the central Gulf of Lions, WIW is produced due to a relatively shallow convection in the RM (∼300 m, year I,
∼200 m, years II and III; Fig. 14). The WIW temperature is ∼12.8◦C at the time of formation (end of March). Note that the layer of WIW is thicker during the first winter. This is probably due to the adjustment of the water column to the mixing in the RM. When the thermocline starts to develop at the end of March, WIW is mixed with the underlying LIW and with the overlying MAW. Its temperature reaches
∼13.1–13.2◦C at the end of summer. The salinity of the WIW is ∼38.15–38.25 PSU. These values are in good agree-ment with reported WIW characteristics (Fuda et al., 2000).
WIW formation along the northern coast of the Liguro-Provenal basin, between Cape Creus (3◦E 42◦N) and the
Gulf of Genoa (9◦E 44◦N), is quite similar to what occurs in the central part of the Gulf of Lions. The main difference is due to the cyclonic circulation, which advects WIW formed near the coast and traps it in the centre of the gyre. Due to the doming of the isopycnals in the central zone, vertical mixing of WIW with surface waters is enhanced, and the low tem-perature signature of WIW is lost more rapidly in the central zone.
Let us now describe more precisely the fate of the WIW formed over the Gulf of Lions’ shelf. There, cold (T < 12.5◦C) WIW was advected southwestwards by the mean surface flow. Owing to gravity and to the reduced shelf width, dense water cascaded in the deep ocean near 3.5◦E 42.4◦N (north of Cape Creus) and reached maximum depths of ∼600 m. Then cold (T ∼ 12.8◦C) and fresh (S ∼ 38 PSU)
A
(a) (b)
Fig. 15. Temperature (shaded, isotherms in◦C) and velocity (arrows, in cm/s) at 400 m in the western Gulf of Lions and northern Catalan Sea on: (a) 12 March, year II; (b) 22 March, year II. Isotherms are between 12.5◦C and 13.3◦C at intervals of 0.1◦C. A denotes an anticyclonic eddy propagating westwards with the NC flow.
WIW lenses were formed and advected by the NC flow. Mesoscale activity in the NC may trap water in the Gulf of Lions. In February of years I and II, large-scale (∼50 km) meanders of the NC propagated southwestwards. An anticy-clonic eddy (denoted A in Fig. 15a) was advected westward near the shelf break, close to the area of cascading. The eddy displaced the NC offshore and the nearshore flow advected WIW northwards. Most of the WIW was trapped in the west-ern part of the Gulf of Lions and eventually a filament of WIW was advected southwestwards by the NC (Fig. 15b).
Three WIW lenses, which detached from the coast south of 41.8◦N, were observed in March of year II (Fig. 15a).
These lenses become weddies (Winter Intermediate Water eddies). They became completely detached from the NC flow, propagated southwards and generated a complex eddy field in the Catalan Sea (see Sect. 4.3.4). Then WIW mixed with surrounding warmer water and may be trapped by ed-dies northeast of Minorca (Fig. 11b).
4.7 Absence of Western Mediterranean Deep Water (WMDW) formation
In neither of the GM and RM simulations was Western Mediterranean Deep Water formed in the Gulf of Lions. Several effects may explain this result. First, the salinity of the LIW in the GM (and consequently, in the RM) is
∼38.4 PSU, which is a lower value than that of the clima-tology (38.45 PSU). Moreover, the depth of the LIW layer is slightly greater in the numerical models (∼500 m) than in the observations (∼400 m). In a study using the same model (MOM) as the GM, but with a lower resolution (1/4◦), Castel-lari et al. (2000) corrected the lack of realism with respect to
LIW, by relaxing the model’s winter surface-salinity in the Gulf of Lions’ gyre towards a value higher than that of the MODB climatology. Thus, these authors managed to obtain deep convection in the Gulf of Lions. This parameterisation of the freshwater influx was not used in the GM nor in the RM, which, therefore, provided unrealistic LIW properties.
Second, the ECMWF atmospheric forcing for the pe-riod 1979–1993 has a very strong interannual variability (Demirov and Pinardi, 2002). This may bias the ECMWF climatology. When compared to NCEP forcing (see, Fig. 5 of Korres et al., 2000) and to re-analysis of ECMWF winter forcing (Demirov and Pinardi, 2002), winter cooling in the GM and RM simulations was found to be underestimated by 50–100 W/m2. This low cooling, which is associated with relatively weak wind stress over the Gulf of Lions, also re-duces preconditioning of deep-water formation. Last, the use of a low-frequency atmospheric forcing has a strong im-pact on the water masses that are produced in winter. With-out high-frequency variability and extreme values, convec-tion may not reach the LIW depth (Castellari et al., 2000). This effect is reinforced in a high-resolution model in which baroclinic instability acts to restratify the water column and inhibit convection (Madec et al., 1991).
4.8 Comparison with altimetry
We used sea-level anomaly maps from T/P-ERS-1/ERS-2 provided by CLS-Argos to compare with the RM results. Due to uncertainty in the mean elevation of the sea surface, the mean circulation over the period 1998–2000 cannot be inferred from altimetry. Furthermore, the atmospheric forc-ing in 1998–2000 is probably quite different from the
clima-294 V. Echevin et al.: Simulation and analysis of the mesoscale circulation RM RM RM (c) (b) (a) TP/ERS 1998 TP/ERS 1999 TP/ERS 2000 (d) (e) (f)
Fig. 16. Sea-surface height variability (shaded, isolines in cm) from RM results (a–c) and TP/ERS data (d–f). TP/ERS maps were calculated
every 6 days for the years (d) 1998, (e) 1999, (f) 2000. For each year, the SSH anomaly was calculated relative to the annual mean of the given year. For a, b, c, isolines 0, 1, 1.5, 2, 2.5, 3, 4 and 5 cm are plotted. For d, e, f isolines 0, 2, 2.5, 3, 3.5, 4, 4.5, 5, 6, 9 and 12 cm are plotted.
tology we used, so we only compare the variability of the measured sea-surface height with that of the RM.
Along-track altimetric data from T/P and ERS have been combined to provide sea-surface height (hereafter SSH) anomaly maps of the Mediterranean Sea at a resolution of 1/8◦·1/8◦every 7 days during the years 1998, 1999, 2000
(CLS Argos, personal communication). We calculated the SSH variability for each year from these data. For each map, the mean sea level over the area 0◦E–10.5◦E 39.9◦N– 45◦N was subtracted in such a way as to filter out mean-sea-level temporal variations, which contain the large-scale steric-height signal. The same filtering was performed on the RM SSH fields which do not include steric-height variations. Once this filtering was done, SSH variability was calculated relative to the annual mean SSH anomaly of each given year.
The results are presented in Fig. 16 (a–c for the RM and d–f for the TP/ERS data).
Despite the strong interannual variability both in the obser-vations and the RM, some structures are qualitatively similar. There is a strong signal (∼3–3.5 cm) in the Gulf of Lions, a rather weak signal (∼2 cm) in the central part of the Gulf of Lions, a strong signal (∼3.5–4 cm) west of Corsica in 1999 and 2000, a strong signal in the Balearic Sea, north (∼4 cm in 1999, 5 cm in 2000) and northeast (∼9–10 cm in 1998,
∼6 cm in 1999) of Minorca. In the Ligurian Sea, the SSH variability was strong (∼3.5 cm) in 1998, low in 1999 and 2000. The overall level of SSH variability is much lower in the RM. Extreme values reach only 4–5 cm instead of the 9–12 cm in the observations. The background variability is less than 1 cm in the RM and always greater than 2–2.5 cm
in the observational data. Despite the low levels of variabil-ity, several mesoscale patterns are quite similar to those ob-served. SSH variability is relatively high (∼1–1.5 cm) along the NC path, with a maximum (∼2 cm) south of Toulon (∼6◦E 43◦N) in years II (Fig. 16b) and III (Fig. 16c). Sim-ilar structures can be observed in 1998 and 2000 (Figs. 16d and f). The highest signal (∼3–4 cm) is in the Catalan Sea, north and northeast of Minorca, which is in good agreement with the observations. The high variability northwest of Sar-dinia (∼7.5◦E 42◦N) in the RM is south of the maximum observed in the data (∼42.5◦N–43◦N) in 1999 and 2000. Note also the low SSH on the Gulf of Lions’ shelf in the RM compared to the observations. This may indicate low vari-ability of the RM dynamics on the shelf, which is due to the lack of temporal and spatial variability in the wind field (Es-tournel et al., 2001). However, the quality of the data close to the coast is questionable (Echevin, 1998).
5 Conclusions
The large-scale and mesoscale circulation of the north-western Mediterranean Sea was simulated with the OPA7 primitive-equation circulation model (RM) embedded in a general circulation model (GM) of the Mediterranean Sea. A simulation forced by monthly climatological atmospheric forcing was performed. The good agreement between the RM large-scale and mesoscale circulation and observations reported in the literature demonstrate that the strategy of downscaling by model embedment is clearly feasible in the framework of the Mediterranean Forecast Pilot Project.
The results are summarised in the following. The large-scale circulation in the Liguro-Provenc¸al basin is in good agreement with observed features reported in the literature. The circulation is cyclonic over the RM domain. The gyre is forced by the wind stress and heat fluxes in the Gulf of Lions and alimented by the west Corsican current (WCC), which flows northwards east of Sardinia, and by the east Corsican current (ECC), which flows northwards through the Corsica channel.
The ECC is well marked in the RM. Its transport varies between 0.25 Sv (end of summer) and 0.6 Sv (end of win-ter), which is in relatively good agreement with observations (Astraldi and Gasparini, 1992). It veers to the west in spring-summer as it exits the Corsica channel.
The WCC path cannot be identified as a well-defined current. It is perturbed by instabilities during all seasons. This current transports ∼1 Sv northwards annually. Approx-imately half of the flow follows the Corsican coast and meets the ECC north of Corsica. The other half crosses the Lig-urian Sea northwestwards and meets the Provence coast near 7.5◦E.
The NC, formed by the convergence of the WCC and ECC along the Provence coast, is well defined in the RM. The mean flow follows the Provence coast and the Gulf of Li-ons’ shelf break. The seasonal cycle of the NC transport shows maximum values in late winter (∼2.3 Sv) and
mini-mum (∼1.5 Sv) in fall, in relatively good agreement with pre-vious observations (Alb´erola et al., 1995). The NC detaches from the north Catalonian coast (near 3◦E 41.5◦N–42◦N)
most of the time. This behaviour, which is not confirmed by available observations (which are relatively few), seems to be forced by the open boundary condition of the RM in the southwest, which strongly depends on the GM solution.
The mesoscale activity is intense in the RM simulation. The WCC is highly unstable. Northward advection of warm water from the Algerian basin generates several eddies, and eddies generated in the Catalan Sea propagate eastwards with the Balearic current and interact with the WCC. The mesoscale activity is quite strong in the eastern Ligurian Sea, with the occurrence of small cyclonic eddies on the Gulf of Genoa’s shelf, and with the occurrence of a large anticy-clonic eddy in the Gulf of Genoa. Mesoscale activity in the ECC and WCC regions propagates to the NC area with the cyclonic flow. Meandering of the NC, owing to baroclinic instability, is observed. The meander length scales are in good agreement with those of previous satellite observations. However, phase velocities of the instabilities are slower than those inferred from observations (Cr´epon et al., 1982, Flexas et al., 2002). The mesoscale circulation is very intense in the Catalannorth Balearic Sea. Mesoscale eddies are gen-erated when the NC leaves the Catalonian coast near (3◦E 41.5◦N–42◦N). These eddies are enhanced in winter when the WIW formed over the Gulf of Lions’ shelf is advected southwards with the flow in the form of dense water lenses, also named “weddies” (Pinot and Ganachaud, 1999). These anticyclonic eddies remain vigorous for several months and interact with quasi-permanent eddies northeast of Minorca and with the northward-propagating eddies generated by the Algerian Current instabilities. This complex eddy field may deflect the NC path eastwards and the Balearic current north of the Balearic Islands.
New field observations are necessary to further validate (or invalidate) the RM results. Several regions remain poorly investigated. The mean and mesoscale circulation along the west coasts of Corsica and Sardinia is not well known. The place where the ECC and the WCC merge is not well known. Even though the ECC transport has been measured during several years, the circulation in the Gulf of Genoa has not been described precisely in the literature. No observational studies have described the interaction of the NC with “wed-dies” in the Catalan Sea.
Altimetric data provide useful information on the mesoscale circulation. However, the repetition period of the satellite tracks (9.96 days for T/P, 35 days for ERS) and the distance between neighbouring tracks is sufficient for open-ocean mesoscale activity to be observed, but not for the mesoscale activity of the relatively narrow Mediterranean boundary currents. A rigorous validation of the modelled coastal-current variability with altimetric data would imply an analysis of the data along the altimeter tracks which inter-sect the currents, instead of the use of two-dimensional maps produced by optimal interpolation of the along-track data on a regular grid. Such an along-track study could be done over
296 V. Echevin et al.: Simulation and analysis of the mesoscale circulation a limited area (for instance, in the Gulf of Lions; Echevin,
1998), but the task would be enormous over as large a do-main as that covered by the RM.
Furthermore, several modelling studies focusing on sub-regions of the northwestern Mediterranean are needed to clarify some of the processes involved in the RM. The per-sistent presence of eddies northeast of Minorca (Fig. 11), northeast of Corsica (Fig. 4), in the Gulf of Genoa in sum-mer (Fig. 6), the deflection to the west of the ECC in winter (Fig. 11), may be sensitive to model parameterisation, such as the choice of vertical coordinates (z-levels versus sigma levels) and the number of vertical levels. Such choices may influence the position of the quasi-permanent deep eddies (observed west of Sardinia and Corsica) which interact with bottom topography and modify the phase velocity of the in-stabilities propagating along the shelf break (Griffiths et al., 2000). Furthermore, the use of daily atmospheric forcing to force the GM and the RM models would have an impact on various processes, such as deep-water formation or the sig-nature of the Rhone River plume on surface water.
Several questions regarding the downscaling methodology are still open. One of the major goals of the MFSPP project is the forecasting of the mesoscale and coastal circulation. We have shown that a spin-up phase of ∼2 months is nec-essary for the RM to reach acceptable levels of kinetic en-ergy (Fig. 1). During this spin-up phase, mesoscale activity is generated by (1) baroclinic instability due to the high spa-tial resolution of the RM and (2) adjustment of the inispa-tial state to the RM bottom topography. These two effects can-not be separated. Consequently, the RM circulation cancan-not be interpreted during the months following the initialisation of the model. The spin-up period may last more or less time, depending on the season (winter in the present case) and on the time-averaging performed on the GM data (monthly av-erage in the present case).
An improved initial state for the RM could be obtained with the use of a data assimilation methodology. In the case of downscaling from a GM to a RM, the GM outputs can be considered as scale data which constrain the large-scale circulation of the RM. Using such a technique, the RM and GM results would be fully consistent. However, imple-menting a data assimilation methodology requires adapted numerical tools, such as an adjoint model. This complex task represents a challenge for future downscaling techniques.
Acknowledgements. We thank E. Demirov and N. Pinardi, of
ISAO-CNR, for providing the MOM8 data, and G. Larnicol, of CLS-Argos, for providing the TOPEX/POSEIDON and ERS-1/ERS-2 altimetric data. We also thank G. Madec and K. B´eranger for fruitful discussionsand R. Griffith for careful editing of the manuscript. This work was performed under the MFSPP CEE DGXII contract n◦ MAS3-CT98-0189 and SHOM contract n◦ 9987036004702925, and finalised under a post-doctoral scholarship from the Centre National d’Etudes Spatiales (CNES). Numerical calculation were performed on computers from the IDRIS comput-ing centre.
References
Alb´erola, C., Millot C., and Font, J.: On the seasonal and mesoscale variabilities of the northern current during the PRIMO-0 exper-iment in the western Mediterranean, Oceanologica Acta, 18, 2, 163–192, 1995.
Astraldi, M. and Gasparini, G. P.: The seasonal characteristics of the circulation in the north Mediterranean basin and their relation-ships with atmospheric-climatic conditions, J. Geophys. Res., 97(C6), 9531–9540, 1992.
Ayoub, N.: Etude de la variabilit´e du niveau de la mer et de la cir-culation en M´editerran´ee `a partir des donn´ees altim´etriques et de champs de vent. Comparaison avec des simulations num´eriques., Th`ese de Doctorat de l’Universit´e Paul Sabatier, Toulouse, 1997. Bahurel, P.: MERCATOR, developing an integrated system for op-erational oceanography, Proceedings of the OCEANOBS99 (so-licited papers), 18–22 October 1999, St Rapha¨el, France, Centre National d’Etudes Spatiales, France, 1999.
B´ethoux, J.-P.: Budgets of the Mediterranean Sea, Their depen-dence on the local climate and on characteristics of the Atlantic waters, Oceanologica Acta, 2, 157–153, 1979.
B´ethoux, J.-P., Prieur, L., and Bong, J. H.: Le courant Ligure au large de Nice, Oceanologica Acta, 9, 59–67, 1988.
Bignami, F., Marullo, S., Santoleri, R., and Schiano, M. E.: Long-wave radiation budget in the Mediterranean Sea, J. Geophys. Res., 100, 2501–2514, 1995.
Blanke, B. and Delecluse, P.: Variability of the tropical Atlantic ocean simulated by a general circulation model with two differ-ent mixed layer physics, J. Phys. Ocean., 23, 1363–1388, 1993. Brasseur, P., Beckers, J.-M., Brankart, J.-M., and Schoenauen, R.:
Seasonal temperature and salinity fields in the Mediterranean Sea: Climatological analysis of an historical data set, Deep Sea Res., 43, 2, 159–192, 1996.
Castellari, S., Pinardi, N., and Leaman, K.: Simulation of water mass formation processes in the Mediterranean Sea: Influence of the time frequency of the atmospheric forcing, J. Geophys. Res., 105, 24 157–24 181, 2000.
Conan, P. and Millot, C.: Variability of the Northern current off Marseilles, Western Mediterranean Sea, from February to June 1992, Oceanologica Acta, 18, 2, 193–205, 1995.
Cr´epon, M., Wald, L., and Monget, J. M.: Low-frequency waves in the Ligurian Sea during December 1977, J. Geophys. Res., 87, C1, 595–600, 1982.
Deleville, S.: Contribution `a la mod´elisation de la dynamique ma-rine d’´et´e du Golfe du Lion, Application d’un mod`ele emboˆıt´e passif. Th`ese de doctorat de l’universit´e Aix-Marseille II, p. 170, 1997.
Demirov, E. and Pinardi, N.: Simulation of the Mediterranean Sea circulation from 1979 to 1993: Part I. The interannual variability, J. Marine Systems, in press, 2002.
Echevin, V.: Variabilit´e du niveau de la mer mesur´e par altim´etrie dans le golfe du Lion, Etude de l’influence de diverses ob-servations sur la pr´evision de la circulation cˆoti`ere, Th`ese de l’Universit´e Paul Sabatier, Toulouse, France, p. 191, 1998. Estournel, C., Durrieu de Madron, X., Marsaleix, P., Auclair, F.,
Julliand, C., and V´ehil, R.: Observation and modelisation of the winter coastal circulation in the Gulf of Lions under wind condi-tions influenced by continental orography (FETCH experiment), J. Geophys. Res., submitted, 2001.
Flexas, M., Garcia, M. A., Durrieu de Madron, X., Canals, M., and Arnau, P.: Flow variability in the Gulf of Lions during the MATER HFF experiment (March–May 1997), J. Marine