HAL Id: insu-02981457
https://hal-insu.archives-ouvertes.fr/insu-02981457
Submitted on 28 Oct 2020
HAL is a multi-disciplinary open access
archive for the deposit and dissemination of sci-entific research documents, whether they are pub-lished or not. The documents may come from teaching and research institutions in France or abroad, or from public or private research centers.
L’archive ouverte pluridisciplinaire HAL, est destinée au dépôt et à la diffusion de documents scientifiques de niveau recherche, publiés ou non, émanant des établissements d’enseignement et de recherche français ou étrangers, des laboratoires publics ou privés.
Plio-Pleistocene sedimentation in West Turkana
(Turkana Depression, Kenya, East African Rift System):
Paleolake fluctuations, paleolandscapes and controlling
factors
A. Nutz, M. Schuster, D. Barboni, G. Gassier, B. van Bocxlaer, Cécile Robin,
T. Ragon, J.-F. Ghienne, J.-L. Rubino
To cite this version:
A. Nutz, M. Schuster, D. Barboni, G. Gassier, B. van Bocxlaer, et al.. Plio-Pleistocene sedimen-tation in West Turkana (Turkana Depression, Kenya, East African Rift System): Paleolake fluctua-tions, paleolandscapes and controlling factors. Earth-Science Reviews, Elsevier, 2020, 211, pp.103415. �10.1016/j.earscirev.2020.103415�. �insu-02981457�
Journal Pre-proof
Plio-Pleistocene sedimentation in West Turkana (Turkana Depression, Kenya, East African Rift System): Paleolake fluctuations, paleolandscapes and controlling factors
A. Nutz, M. Schuster, D. Barboni, G. Gassier, B. Van Bocxlaer, C. Robin, T. Ragon, J.-F. Ghienne, J.-L. Rubino
PII: S0012-8252(20)30461-X
DOI: https://doi.org/10.1016/j.earscirev.2020.103415
Reference: EARTH 103415 To appear in: Earth-Science Reviews Received date: 17 July 2020
Revised date: 10 October 2020 Accepted date: 19 October 2020
Please cite this article as: A. Nutz, M. Schuster, D. Barboni, et al., Plio-Pleistocene sedimentation in West Turkana (Turkana Depression, Kenya, East African Rift System): Paleolake fluctuations, paleolandscapes and controlling factors, Earth-Science Reviews (2020),https://doi.org/10.1016/j.earscirev.2020.103415
This is a PDF file of an article that has undergone enhancements after acceptance, such as the addition of a cover page and metadata, and formatting for readability, but it is not yet the definitive version of record. This version will undergo additional copyediting, typesetting and review before it is published in its final form, but we are providing this version to give early visibility of the article. Please note that, during the production process, errors may be discovered which could affect the content, and all legal disclaimers that apply to the journal pertain.
1
Plio-Pleistocene sedimentation in West Turkana (Turkana Depression,
Kenya, East African Rift System): paleolake fluctuations, paleolandscapes
and controlling factors
A. Nutz1,* nutz@cerege.fr, M. Schuster2, D. Barboni1, G. Gassier1, B. Van Bocxlaer3, C. Robin4, T. Ragon5, J-F. Ghienne2, J-L. Rubino6
1 CEREGE, Aix-Marseille Université, CNRS, IRD, Collège de France, INRA, Aix en
Pro-vence, France.
2Institut de Physique du Globe de Strasbourg (IPGS), UMR 7516 CNRS-Université de
Strasbourg, EOST, 1 rue Blessig, 67084 Strasbourg, France.
3
Evo-Eco-Paleo, UMR 8198 CNRS-Université de Lille, Bâtiment SN2, Cité Scientifique, 59000 Lille, France
4Laboratoire Géosciences Rennes, Université de Rennes 1, UMR 6118 CNRS/INSU, Campus
de Beaulieu, 35042 Rennes, France
5
Seismological Laboratory, California Institute of Technology, Pasadena, CA, USA
6Total S.A., CSTJF, Avenue Larribau, 64018 Pau Cedex, France *Corresponding author.
ABSTRACT
Pliocene and Pleistocene sediments from West Turkana (Kenya, East African Rift System) form emblematic syn-rift successions for understanding the evolution of extensional basin and continental rifting. They also constitute world-renowned fossil-bearing strata from which >500 hominin fossils were discovered over the past decades, with >100 inventoried archaeological sites. However, associated sedimentary dynamics and architectures as well as paleoenvironments are only partially reconstructed and the relative contribution of climate
Journal Pre-proof
2
and tectonism to paleoenvironmental change over time remains unclear. Here, through the interpretation of sedimentary facies, the delineation of sequences and the analysis of 13C in
soil carbonates, we provide the first exhaustive reconstruction from ~4 to ~0.75 Ma of (i) fluctuations of the paleolake that occupied the Turkana Depression, (ii) the successive sedimentary dynamics and related paleolandscapes that characterized the West Turkana area and (iii) respective roles of climate and tectonism in the sedimentation. We show evidence for seven major transgression-regression (T-R) cycles between ~4 and ~0.75 Ma superimposed locally by lower amplitude T-R cycles. , Comparing the sedimentological interpretations and the 13C values in soil carbonates (literature data), we reveal that fluctuations of rainfall over
the Ethiopian Dome, which hosts the drainage basin of the Omo River — the main tributary of Lake Turkana — controlled high-amplitude lake level fluctuations during the Plio-Pleistocene period. We also demonstrate that vegetation and tree cover evolved differently in the Omo Valley and West Turkana. Furthermore we outline that two different sedimentary systems reflecting two distinct modes of sedimentation alternated through times in the West Turkana area as a response to the variations in sediment supply coming from the western rift shoulder (i.e. Lapurr Range) that alternatively generated wave- or river-dominated sedimentary systems. In conclusion, we reveal that climate regulated water input, paleolake water-level fluctuations and vegetation. Tectonism determined sediment supply to the basin controlled in West Turkana by pulses of increased activity of the main border fault (i.e., the Murua Rith Lapurr Fault).
KEYWORDS: Nachukui Fm, Omo Group, rift basin, Pliocene
1. INTRODUCTION
The Turkana Depression has been investigated for several decades, the deposition and preservation of thick syn-rift strata in this area providing a thorough record of the evolution of
Journal Pre-proof
3
the East African Cenozoic rifting from ~35 million years ago to the present. In the early1980's, ambitious seismic imagery campaigns (Amoco Kenya Petroleum company and project PROBE) boosted geological investigations, while the first detailed stratigraphical and sedimentological analyses were performed (de Heinzelin, 1983; Brown and Feibel, 1986; Harris et al., 1988). Seismic imagery revealed that the Turkana Depression is composed of several individual grabens and half-grabens filled by >3 km of Neogene sediments (Dunkelman et al., 1988; 1989; Morley et al., 1992). After the 1990‘s, additional seismic reflection, gravity and magnetic data, deep and shallow wells and geological analysis of outcrops led to the elaboration of a complex structural framework that shed light on fundamental geotectonic processes associated with continental rifting (Morley et al., 1999; Vétel and Le Gall, 2006; Brune et al., 2017; Ragon et al., 2019; Morley, 2020). In parallel, sedimentary processes in the Turkana Depression (Cohen 1981; Frostick et al., 1986; Williamson and Savage, 1986; Frostick and Reid, 1987; Tiercelin et al., 2010; Hargrave et al., 2014; Nutz et al., 2017; Schuster and Nutz, 2018) stand as text-book examples of sedimentation in extensional basins, with thick exposures of several hundred meters that provide a quasi-complete record of extensional basin evolution, especially during the Plio-Pleistocene, between ~4.00 and ~0.75 million years (Ma). Well-exposed in distinct parts of the northern region of the Turkana Depression, the three formations of the Omo Group (de Heinzelin, 1983), i.e. the Shungura Fm, the Koobi Fora Fm and the Nachukui Fm, constitute exceptionally continuous archives from the three key domains of a half-graben system, i.e. the axial system, the ramp transverse system, and the border-faulted transverse system, respectively.
The three formations are also world-renowned fossil-bearing successions for paleoanthropology, paleontology and archeology. Dedicated investigations are ongoing since Arambourg‘s expeditions in the region (Arambourg 1935 and 1943) some 30 years after the
Journal Pre-proof
4
trans-African expedition of du Bourg de Bozas that reported fossil vertebrates from the Lower Omo Valley (Boisserie et al., 2008).The Nachukui Fm happened to be particularly rich with, to date, >100 archaeological sites and >500 specimens of early hominins, some of which have been instrumental for the understanding of human evolution. These discoveries include specimens of Australopithecus anamensis, Kenyanthropus platyops, Paranthropus aethiopicus, Paranthropus boisei, Homo rudolfensis, Homo erectus and Homo sapiens (Brown et al., 1985; Walker et al., 1986; Leakey and Walker, 1988; Leakey et al., 1995, 2001; Prat et al., 2003, 2005). Numerous stone tools were also found in strata of this Formation (Roche et al., 1999; Delagnes and Roche, 2005), among which the earliest evidence of Acheulean stone tool technology (Lepre et al., 2011). More recently, the Lomekwian stone tools found in strata of the Nachukui Fm pushed the first appearance of homonin technological behaviour back to 3.3 Ma (Harmand et al., 2015). In summary, the northern Turkana Depression is generally considered a key area to understand how paleoenvironmental change and human evolution are linked (Maslin and Trauth, 2009; Maslin et al., 2014; Potts and Faith, 2015; Cohen et al., 2016). For all these reasons, the Plio-Pleistocene sediments of the Turkana Depression, and particularly the Nachukui Fm, are of uttermost importance for many communities within the geosciences.
However, since the pioneer work by Harris et al. (1988) on the Nachukui Fm, by de Heinzelin (1983) on the Shungura Fm, and by Brown and Feibel (1991) on the Koobi Fora Fm, none of the three formations of the Omo Group has been comprehensively investigated. Instead, a variety of local studies have been performed on each Formation, often in direct association with paleontological and archeological discoveries. In this review, we present a synthesis of recent investigations on the Nachukui Fm, which is the longest-lasting Formation of the Omo Group, and we refine conditions of sedimentation between ~4.00 and ~0.75 Ma, in West Turkana and subsequently paleoenvironmental changes. For the first time, continuous
Journal Pre-proof
5
and comprehensive reconstructions of i) paleolake fluctuation, ii) the evolution of sedimentary dynamics and related paleolandscapes and iii) the respective influence of various controlling factors (i.e., climate, tectonism) are proposed based on depositional environments analysis, sequence stratigraphy and paleovegetation in both the Omo Valley and West Turkana areas. Successive sedimentary systems are characterized revealing that variable sedimentary paleolandscapes alternated along the border fault (i.e., Murua Rith Lapurr Fault or MRLF) of the northern Turkana Depression between ~4.00 and ~0.75 Ma. Confronting δ13C isotopic ratios in soil carbonates (Levin, 2015) and inferred tree cover (Cerling et al., 2011) with our sedimentological interpretations; we unravel the relative influence of climate and tectonism on paleolake fluctuations and paleolandscape evolution. In providing this synthesis we aim at documenting depositional processes in continental rift basin, especially along faulted borders. We also aim at proposing a general framework of paleoenvironmental reconstruction for further investigations in this area.
2. GEOLOGICAL CONTEXT
2.1. Regional structural setting
The Turkana Depression is part of the East African Rift System (EARS), located between the Ethiopian and the East-African Domes (Fig. 1A). It corresponds to a 300 km long and 200 km wide lowland that separates the Main Ethiopian Rift to the north from the northern Kenyan rift to the south (Ebinger et al., 2000; Brune et al., 2017). The Turkana Depression consists of several N-S oriented half-grabens and grabens which developed from the middle to upper Eocene up to the present-day (Rosendahl, 1987; Dunkelman et al., 1988, 1989; Morley et al., 1999; Tiercelin and Lezzar, 2002; Vétel and Le Gall, 2006; Tiercelin et al., 2012a and 2012b; Macgregor, 2015; Boone et al., 2017, 2019; Ragon et al., 2019).
Journal Pre-proof
6
The Turkana Depression is subdivided into a southern and a northern depression based on their different structural characteristics (Ragon et al., 2019). The southern Turkana Depression consists of five juxtaposed N-S oriented half-grabens known as the Naipa, Lokichar, Turkwel, Kerio and South Lake Basins (Fig.1B, C). Together they form a > 200 km wide rift system (sensu Buck, 1991), characterized by relatively low-lying reliefs due to limited shoulder uplifts in between the different basins. The onset of the extension related to the Cenozoic EARS started at around 45-40 Ma in the Naipa and Lokichar Basins (Boone et al., 2019). During the early Miocene (23-15 Ma), surface rupture migrated farther east with the opening of the Turkwel and Kerio Basins (Vétel and Le Gall, 2006). Later, the initiation of the South Lake Basin may have started slightly before 10 Ma (Morley et al., 1999; Vétel and Le Gall, 2006). In contrasts, the northern Turkana Depression is strikingly different. It consists of a single 80 km wide and >4 km deep (Abdelfettah et al., 2016) N-S oriented half-graben (Hendrie et al., 1994; Morley et al., 1999; Tiercelin et al., 2004; Vétel and Le Gall, 2006; Ragon et al., 2019) referred to as the North Lake Basin (Fig. 1B, C). The North Lake Basin forms a narrow rift (sensu Buck, 1991) bounded to the west by the N-S oriented Murua Rith-Lapurr Fault (MRLF) (Fig. 1C, 2), and to the east by a west-dipping ramp system. West of the MRLF, a relative high-relief characterizes the rift shoulder referred to as the Murua Rith Hills and the Lapurr Range (Fig. 2). East of the MRLF, the basin is affected by several smaller normal faults up to a second major one, i.e. the Shore Fault (Nutz et al., 2017; Ragon et al., 2019), as it is currently located at Lake Turkana‘s shore (Fig.2). In the northern Turkana Depression, the onset of the extension is delayed. It is associated with the development of micro-basins dated between ~28 and ~25.5 Ma (Ragon et al., 2019), during the first phase of extension attributed to EARS1 (sensu Macgregor, 2015). After a period of tectonic quiescence, a second pulse of extension referred to as EARS2 (sensu Macgregor, 2015), led to the opening of the North Lake Basin around 14 Ma (Boone et al., 2017; Ragon et al., 2019)
Journal Pre-proof
7
and the onset of sedimentation in the basin. At ~0.7 Ma, the shore fault (Fig. 2) became much more active than the MRLF, the depocentre shifted markedly eastward (Nutz et al., 2017) and this event marked the end, except locally, of the Nachukui Fm sedimentary system. The deposits of the Nachukui Fm subsequently constituted the footwall of the newly-formed and still active depocentre (Nutz et al., 2017), providing geologists with some of the remarkable outcrops presented hereafter.
2.2. Regional lithological framework
The basement of the northern Turkana Depression is made of metamorphic Proterozoic rocks (Williamson and Savage, 1986; Morley et al., 1992; Wescott et al., 1993; Morley et al., 1999; Tiercelin et al., 2012b). The oldest sedimentary rocks deposited on the basement are the Turkana Grits, locally known as the Lapur Sandstone Formation, which correspond to fluvial sandstones from Late Cretaceous to Oligocene age (Murray-Hughes, 1933; Arambourg and Wolff, 1969; Morley et al., 1999; Tiercelin et al., 2004, 2012a and 2012b). Overlying the Turkana Grits, thick lava flows commonly associated with intercalated volcano-sedimentary rocks were deposited as a response to intense fissural volcanic activity during Late Eocene to mid Miocene times, depending of the location. They are referred to as the Turkana Volcanics Fm (Fig. 3; Bellieni et al., 1981, 1987; Zanettin et al., 1983; McDougall and Brown, 2009; Rooney, 2017). The 3 km thick Turkana Volcanics Fm is spread over an extensive region, including the West Turkana area (Fig. 3). In West Turkana, the Turkana Volcanics Fm is Upper Eocene to Lower Oligocene in age and predates rifting (Ragon et al., 2019). Overlying the Turkana Volcanics Fm, Oligocene sedimentary rocks were deposited in extensional micro-basins (Ragon et al., 2019); they fill the oldest syn-rift structures in this area. Upwards in the succession, Miocene rocks are exposed sparsely, but they have been identified in some wells (Schofield et al., 2020) suggesting deposition at least in the North Lake Basin after its
Journal Pre-proof
8
opening 14 Ma ago. Overlying, Plio-Pleistocene sediments of the Omo Group are exposed all around modern Lake Turkana. The Omo Group, first defined by de Heinzelin (1983), is subdivided into three main formations referred to as the Nachukui, Koobi Fora and Shungura fms cropping out in the western Turkana, eastern Turkana and Omo Valley, respectively (Fig. 1B), and two additional minor ones referred to as Usno and Mursi Fms both exposed in the Omo Valley. Younger sediments are included in the Turkana Group (Feibel, 2011), such as the Kibish Fm (Butzer, 1971) and the Holocene Galana Boi Fm (Owen and Renaut, 1986), which unconformably covers sediments of the Omo Group (Fig. 3).
The Nachukui Formation is located in the West Turkana area and represents a >700 m thick succession of fossil-bearing fluvial-deltaic-lacustrine sediments (Harris et al., 1988; Feibel, 2011). This formation is divided into 8 members separated by tuff horizons. It spans a time interval ranging from ~4.00 to ~0.75 Ma based on tephrostratigraphy (Brown et al., 2006; McDougall et al., 2012). Exposures are located eastward of the MRLF and westward of the Shore Fault (Fig. 2).
During the Plio-Pleistocene, several volcanic events occurred in the northern Turkana Depression and episodic volcanic material intercalated in sediments of the Nachukui Fm. The Gombe Basalt, which is made of extensive and thick basaltic lava flows corresponds to an important volcanic event that occurred between 4.29 and 4.18 Ma in the north (Erbello and Kidane, 2018) and that persisted southward at least until 3.95 Ma (Haileab et al., 2004; Bruhn et al., 2011). Less widespread, the Kulal Volcanics (dated from ~3.00 to ~2.20 Ma) and the Lenderit Basalt (dated from ~2.20 to ~2.00 Ma) were emplaced mostly in the southeastern part of the northern Turkana depression (Bruhn et al., 2011). Postdating the Nachukui Fm, other volcanic events are at the origin of the North, Central and South islands of Lake Turkana (Brown and Carmichael, 1971; Karson and Curtis, 1994).
Journal Pre-proof
9
3. METHODS
3.1. Field analysis
Four field surveys were conducted in July 2014, November 2014, July 2015 and July 2016. Eighteen composite sections were measured along river incisions (Fig. 4) and multiple panoramas were analyzed (see Table S1 for detailed locations). We logged sections spanning the time interval between ~4.00 and ~1.25 Ma. The interval between ~1.25 and ~0.75 Ma was not logged by authors but we used information provided by Harris et al., (1988). Sections were measured using a Jacob‘s staff and we consider a +/- 10% potential error about strata thicknesses. Sedimentary facies were interpreted based on macroscopic examinations during field surveys. Lithology, grain size, sorting, bed thickness, sedimentary structures, and paleocurrents were assessed based on conventional facies analysis (Table 1). Measured sections were correlated based on tephrochronology (Table 2) or through the physical tracing of prominent stratigraphical surfaces within the basin. Subsequently, sequence analysis was carried out. Sequence stratigraphy aims at deciphering cyclicity in sedimentation due to variations in base level (i.e., lake level in this case), flux of sediment supply and/or subsidence rate (Catuneanu, 2018). In this study, we use the model of Trangressive-Regressive sequence (Johnson and Murphy, 1984; Embry and Johannessen, 1992) in order to reconstruct trajectory of the shoreline through time and thus paleolake extensions and contractions. Transgressive-Regressive sequences (T-R sequence) were delineated by considering each sequence as a full cycle of change in the accommodation space, involving an increase due to the landward migrating shoreline during lake level raise followed by a decrease in the space available for sediments to fill associated with the basinward migration of the shoreline due either to lake level fall or sediment wedges progradations. In this model, a sequence is bounded by maximum regressive surfaces that form the Sequence Boundary (SB). The transgressive part includes sediments deposited during the transgression while the regressive part comprises
Journal Pre-proof
10
sediments deposited during the highstand normal regression, the forced regression and the lowstand normal regression (Catuneanu, 2018). The T-R sequence model reflects successive lateral shoreline migrations, landward during the transgressive part and basinward during the regressive part of the T-R sequences. As a consequence, this model highlights paleolake extensions/contractions rather than changes in water depth. In places, several remarkable stratigraphic intervals or surfaces are interpreted such as Maximum Flooding Intervals (MFI) and Wave Ravinement Surfaces (WRS) according to Catuneanu (2018)..
3.2. Chronological constraints
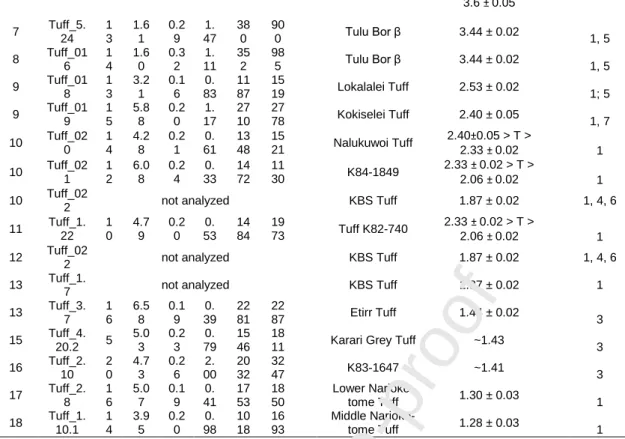
Our chronological framework is established based on tephrochronology using a dataset of 21 dated volcanic tuffs, many of which have been identified throughout the area from their geo-chemical signatures. Tuffs were collected during logging (Table 2). The geo-chemical composi-tion of 18 tephra layers was analyzed using a microprobe (CAMECA SX-FIVE, CAMPARIS service, Paris 6 University) to measure abundance of Fe2O3, CaO and K2O oxides and Mn and
Ti elements. Three tuffs were not analyzed as they had been identified previously by Lepre et al., (2011) and Harmand et al., (2015). Geochemical signatures of these tuffs were compared to published data for identifications (Harris et al., 1988; Brown et al., 2006; McDougall and Brown, 2008). The 18 tephra layers recognized in our sections were identified as 16 distinct tuffs, for which absolute ages estimated by K-Ar and Ar-Ar methods were then obtained from the literature (Pickford et al., 1991; Lepre et al., 2011; McDougall et al., 2012; Harmand et al., 2015; Boës et al., 2018).
3.3. Pedogenic 13C record and inferred paleovegetation changes
Plant fossils are rare in Formations of the Turkana Depression, but an important dataset of carbon isotopic measurements was acquired over the years (Cerling, 1999; Harris and Leakey,
Journal Pre-proof
11
2003; Wynn, 2004; Bobe et al., 2007; Levin et al., 2011) and recently compiled by Levin (2015). The 12C/13C ratio measured in soil carbonates (or δ13Csoil carbonate) reflects the
proportion of plant biomass using C3 or C4 photosynthesis pathways (Cerling and Quade,
1993). In the tropics, C3 plants are predominantly trees and shrubs (and aquatic and montane
grasses in a lower proportion), while C4 plants are predominantly lowland grasses, sedges,
and the often overlooked xerophytic and salt-loving shrubs and forbs of the Amaranthaceae family (Tieszen et al., 1979; Sage, 2004). δ13C in soil carbonates, therefore, has been used to approximate the prevalence of woodlands and grasslands, and to quantify changes in the proportion of woody cover through time. δ13Csoil carbonate values in the range -15‰ to -7‰
indicate vegetation with >40% woody cover (such as forest and undifferentiated woodland, shrubland or bushland) and values >-7‰ indicate more open vegetation (such as wooded grasslands and grasslands) (Cerling et al., 2011).
Woody cover can in turn be used as a proxy of climate as more rainfall and/or shorter dry seasons favor denser woody cover (Staver et al., 2011). In the arid Turkana Depression, dense tree cover predominantly occurs in the alluvial plain along the Omo River, where a shallow water table sustains perennial riparian woodlands and forests (Carr, 1998). Considering that the amount of groundwater available in alluvial plains is controlled by the activity of rivers, themselves dependent of rainfall over river catchments, wetter periods should be associated with more important woody cover (forest, woodlands) in opposition to drier periods which should be characterized by less abundant woody cover (grasslands or steppes). To approximate climate change, namely change in rainfall over river catchments, we therefore used δ13C in soil carbonates. We considered altogether the paleosoil data from Nachukui Fm (n=130) to illustrate paleovegetation changes in the West Turkana area and paleohydrological fluctuations in river catchments of the western rift shoulder (between 3.9 and 0.9 Ma). Data from the Shungura Fm (n=49) were considered independently to illustrate
Journal Pre-proof
12
paleovegetation and paleohydrological changes in the Ethiopian Highlands and the Omo River catchment (between 3.20 and 1.25 Ma). Subsequently, we compared the reconstructed paleolake extension with woody cover changes in the both West Turkana and Omo Valley areas. In case of matching between periods of lake highstand and important woody cover or conversely between periods of lake lowstand and low woody cover, lake highstands and lowstands are coeval with wet and dry periods in river catchments, respectively, revealing that climate is the dominant parameter controlling water-level fluctuations. In contrast, in case of a lake highstand occurring contemporaneously with a reduced woody cover in both Omo Valley and West Turkana, climate in the considered region can be discarded to explain paleolake fluctuations.
To objectively identify whether significant changes in δ13C occurred and if so, when, we have developed a new automatic classification method based on k-means clustering (Bell, 1978; Grim, 1987; Wagstaff et al., 2001). K-means clustering aims at partitioning n observations into k clusters in which each observation belongs to the nearest cluster. Clusters are selected as such to minimize the variance within clusters (group highly similar observations) and to maximize variation among clusters (differentiate distinct groups). Applying this method to time-series data, temporal overlap was not permitted among clusters and each cluster represents a particular period bounded by the oldest and the youngest observations within the cluster. A centroid is estimated for each cluster, defined by the mean age and the mean value of δ13C of all observations included in a given cluster; centroids are linked forming curves that reflect changes of δ13C isotopic ratios in soil carbonates through time. The k-means method usually requires the number of clusters to be arbitrarily selected prior to analysis, for example using Elbow methods (Bholowalia et al., 2014) or principal component analysis (PCA). For this study, we did not arbitrarily set the number of groups a priori to avoid subjective association of observations into artificial time slices. Instead, we ran
Journal Pre-proof
13
12 classifications with a number of clusters ranging from 4 to 15. Considering the 12 classifications, we calculated a total of 114 centroids. In each classification, centroids of groups including at least 3% of the observations were considered representative. Representative centroids were then stacked and linked to reconstruct general changes in the δ13C isotopic ratios in soil carbonates through time. The confidence interval for each centroid is represented by an envelope that depends on the total variance within the cluster divided by the number of observations included in the cluster.
3.4. Accommodation and shoreline trajectory
As defined by Catuneanu (2018), accommodation (A) is the space made available for potential sediment accumulation. It derives from sea/lake-level changes and rates ofsubsidence/uplift or a combination of these processes. Variations in accommodation during a given time interval (δA) result from changes in base-level combined with vertical movements of the basin substratum (i.e., subsidence) during this time interval. The ratio of accommodation rate/rate of sediment supply or δA/δS ratio is considered to directly drive the trajectory of the shoreline. When δA/δS≤0, erosion occurs, progradation (i.e., basinward migration of the shoreline) occurs when 0<δA/δS<1 (i.e., δS exceeds δA), aggradation (i.e., stabilization of the shoreline) when δA/δS=1 and retrogradation (i.e., landward migration of the the shoreline) when δA/δS>1 (i.e., δA exceeds δS). Hence, with a constant rate of sediment supply (δS), variation in accommodation space (δA) controls the establishment and rates of progradation and retrogradation dynamics and the corresponding regressive and transgressive trends, respectively. The higher δS compared to δA, the faster is the progradation, the higher δA compared to δS, the faster is the retrogradation. Conversely, with constant rate of variation in accommodation (δA), variation in sediment supply (δS) drives
Journal Pre-proof
14
the establishment and rates of progradation and retrogradation dynamics and the corresponding regressive and transgressive trends.
On a vertical section, variations in accommodation during a given time interval is quantified by summing up the decompacted thickness of sediments (according to Sclater and Christie, 1980) deposited during this considered time interval and the variations of paleo-bathymetry/paleoaltitude from T0 to T1 (Jervey, 1988). Hence, evaluating variations in
ac-commodation requires (1) absolute datums across the section, (2) lithological data and (3) estimations of paleobathymetry/paleoaltitude along each datums. The identification of tuffs in sections of the Nachukui Fm provides chronologically-constrained sediment intervals. The averaged lithology of each interval (i.e. percentages of sand and mud between two datums) is obtained from sedimentological analysis of the sections (Fig. 4) and thicknesses are then cor-rected for compaction. Estimations of paleobathymetry/paleoaltitude result from facies analy-sis and are indicated in comparison with the lake level noted 0. In this study, a paleobathyme-try of 25 m is attributed to offshore environments, 10 m to transitional environments, 5 m to shoreface sediments, 0 to beach environments and a paleoaltitude of 10 m to fluvial plain and 20 m to alluvial fan. Here, a composite curve is reconstructed to represents the variation of accommodation between ~4.00 and ~1.28 Ma.
4. RESULTS
4.1. Facies associations
Five main facies associations (FA) are identified in the Nachukui Fm from ~4 to ~1.25 Ma revealing the existence of five groups of depositional environments (Table 1). Offshore (FA1) and transitional (FA2) deposits consist mostly of mudstone (i.e., pelites). In contrast to FA1, FA2 shows recurrent intercalated coarser grained beds, which we interpret as storm deposits,
Journal Pre-proof
15
indicating sedimentation in the transition zone (Coe et al., 2003) Wave-influenced nearshore (FA3) deposits are dominated by very well- to well-sorted sandstone, bioclastic sandstone to rudstone with bioclasts corresponding mainly to shells or shell fragments of aquatic mollusks. Within FA3, we recognize three sub-groups: the shoreface (FA3-a), the beach (FA3-b) and the backshore (FA3-c). River-dominated nearshore (FA4) deposits are mixed clastic and carbonate material deposited into coastal alluvial systems. River (FA5) deposits consist of mudstone, sandstone and conglomerate reflecting deposition attributed to the activity of river systems in the subaerial domain. Within FA5, two sub-environments are identified in FA5: the alluvial plain (F5-a) and alluvial fan (F5-b) sub-environments.
4.1.1. Offshore deposits (FA1)
Sediments of FA1 are made of blackish, brownish or greenish mudstone (Fig. 5A), depending on the locations. Prevailing sedimentary structures consist of mm- to cm-scale horizontal laminations (Fig. 5B), even if cm-scale low-angle ripple laminations are observed in places (Fig. 5B). Mudstones are commonly intercalated by dm- to m-thick massive diatomite beds (Fig. 5C). Occasionally, isolated dm- to m-thick tabular or lenticular massive or normal-graded sandstone beds characterized by erosive bases are embedded in mudstones (Fig. 5D). In places, such sandstone beds are sources for m-scale dyke-type donwtapering intrusions. Aquatic vertebrate remains such as fish bones and teeth are common in FA1.
Both mudstones and diatomite reflect suspension fallout from settling processes of fines in subaqueous low-energy depositional environments (Scholle, 1971; Boulesteix et al., 2019), even if occasional ripple laminations in mudstones suggest occasional occurrence of tractional currents. Predominance of settling processes reflects a depositional environment below both the fair-weather and the storm wave bases that define the offshore domain (Coe et al., 2003). Occasional evidences for tractional current in mudstones are attributed to
Journal Pre-proof
16
occasional bottom currents that can occur relatively frequently in offshore lake environments (e.g., Nutz et al., 2014, 2015a, 2018). Isolated massive sandstone beds indicate debris-flow deposits (Talling et al., 2012). Intercalated in offshore mudstones, these debris flows can be attributed to either river-derived underflows or mass-wasting turbidity currents that are frequent processes in deep portions of lakes (e.g., Zavala et al., 2010; Nutz et al., 2014). However, the occurrence of normal graded beds with only sparsely observed inverse graded intervals rather suggests mass-wasting gravity flows (Mulder et al., 2003). Subsequently to their deposition, sandstone beds are occasionally parent units for injectites that may be conservatively attributed to seismicity (Hurst et al., 2011). Previous estimates based on wave observations on modern Lake Turkana broadly support a storm wave base at a depth of ~ -20 m (Nutz et al., 2017). Thus, FA1 is considered to reflect sedimentation in the lake, at >20 m of depth.
4.1.2. Transitional deposits (FA2)
Sediments of FA2 consist of cm- to dm-scale thick coarse-grained beds made of sandstone or shells that alternate with mudstone intervals similar to those observed in FA1. Two types of intercalated coarse-grained beds are identified. The first type of FA2 corresponds to dm-thick sandstones beds (Fig. 5E). Where internal primary sedimentary structures are obvious, their lower boundary is erosional, in places marked by aligned mm- to cm-scale gravels and pebbles. Overlying their lower boundary, coarse sandstones are horizontally laminated grading upward to medium sandstones in symmetric ripple laminations (Fig. 5E) showing a general fining-up interval. In places, the top surface show preserved cogenetic interferent ripples (Fig. 5F) organized in brick and tiles pattern (Allen, 1982). The second type of coarse-grained beds in FA2 consists of cm-scale thick erosionally-based beds (Fig. 5G) of shell
Journal Pre-proof
17
assemblages, either consisting of entire gastropod shells or fragments, forming massive packstone beds (Fig. 5H).
Similar to FA1, mudstone intervals separating coarse beds reflect subaqueous low-energy depositional environments characterized by predominant suspension fallout of fines from settling processes. Embedded sandstone beds marked by basal erosion associated with a fining-up trend indicate sedimentation from a high-density gravity flow (Talling et al., 2012) and represent event beds (Seilacher, 1982). In the upper part, cogenetic interferent ripples evidence influence of interfering oscillatory currents during the waning of the flow (Aigner, 1985; Jelby et al., 2019). In FA2, these sandstone beds are interpreted as storm beds (Johnson and Baldwin, 1996; Jelby et al., 2019). The second type of coarser beds reveals en masse sedimentation (Talling et al., 2012) of shells or shell fragments suggesting that repeated currents reworked shells in the nearshore domain to transport them to areas between the fair-weather and the storm wave bases. Thus, shelly coarse beds embedded in subaqueous mudstones are also attributed to storm-induced currents. Non-amalgamated tempestites usually form at depths between the fair weather and the storm wave bases. Considering a storm wave base around -20 m and a fair-weather wave base at around -5 m in modern Lake Turkana (Nutz et al., 2017), the transitional depositional environment is here estimated within water depths of 5 to 20 m.
4.1.3. Wave-influenced nearshore deposits (FA3) Shoreface deposits (FA3-a)
FA3-a deposits consist of well-sorted medium to coarse sandstone alternating in places with dm-scale packstone to rudstone beds composed of freshwater gastropod and bivalve shells in 1-10 m thick packages. Mollusk specimens are typically rolled and somewhat abraded, with the valves of bivalves regularly being separated. Planar laminations and wave ripple
Journal Pre-proof
18
laminations (Fig. 6A, B and C) prevail even if occasional dm-scale beds with planar cross-laminations are observed. In places, heavy minerals are abundant and concentrated in dark laminations (Fig. 6A). Occasionally, dm-scale sandstone beds laterally varying in thickness at m-scale distances reveal hummocky cross-stratifications (HCS) (Fig. 6D). Vertical burrows are common. When observed on large exposures, such sediments are included in 2 to 10 m-thick wedges that comprise large-scale oblique master beds gently dipping towards the basin (Nutz et al., 2017).
Predominance of mollusks in bioclastic sandstone and packstone suggests nearshore environments. Rolled and somewhat abraded shells, with the valves of bivalves regularly be-ing separated reveal a relative high-energy environment while wave-ripples reveal oscillatory currents. Associated with planar laminations, sedimentary structures reflect a deposition in the nearshore domain either in the surf or the swash zone (Clifton et al., 1971; Massari and Parea, 1988; Clifton 2006). Occasional planar cross-laminations reveal dunes attributed to tractional currents in the build-up or surf zones (Clifton et al., 1971; Massari and Parea 1988) while HCS indicate the combination of large-scale oscillatory and tractional flows developed during storm events in the shoreface (Harms et al., 1975; Dott and Bourgeois, 1982). Packstone and rudstone beds support a deposition in coastal domains. Finally, altogether these sedimentary structures evidence sedimentation in a wave-dominated shoreface depositional environment. Large-scale and low-angle master beds are interpreted as clinoforms revealing basinward pro-gradations of coastal wedges (Nutz et al., 2017). The shoreface domain is located between the fair-weather wave base and the foreshore and corresponds to that part of the shorezone where sediments are constantly agitated by waves. This interval is broadly estimated between -5 and -2 m in depth (Nutz et al., 2017).
Foreshore deposits (FA3-b)
Journal Pre-proof
19
Depending of their location, FA3-b deposits consist of fine conglomerate, coarse sandstones, bioclastic sandstone, packstone or rudstone beds (Fig. 6E and F) composed of freshwater mollusk shells. Mollusk specimens are abraded and with the valves of bivalves are regularly separated. Two types of foreshore deposits are distinguished in measured sections. The first type of FA3-b is included in 1 to 2-m-thick sediment bodies made of planar laminations in low- (<5°) to moderate-angle (5-10°) oblique master beds dipping basinward (Fig. 6G, H). The second type of FA3-b consists of bioturbated coarse sandstone or bioclastic sandstone included in successive dm- to m-scale intervals. Each interval is characterized in the lower part by horizontal laminations with occasional planar and through cross-laminations with few burrows or rhizoliths. The abundance of such burrows or rhizoliths increases in the upper part which is pervasively bioturbated. Primary structures, such as planar or cross-laminations, are disrupted and not obvious anymore. The upper part is topped by an irregular surface where burrows or rhizoliths are interrupted (Fig. 6I).
In the two types of FA-b, important accumulations of mollusk shells in bioclastic sandstone, packstone and rudstone evidence sedimentation in the coastal domain. In the first type, oblique master beds are interpreted as reflecting the accretion of successive beach faces (Dabrio, 1982; Tamura, 2012) developed in the swash zone (Clifton et al., 1971) supported by the abraded shell assemblages that suggest the influence of waves. Low-angle master beds express relative high-energy dissipative beaches in a high-energy wave-dominated foreshore environment. Higher-angle oblique stratifications rather indicate more reflective beaches developed in a moderate-energy wave-dominated foreshore environment (Wright et al., 1979). In the second type of FA3-b, the abundance of bioturbation reflects deposits from a low-energy shore environment where aquatic macrophytes were abundant and fairly impacted by waves. This type reflects sedimentation in a more sheltered zone, such as coastal swamps that experienced alternations between sedimentation and the development of vegetation. Both
Journal Pre-proof
20
versions of FA3-b represent a sedimentation in a foreshore depositional environment, which bathymetric range is broadly estimated between -2 and 0 m (Nutz et al., 2017), corresponding to the swash zone in wave-influenced nearshore domains or to areas where bathymetry allowed aquatic macrophytes to develop.
Backshore deposits (FA3-c)
FA3-c deposits mostly consist of well-sorted medium sandstone in dm-scale beds alternating with bioclastic sandstone beds. These beds are included in 1–3 m thick sediment bodies (Fig. 7A), which show large-scale high-angle (>10°) oblique master beds dipping toward the basin margin, in places grading updip to sub-horizontal beds. Master beds are frequently reworked revealing recurrent reactivations (Fig. 7A). Commonly, the uppermost sub-horizontal beds display dm-scale burrows and rhizoliths (Nutz et al., 2017).
Mollusk shells in bioclastic sandstone indicate nearshore deposits. Landward oblique master beds reveal migrating features from the central portion of the basin toward the margin whereas sub-horizontal beds in the uppermost part reflect coeval aggradation. In nearshore domains, m-scale landward-migrating features are interpreted as washover fans (e.g., Schwartz, 1982; Neal et al., 2003; Baumann et al., 2017; Nutz et al., 2017). Internal reactivation surfaces and soil development at the top of sediment bodies indicate intermittent migration and distinct construction phases. During storm episodes, infragravity waves transport sediments from the foreshore to the backshore domain forming washover accumulations (Baumann et al., 2017). Between two successive storms, soils developed on top surfaces (Nutz et al., 2017). Washover fans are important features along wave-dominated coasts of lacustrine systems (Nutz et al., 2018). In the Turkana Depression, early Quaternary, Holocene and modern examples of washover fans are abundant (Tiercelin et al., 2010; Nutz et
Journal Pre-proof
21
al., 2017; Schuster and Nutz, 2018). They formed broadly between 1 and 5 m above the contemporaneous lake level.
4.1.4. River-dominated nearshore deposits (FA4)
FA4 deposits are represented by two different types. The first type of FA4 consists of poorly-sorted fine to medium matrix-supported conglomerates in dm- to m-thick beds. Matrix consists in sandstone, bioclastic sandstone and packstone including mollusk shells or shell fragments (Fig. 7B, and C). These beds are systematically intercalated in river deposits (FA5; Fig. 7C and D). Conglomerate clasts are relatively immature whereas the matrix commonly includes planar laminations and wave ripple laminations in sands, frequently associated with shells or shell fragments accumulations. Frequently, thin concentric carbonate laminae coat conglomerate clasts to form cm- to dm-scale isolated oncolites (Fig. 7C and D). In places, adjacent oncolites form clast-supported conglomerates, topped by dm- to m-thick continuous beds made of upward growing domal stromatolites (Fig. 7E). The second type of FA4 deposits corresponds to intervals of several meters including dm- to m-scale very well-sorted sandstone beds that are either tabular of channelized with erosional lower boundaries (Fig. 7F, G) separated by dm-scale massive mudstone beds. Sandstones beds include planar laminations, occasional climbing-ripples and rare dm-scale cross-laminations.
In the first type, mollusks in bioclastic sandstone and packstone indicate nearshore environments while wave ripples and oncolites suggest the recurrent influence of waves. The poor sorting of conglomerates and sandstones and the low maturity of pebbles suggest the absence of coastal transport. As such, fluvial tributaries that supplied sediment in the lake were close to depositional areas. This type of FA4 therefore derives from gravity flows in the form of hyperconcentrated flows (Mulder and Alexander, 2001) and/or from debris flows (Talling et al., 2012) that were subsequently partially reworked by waves forming
fluvial-Journal Pre-proof
22
induced deposits in the nearshore domain. During river-flood, rivers generated flows that directly entered the lake and deposited coarse sediments in the nearshore domain forming mouth bar complexes. Waves then partially reworked previously deposited material and mixed river-derived sediments with in situ biogenic carbonate nearshore deposits (i.e., mollusk shells and microbialites). This type of FA4 includes coastal alluvial fan deposits. In places, long-term abandonment or avulsion of river channels allowed washing and sorting of oncolites by waves and subsequent development of thick carbonate intervals made of domal stromatolites (Fig.7E). The development of the carbonate interval stopped when alluvial sedimentation restarted. The second type of FA4 deposits characterized by tabular or channelized sandstone beds reveals sedimentation in the form of unconfined or confined turbulent flows, respectively (Wright 1977). Stacking of several sandstone beds separated by dm- to m-scale mudstone intervals suggest recurrent flows that broadly affected broadly the same areas. This suggests the proximity of river mouths where river floods might have repeatedly generated hyperpycnal flows that supplied sands in the nearshore domain forming river mouth complexes. Finally, both types of FA4 are interpreted as river-dominated nearshore deposits.
4.1.5. River deposits (FA5) Alluvial plain (FA5-a)
FA5-a deposits consist of tens of intervals of >10 m thick composed of sandy mudstone to muddy sandstone. These deposits include lenticular sediment bodies that are tens to hundreds of meters wide and meters thick, made of fine to medium conglomerates or coarse sandstones (Fig. 8A and B). In sandy mudstones to muddy sandstones intervals, primary depositional structures are difficult to observe, yet crude horizontal stratification seems to prevail. Pervasive termite nests are observed (Fig. 8C), in places connected to each other (Duringer et
Journal Pre-proof
23
al., 2007). Occasional ant galleries also occur (Tiercelin et al., 2010). Embedded lenticular sediment bodies are erosion-based, showing dm- to m-scale trough cross-laminations (Fig. 8D) broadly oriented basinward. Occasionally, matrix-supported fine conglomerates in dm-scale fining-up intervals are observed (Fig.8E). Bioturbation is frequent in the form of rhizoliths (Fig. 8F and G).
Sandy mudstones to muddy sandstones reflect deposition from both suspension fallout and tractional currents. The abundance of rhizoliths and social insect nests indicates terrestrial areas stable enough for recurrent soil development (plant growth and activity of soil organisms). Sandy mudstones to muddy sandstones reflect deposition of overbank fines during river overflows. During river overflow, sand is deposited on the alluvial plain. Subsequently, just after the peak of flood when the alluvial plain is flooded, mud deposited. Between two river flood events, soils developed that resulted in homogenization of previously deposited muds and sands to form the currently observed mixture of sandy mudstones to muddy sandstones. In coarse lenticular sediment bodies corresponding to channels infill, dm- to m-scale through cross-stratifications suggest migrating dunes and bars revealing tractional currents attributed to dilute flows during lower flow regime conditions (Allen, 1964, 1982). The occasional occurrence of fining-up intervals evidence occasional sedimentation from gravity flows while the presence of a muddy matrix suggests sedimentation from cohesive debris flows (Blair and McPherson, 1994, 2009). The large-scale lenticular geometry reveals that both dilute and debris flows were confined in wide and shallow channels. Finally, FA5-a deposits are interpreted to represent infill of braided river channels (Allen, 1964; Blair and McPherson, 1994); the broadly eastward directions of paleoflows suggest channels originating from the western rift shoulder. Thus, overbank deposits laterally associated with alluvial channels indicate organized stream flows that reflect alluvial plain systems (Miall, 1996; Bridge, 2003).
Journal Pre-proof
24
Alluvial fan (FA5-b)
FA5-b are included in tens of meters thick and hundreds of meters wide sediment packages. Two types are distinguished. The first type of FA5-b is dominated by successive m-thick intervals of matrix-supported coarse conglomerate separated by dm- to m-scale beds of sandstones to fine conglomerates (Fig.8H). Coarse conglomerates show clasts ranging from pebbles up to boulders (Fig. 8I) while matrix corresponds to muddy coarse sands and gravels. Conglomerates are mostly massive even if faint horizontal laminations are occasionally observed. Intercalated, dm- to m-scale sandstones and fine conglomerates are moderately-sorted in horizontal stratifications. Common dm-scale long rhizoliths are observed, affecting all lithologies. The second type of FA5-b consists of dm-scale planar beds made of poorly-sorted coarse sandstones intervals sharply alternating with fine conglomerates intervals (Fig. 8J). Faint horizontal laminations prevail in all lithologies, in places associated with dm-scale trough-cross laminations. Locally, dm-scale intervals of medium conglomerates showing oriented and imbricated clasts are intercalated. Even if rhizoliths are also observed, their abundance is lower compared to that in the first type.
In the first type of FA5-b, massive matrix-supported conglomeratic intervals reflect debris flows (Blair and McPherson, 1994, 2009) whereas occasional intercalated sandstone beds indicate occasional deposition from dilute flows during upper flow regime conditions (Allen, 1964; 1982). Rhizoliths suggest repeated and durable interruptions of flows favoring vegetation development during non-depositional periods. The second type of FA5-b reveals a sedimentation dominated by tractional currents from dilute flows during upper flow regime conditions (Allen, 1964; 1982). In places, sedimentation that originated from dilute flows is associated with sedimentation from concentrated to hyperconcentrated flows (Mulder and Alexander, 2001). In both types, the rarity of channelized features and occurrence of sheet
Journal Pre-proof
25
form deposits evidence unconfined flows typical for sedimentation in alluvial fan systems. The first type is dominated by debris flows while the second type suggests sedimentation rather dominated by sheetflood processes (Blair and McPherson, 1994, 2009; Leleu et al., 2005, 2009).
4.2. Sequence stratigraphy and high-amplitude paleolake fluctuations
Following the interpretation of depositional environments (FA1-FA5) and observation of their stacking patterns (Figs. 4, 9, 10, 11, 12), we delineated T-R sequences over the complete succession and propose an interpretative lithostratigraphic chart (Fig. 13). In total, 7 high-amplitude sequences (S1-S7) are delineated from ~4.00 to ~1.25 Ma. Their limits and compositions are presented hereafter.
Directly overlaying the Gombe Basalt, the succession starts either with alluvial fan deposits (FA5; sections 1, 2, 3 and 4) or offshore mudstones (FA1; section 5). In section 2, alluvial fan deposits are then overlain by 3-5 m thick transitional deposits whereas in sections 1, 3 and 4, they are directly overlain by 5-10 m thick offshore lacustrine deposits. Offshore lacustrine deposits grade upward to 1-4 m thick transitional (FA2) and/or shoreface (FA3-a) depositional environments (sections 3 and 4). This succession reveals a lake transgression onto subaerial alluvial fans or directly onto the Gombe Basalts (Fig. 9A). Above, the transitional (FA2) and shoreface (FA3-b) deposits indicate a subsequent shallowing trend attributed to a lake regression. The top of shoreface deposits in sections 3 and 4 marks the upper boundary of the sequence S1 (Fig. 4) and thus the lower boundary of S2 (SB2). The maximum flooding interval of sequence 1 (MFI1) is estimated in the offshore lacustrine deposits.
Overlying SB2, 10-15 m thick offshore lacustrine deposits (FA1) are observed in sections 3 and 4. Upward, they grade to either 1-3 m thick river-dominated nearshore (FA4;
Journal Pre-proof
26
section 3), shoreface (FA3-a, section 4) or transitional deposits (FA2) characterized by shelly storm beds (section 5) and then, in sections 3, 4 and 5, to 10-15 m thick river deposits (FA5) (Figs. 4, 9B and C, 10A and B). Section 3, 4 and 5 show a rapid deepening of the lake above SB2 followed by the progressive shallowing and an emersion represented by river deposits. In sections 4, river deposits (FA5) are directly erosionally overlying a river mouth complex (F4) and offshore deposits (FA1), infilling incised valleys (Fig. 10D and E). In section 5, river deposits show faint clinoforms that dip toward the central portion of the basin (Fig. 10A) revealing a progradational trend in this package. In sections 3, 5 and 6, river sediments are topped by an erosional surface underlined by aligned pebbles, frequently coated by microbialites (Fig. 10C). Above this erosional surface, dm- to m-scale beach deposits (FA3-a) are observed in section 3 (Fig. 11A), overlain by 20-30 m thick offshore deposits (FA1) marking the onset of S3 (Fig. 11B). In sections 5 and 6, offshore deposits directly overlay river deposits (FA5). In all sections, the upper boundary of river deposits (FA5) constitutes the top of S2 and, therewith, the sequence boundary of sequence S3 (SB3). Located in more distal part, section 7 is mostly composed of offshore material (FA1) occasionally intercalated by deposits from either transitional (FA2) or nearshore (FA3) depositional environments. In section 7, two sequences and the onset of a third one are also delineated supporting interpretations in more proximal domains.
Indeed, rirectly above SB3, ~30-40 m of offshore mudstones (FA1) are observed (sections 6, 7 and 8; Fig. 11B). Upwards, offshore mudstones grade to m-scale sandstones and conglomerates deposited in river-dominated nearshore (FA4) environment, in places associated with storm deposits. Overlaying, river-dominated nearshore deposits progressively grade to a 90 m thick interval of river deposits (FA5-a), which show alternations of overbank deposits, alluvial channels that grade upward to alluvial fan deposits (Fig. 11C). For the same fluvial interval, Harris et al. (1988) report 160 m, before reaching the Lomekwi Tuff.
Journal Pre-proof
27
However, even if we did not observe such thickness on field, description by these authors reveals broadly similar river deposits all along the succession and as such, do not imply changes in our sequence delineation. Indeed, the progressive transition from offshore (FA1), to transitional (FA2), river-dominated nearshore (FA4) and then river (FA5) deposits reveal a general progradation. This sequence constitutes the regressive upper part of S3 (Fig. 4) and is topped by SB4. The MFI3 is estimated slightly below the Tulu Bor Tuff.
Alluvial plain deposits with a thickness of 35-40 m (section 9) directly overlie SB4. These sediments represent predominantly overbank deposits in alluvial plain environment (FA5-a; Fig. 11D) and they include the Lokalalei and Kokiselei Tuffs. In the upper part of section 9, two intervals of nearshore deposits (FA3-b) intersperse these river deposits (Fig. 11E). The second nearshore interval is supposed to coincide with the 7-8 m thick basal nearshore interval observed in the lowermost part of section 10 (Fig. 4). In this section, nearshore deposits correspond to low-energy coastal swamp (FA3-b). Upwards, a 25 m thick package of alluvial plain deposits is overlain by a m-scale nearshore (FA3) interval grading upward to shoreface (FA3-a) and then offshore mudstones (FA1). Offshore mudstones (FA1) are 40-45 m thick (Fig. 11F), in places intercalated by shoreface deposits (FA3-a). This succession forms the transgressive part of S4.
In section 12, about 20 m-thick wave-dominated nearshore deposits (F3) are identified (Fig. 12A) above the offshore mudstones, evidencing a contraction of the lake (Nutz et al., 2017). This contraction started ~15 m below, where the maximum flooding interval of S4 is estimated, and corresponds to the regressive part of S4.
Upward, nearshore deposits are overlain by transitional deposits (FA2) grading to offshore mudstones (FA1) marking the onset of a subsequent transgression attributed to S5 (Fig. 4). In section 13, the regressive part of S4 is not observed. Here, above the KBS tuff, 65 m thick of offshore mudstones (FA1) are present. They grade upward to 20 m thick
Journal Pre-proof
28
transitional deposits (FA2) into which the Etir Tuff is identified. In the uppermost part of section 13, 15 m-thick river-dominated nearshore (FA4) and shoreface (FA3-a) sediments are observed, which are correlated with the lowermost part of section 14. This succession records a shallowing attributed to the regressive part of S5.
Above SB6, 40 m of offshore mudstones (FA1), reveal a subsequent transgression attributed to the lower part of S6 (Fig.4). Hence, the top of shoreface deposits (FA3-a) at the bottom of section 14 is interpreted as the top of S5 and the lower limit of S6 (SB6), this long-term regressive trend of S5 marks a contraction of the lake before another transgression that represents an expansion of the lake. Upward, offshore deposits are overlain by a 50-60 m thick interval of deposits, commonly embedded by shoreface (FA3-a) and river-dominated nearshore (FA4) intervals (Fig. 4). Overlying, 20 m thick offshore mudstones (FA1) evidence a subsequent transgression (Fig. 12B, C). The interval of river deposits reflects an emersion before another subsequent flooding. As such, this interval marks the regression associated with the upper part of S6 and the transgression coeval with the lower part of S7 (i.e., SB7).
Sections 17 and 18, which are located closer to the MRFL fault indicate that the offshore mudstones are capped by a 120 m thick interval that consists of alluvial plain deposits (FA5-b; Fig. 12D, E and F), in places intercalated by m-scale river-dominated nearshore deposits (Fig. 12D, E). This interval corresponds to the regressive part of S7. Although our sections end ~15 m above the Middle Nariokotome Tuff, at ~1.25 Ma, data in Harris suggest an interval of river-derived deposits similar to FA5 embedded by common microbial constructions (oncolites) reflecting river-dominated nearshore deposits (FA4) until ~0.75 Ma. According to Harris et al., (1998), progradation of such alluvial system remained limited with a shoreline that has fluctuated between 2 and 4 km far from the MRLF.
Journal Pre-proof
29
The interval between ~4 and ~3.44 Ma includes the Lonyumun and Kataboi Members. This interval records two high-amplitude sequences (S1 and S2) and the lower part of a third high-amplitude sequence (S3) revealing two major T-R cycles and a subsequent Transgression (Fig. 13). The shoreline fluctuated from the MRLF to ~8 km eastward. Lying directly onto the Gombe Basalts, the lowermost part of S1 is estimated at ~4 Ma. This time frame is further supported by the presence of the Moiti Tuff (3.97 Ma) in offshore mudstones (section 7), revealing that lacustrine conditions existed prior to this age. The top of S1 is not dated and no tuff is available to provide an absolute age. However, the regressive part of S2 is estimated around 3.6 Ma as revealed by the K82-742 and Loruth Tuffs identified in section 3 (Table 2). Above, the transgression associated with S3 reached its maximum slightly after 3.44 Ma (Fig. 4). In section 7, the presence of deposits (FA1, FA2 and FA3-b) that formed under water during the entire considered time interval shows that a lake continuously occupied the basin during this period even if fluctuations occurred. From 3.44 Ma to 1.89 Ma, the Lomekwi, Lokalalei and Kalochoro Members record the upper part of sequence S3 and the lower part of sequence S4 revealing a long-term regression followed by a subsequent transgression. Transition from the regressive trend of S3 to the transgressive trend of S4 is estimated to be slightly older than the Lokalalei Tuff (i.e., slightly older than ~2.53 Ma) where alluvial plain deposits become predominant. As such, the long-term regressive trend associated with S3 is estimated between ~3.44 and ~2.53 Ma while the long-term transgressive trend of S4 is estimated to start after ~2.53 Ma. The maximum flooding interval of S4 (i.e., MFI4) is estimated ~15 m below the KBS Tuff, marking the onset of the regressive part of S4 slightly before 1.89 Ma. Close to the border fault, 10 m-thick wave-dominated deposits (F3) embedded in river deposits reflect this maximum flooding interval (Fig. 11G). Superimposed, three higher-frequency sequences are observed during the long-term transgression of S4 (Figs. 4, 13). From ~1.87 to ~0.75 Ma, the Kaitio, Natoo and Nariokotome Members record the
Journal Pre-proof
30
upper part of sequence S4 and 4 sequences referred to as S5, S6 and S7 (Fig. 4). Limits of sequences are particularly uncertain in this interval, however SB5 is estimated at ~1.76 (Nutz et al. 2017) while SB6 and SB7 are estimated slightly younger than ~1.44 Ma and between ~1.43 and ~1.4 Ma, respectively. The maximum flooding interval (i.e., MFI7) of S7 is estimated at ~1.4 Ma while the regressive part of S7 likely includes all the succession until 0.75 Ma, even if subordinate-order cycles might have occurred.
4.3. Sedimentary systems
Combining the interpretation of depositional environments and their lateral relationships (Fig. 13), two sedimentary systems reconstructed in the West Turkana area are presented and referred to as type-1 and type-2 (Fig. 14). Each sedimentary systems represents the coexistence of different depositional environments along an ideal downslope transect from the border fault to the central portion of the basin. These sedimentary systems alternatively developed between 4.00 and 1.25 Ma as sedimentation varied through time in the West Turkana area.
The type-1 sedimentary system is characterized by the predominance of wave-influenced coastal deposits. From the border fault to the central portion of the basin, the type-1 sedimentary system consists of a few km-wide river deposits near the border fault. Where observed, river deposits form alluvial fans mostly made of fine conglomerate to gravelly sandstones indicating sheetflood-dominated alluvial fans (FA5-b), which are laterally associated with alluvial plain deposits (FA5-a) showing alternations of overbank deposits and channels. Alluvial fans are fed by rivers draining the western rift shoulder. Basinward, river systems grade rapidly to thick coastal wedges that consist of wave-dominated nearshore deposits (FA3) such as shoreface, beaches and washover fans that form wide strandplain.
Journal Pre-proof
31
Finally, wave-dominated nearshore deposits connect laterally to storm-dominated transitional (FA2) and then to offshore deposits (FA1). The type-1 sedimentary system is characterized by (i) the limited development of alluvial fans along the border fault and (ii) the important development of wave-dominated coastal wedges. Type-1 sedimentary systems are conspicuously recognized between ~4 and ~3.40 Ma and between ~2.5 and ~1.42 Ma (Fig. 13).
In contrast, the type-2 sedimentary system is characterized by the predominance of river deposits. From the border fault to the central portion of the basin, type-2 is characterized by wide conglomeratic alluvial fans which have been deposited mostly by debris flows. Laterally, alluvial fans grade to an alluvial plain (FA5-a) and then to river-dominated nearshore deposits (FA4). Toward the basin, these deposits rapidly grade to offshore mudstones (FA1). Finally, in opposition to type-1, type-2 sedimentary system are characterized by the development of (i) wide and thick river deposits along the border fault in the form of alluvial fans and plains, (ii) river-dominated nearshore deposits in more distal areas and (iii) a scarcity of wave-dominated coastal wedges and features. The type-2 sedimentary system is observed during periods between ~3.40 and ~2.5 Ma and after ~1.42 Ma (Fig. 13) in thick packages associated with regressive trends during periods of long-term progradation.
Fundamental differences between type-1 and -2 sedimentary systems derive from the competition between the development of wave-dominated coastal and river-dominated systems in West Turkana. Fluctuation in the amount of sediments entering the basin from the western rift shoulder likely controlled the shifts from one system to the other. Indeed, during periods of reduced sediment supply, alluvial systems were smaller and processes related to waves and alongshore drift were dominant forming successive prograding and retrograding strandplain systems at the origin of type-1 sedimentary system. Lake level fluctuations were
Journal Pre-proof
32
the main mechanism to drive transgression-regression cycles revealing dynamics of an ―accommodation-dominated system‖ (Neal and Abreu, 2009; Zhang et al., 2019). In contrast, during periods characterized by an important sediment supply, alluvial systems developed and prograded toward the basin forming quasi-continuous regressive intervals regardless paleolake fluctuations. The flux of sediments towards the basin inhibited the expression of wave-related processes, except perhaps during infrequent short and abrupt lake level rises. Hence, type-2 sedimentary system rather reveals dynamics associated with ―supply-dominated systems‖ (Burgess and Hovius, 1998; Carvajal and Steel, 2006; Zhang et al., 2019).
4.4. Paleovegetation changes
Both the Nachukui and the Shungura records of δ13Cpedogenic carbonate exhibit very widespread
values (Fig. 15). Ranging from -10‰ to 0‰ these values indicate heterogeneity in the vegetation, i.e. closed and open habitats likely co-occurred within a given area, as is observed today for the riparian forest along the Omo River in an otherwise open savanna-dominated landscape. After data processing, marked trends emerge from the δ13Crecords (Fig. 15). The isotopic record of soil carbonate from the Nachukui Fm shows an almost steady increase in C4
biomass, suggesting gradual aridification from ~3.90 Ma to ~0.90 Ma in West Turkana area. A significant biome change occurred at ~3.25 Ma, when woodland/bushland/shrubland were replaced by wooded grassland, suggesting a change in water supply as woody cover dropped below 40%. The woody cover at West Turkana reached its smallest extent at ~2.00 Ma, and between ~1.50 and ~1.30 Ma. In the Omo Valley, δ13C record of the the Shungura shows a different pattern. Interestingly, the Omo Valley exhibits a much longer record of woodland/shrubland/bushland than West Turkana, which lasted until ~1.85 Ma. Woody cover was always greater in the Omo Valley than in West Turkana until ca 1.85 Ma, suggesting