HAL Id: hal-03095926
https://hal.archives-ouvertes.fr/hal-03095926
Submitted on 4 Jan 2021HAL is a multi-disciplinary open access
archive for the deposit and dissemination of sci-entific research documents, whether they are pub-lished or not. The documents may come from teaching and research institutions in France or abroad, or from public or private research centers.
L’archive ouverte pluridisciplinaire HAL, est destinée au dépôt et à la diffusion de documents scientifiques de niveau recherche, publiés ou non, émanant des établissements d’enseignement et de recherche français ou étrangers, des laboratoires publics ou privés.
Quantitative Trait Loci involved in the reproductive
success of a parasitoid wasp
Romain Benoist, Claire Capdevielle-Dulac, Célina Chantre, Rémi Jeannette,
Paul-André Calatayud, Jean-Michel Drezen, Stéphane Dupas, Arnaud Le
Rouzic, Bruno Le Ru, Laurence Moreau, et al.
To cite this version:
Romain Benoist, Claire Capdevielle-Dulac, Célina Chantre, Rémi Jeannette, Paul-André Calatayud, et al.. Quantitative Trait Loci involved in the reproductive success of a parasitoid wasp. Molecular Ecology, Wiley, 2020, 29 (18), pp.3476-3493. �10.1111/mec.15567�. �hal-03095926�
1
Quantitative Trait Loci involved in the reproductive success of a parasitoid
1
wasp
2 3
Romain Benoist1, Claire Capdevielle-Dulac1, Célina Chantre1, Rémi Jeannette1, Paul-André
4
Calatayud1,2, Jean-Michel Drezen3, Stéphane Dupas1, Arnaud Le Rouzic1, Bruno Le Ru1, Laurence
5
Moreau4, Erwin Van Dijk5, Laure Kaiser1, Florence Mougel1, *
6 7
1 Université Paris-Saclay, CNRS, IRD, UMR Évolution, Génomes, Comportement et Écologie, 91198, Gif-sur-8
Yvette, France.
9
2icipe, International Center of Insect Physiology and Ecology, P.O. Box 30772-00100, Nairobi, Kenya 10
3 Institut de Recherche sur la Biologie de l’Insecte (UMR 7261, CNRS, Université Tours), 37200 Tours, France 11
4 Université Paris-Saclay, INRAE, CNRS, AgroParisTech, GQE - Le Moulon, 91190, Gif-sur-Yvette, France. 12
5 Institut de Biologie Intégrative de la Cellule (UMR 9198, CNRS, CEA, Université Sud, Université Paris-13
Saclay), Avenue de la Terrasse, 9190 Gif-sur-Yvette, France
14 15
* Corresponding author: Florence.mougel-imbert@egce.cnrs-gif.fr
16 17 18
Running Title:
Reproductive success QTL of a parasitoid wasp 19 20 21Abstract
22 23Dissecting the genetic basis of intraspecific variations in life history traits is essential to understand 24
their evolution, notably for potential biocontrol agents. Such variations are observed in the 25
endoparasitoid Cotesia typhae (Hymenoptera: Braconidae), specialized on the pest Sesamia 26
nonagrioides (Lepidoptera: Noctuidae). Previously, we identified two strains of C. typhae that differed 27
significantly for life history traits on an allopatric host population. To investigate the genetic basis 28
underlying these phenotypic differences, we used a Quantitative Trait Locus (QTL) approach based on 29
Restriction Site Associated DNA markers. The characteristic of C. typhae reproduction allowed us 30
generating sisters sharing almost the same genetic content, named clonal sibship. Crosses between 31
individuals from the two strains were performed to generate F2 and F8 recombinant CSS. The 32
genotypes of 181 clonal sibships were determined as well as the phenotypes of the corresponding 33
4000 females. Informative markers were then used to build a high-quality genetic map. These 465 34
markers spanned a total length of 1300 cM and were organized in 10 linkage groups which 35
corresponded to the number of C. typhae chromosomes. Three QTLs were detected for parasitism 36
2
success and two for offspring number, while none were identified for sex ratio. The QTLs explained 37
respectively 27.7% and 24.5% of the phenotypic variation observed. The gene content of the genomic 38
intervals was investigated based on the genome of C. congregata and revealed 67 interesting 39
candidates, as potentially involved in the studied traits, including components of the venom and of the 40
symbiotic virus (bracovirus) shown to be necessary for parasitism success in related wasps. 41
42
Keywords
: Quantitative Trait Loci, parasitism success, offspring number, polydnavirus, venom, 43parasitoid, linkage map 44
3
1 Introduction
46
Biotic interactions exert a strong selection pressure on living organisms and constitute a major 47
evolutionary strength. Among them, intimate relationships such as host-parasite associations may lead 48
to specific evolutionary patterns, namely co-evolution (Thompson, 2009; Woolhouse, Webster, 49
Domingo, Charlesworth, & Levin, 2002). The process of co-evolution corresponds to adaptive changes 50
in the two partners under reciprocal influence. It requires genetic variation within the parasite and 51
host populations influencing the outcome of the interaction. Deciphering the components of this 52
genetic variation, i.e. the number of genes involved, the interactions between them, their potential 53
pleiotropic effects and their impact on the organism’s fitness, is of prime importance to elucidate the 54
genomic bases of co-adaptation. 55
Among parasites, insect parasitoids represent an interesting case study of environmental adaptation 56
both to improve our knowledge of biotic interactions and in the applied perspective of biocontrol 57
(Wang, Liu, Shi, Huang, & Chen, 2019). These species spend their larval stage as parasites and live freely 58
at the adult stage. They behave in an intermediate way between parasites and predators because they 59
need to kill their host to develop. The larval environment is thus mainly biotic and parasitoid effective 60
reproduction relies on fine adaptation to their host (Godfray, 1994). 61
The host adaptation encompasses the ability to detect and parasitize efficiently the host. Host 62
detection is based on localizing the host as well as recognizing its suitability. Once a suitable host is 63
found, parasitoids have to optimize their oviposition behavior to maximize their fitness. This is 64
illustrated by the occurrence of different oviposition strategies (Godfray, 1994; Waage & Greathead, 65
1986). Usually, parasitoids are classified as solitary or gregarious depending upon the offspring number 66
produced per host, with one for solitary (not necessarily implying the injection of only one egg) and 67
several for gregarious. In haplodiploid Hymenoptera, oviposition strategy also includes sex ratio of the 68
4
progeny, which corresponds to the proportion of fertilized eggs that a female lays (Heimpel & de Boer, 69
2008). Both the number of eggs injected (and therefore the offspring number) and the sex ratio are 70
under adaptive constraints. For example, the hosts’ carrying capacity limits the number of parasitoid 71
larvae that could develop and thus impacts the behavior a species will adopt in the distribution of eggs 72
among hosts encountered by a female (Godfray, 1994; Le Masurier, 1987, 1991). Environmental 73
factors are also perceived and taken into account by parasitoid females to adjust their clutch size and 74
in some cases their sex ratio (Charnov & Skinner, 1985; Waage & Ming, 1984). Those two traits 75
(offspring number and sex ratio) are therefore genetically and environmentally determined. 76
Following oviposition, parasitoid larvae development depends on the parasitoid ability to inhibit host 77
immune defenses and alter its growth to the parasitoid benefit. This is especially important for 78
endoparasitoid species which develop in host haemocoele, where host haemocytes are recruited to 79
encapsulate parasitoid eggs or larvae (Quicke, 2014). The virulence arsenal developed by parasitoids 80
to ensure the development of their progeny, hereafter defined as parasitism success, is quite 81
phenomenal and combines factors derived from maternal and embryonic origins. Depending on 82
species, the maternal factors encompass venom, ovarian proteins, polydnavirus and virus-like particles 83
and are injected along with eggs in the host (Asgari & Rivers, 2011; Herniou et al., 2013; Pennacchio & 84
Strand, 2006; Pichon et al., 2015; Strand & Burke, 2015). The embryonic factors encompass 85
teratocytes, which are cells derived from the membrane surrounding the parasitoid embryo and 86
parasitoid larvae itself (Strand, 2014). The most studied factors are probably venom and polydnavirus. 87
Venom is mainly devoted to host metabolism manipulation, ensuring parasitoid development 88
(Mrinalini & Werren, 2016). Within hymenoptera the venom gland is a conserved organ but venom 89
composition seems to be highly variable depending on species (Moreau & Asgari, 2015). 90
Polydnaviruses are double-stranded DNA viruses associated with few groups of hymenopteran 91
parasitoids (Webb, 1998). The polydnavirus associated with Braconidae are called Bracoviruses, 92
5
whereas those associated with Ichneumonidae are called Ichnoviruses. They derive from the 93
integration viruses into the genome of ancestral parasitoids and are now vertically transmitted (Bézier, 94
Annaheim, et al., 2009; Bézier, Herbinière, Lanzrein, & Drezen, 2009; Drezen et al., 2017; Volkoff et al., 95
2010). In species harboring polydnaviruses, viral particles contain viral DNA circles bearing virulence 96
genes which are expressed in host tissues and involved in the inactivation of the host immune system 97
and alteration of host growth (Beckage & Drezen, 2012; Beckage & Gelman, 2004; Edson, Vinson, 98
Stoltz, & Summers, 1981; Marti, 2003; Wyler & Lanzrein, 2003). 99
Besides the interspecific variation in virulence arsenal and more generally in reproductive success 100
traits, intraspecific divergence in life history traits is also observed in parasitoid species (Chassain & 101
Bouletreau, 1987; Dubuffet et al., 2009; Henter, 1995; Kaiser, Couty, & Perez-Maluf, 2009; Legner, 102
1987; Orzack & Gladstone, 1994). This polymorphism underlies the ability of parasitoids to evolve in 103
response to host selection. Identifying the polymorphic genes involved in parasitoid success is thus of 104
prime importance to identify key components and understand the physiological and behavioral basis 105
of host adaptation. 106
The identification of genes underlying such complex traits is hampered by their multifactorial 107
determinism and high plasticity. Quantitative trait loci (QTL) approaches are optimal to overcome such 108
complex situations (Broman & Sen, 2009; Lander & Botstein, 1989; Mackay, Stone, & Ayroles, 2009). 109
These approaches are also particularly relevant in Hymenopteran species because of their haplodiploid 110
sex determination system. Indeed, in these species males are haploid and produce spermatozoids all 111
bearing identical genetic content. So, when a male is crossed with a completely homozygous female, 112
all daughters produced are genetically identical. This allows us to repeat phenotypic measures on 113
females with the same genotype, reducing the impact of environmental variation (Dupas, Frey, & 114
Carton, 1998; Pannebakker, Watt, Knott, West, & Shuker, 2011; Velthuis, Yang, Van Opijnen, & Werren, 115
2005). To our knowledge, in parasitoids, the QTL approach has been performed only once on sex ratio 116
6
and offspring number in Nasonia vitripennis (Pannebakker et al., 2011) and never performed to study 117
parasitism success. In this paper we developed a QTL approach to determine the genetic basis of these 118
traits in a parasitoid species: Cotesia typhae (Fernández-Triana) (Hymenoptera, Braconidae). 119
Cotesia typhae is an African gregarious endoparasitoid, parasitizing exclusively larvae of the crop pest 120
Sesamia nonagrioides (Lefebvre) (Lepidoptera, Noctuidae). It was formerly undistinguished from the 121
generalist species Cotesia sesamiae composed of several populations with different host ranges, but 122
was recently recognized as a distinct species (Kaiser, Dupas, et al., 2017; Kaiser, Fernandez-Triana, et 123
al., 2017; Kaiser et al., 2015). The ability of C. typhae to parasitize a population of S. nonagrioides, an 124
invasive species in France, was previously studied in a biological control perspective (Benoist et al., 125
2017). This study highlighted differences between two strains of C. typhae named Kobodo and 126
Makindu specifically in their reproductive success on this allopatric host population. Indeed, Kobodo 127
females had a higher rate of parasitism success and produced more offsprings than Makindu females 128
under laboratory conditions. The marked difference in the reproductive success of the two strains sets 129
the stage for studying the genetic basis of these traits. Furthermore, an annotated genome of the close 130
relative C. congregata recently became available, which can be used as a reference for the 131
identification of genes within QTL (Gauthier et al., 2020). 132
The aim of this work was to decipher the genetic architecture involved in the variation of the 133
reproductive success of C. typhae. To do this, we developed a QTL approach based on Restriction site 134
Associated DNA markers (RAD-tags) to detect genomic regions associated with parasitism success, 135
offspring number and sex ratio traits. The gene content in the identified QTL region was investigated 136
based on the annotated genome of Cotesia congregata. 137
138
2 Materials and Methods
7 2.1 Biological Material
140
The Kobodo and Makindu C. typhae parasitoid strains were obtained from adults emerged from 141
naturally parasitized S. nonagrioides caterpillars collected in the field at two localities in Kenya: Kobodo 142
(0.679S, 34.412E; West Kenya; 3 caterpillars collected in 2013) and Makindu (2.278S, 37.825E; South-143
East Kenya; 10 caterpillars collected in 2010-2011). These strains were reared separately at the 144
International Centre of Insect Physiology and Ecology (ICIPE, Nairobi, Kenya). Isofemale lines were 145
produced and maintained from these rearings from 2015 at the Evolution, Génome, Comportement et 146
Ecologie laboratory (EGCE, Gif-sur-Yvette, France), where cross experiments and phenotyping were 147
performed. 148
Two host strains of S. nonagrioides were used: a Kenyan strain initiated from caterpillars collected at 149
Makindu and a French strain initiated from individuals collected in maize fields (Longage-Berat area in 150
Haute-Garonne district, 43.368N, 1.192E and within a 10 km distance) which was renewed yearly. The 151
French strain was used for phenotyping, whereas the Kenyan strain was used for C. typhae rearing to 152
prevent any adaptation of the parasitoid to the French host. 153
The rearing protocol of C. typhae and S. nonagrioides is detailed in Benoist et al. (2020). 154
155
2.2 Genetic cross-design 156
Cotesia typhae is a haplodiploid species. Females are produced from fertilized eggs and are diploid, 157
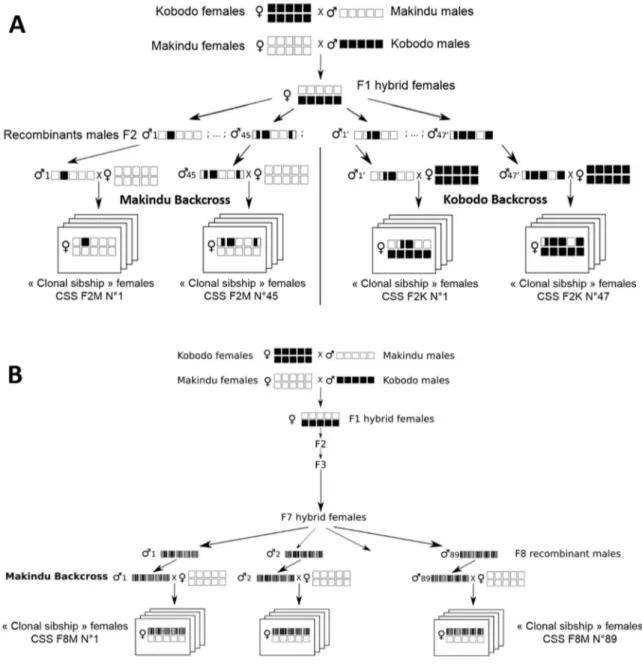
whereas males are produced from unfertilized eggs and are haploid. We combined two cross schemes 158
to produce F2 and F8 recombinant individuals (Figure 1). The production of F2 recombinant individuals 159
was used to build a genetic map. This dataset was completed by F8 recombinant individuals to increase 160
the number of recombination events for QTL detection. Three generations of sib-mating were first 161
8
realized for both Kobodo and Makindu parental lines. These sib-mating crosses following numerous 162
generations (around 50 for Kobodo and 20 for Makindu) of rearing in small populations led to highly 163
inbred parental lines. Virgin males and females from the parental strains were then crossed to 164
generate F1 individuals. Part of the F1 females were isolated and kept virgin (Figure 1A). All other F1 165
individuals were mixed in a single population, which was maintained to reach F8 generation (Figure 166
1B). At each generation, all adults were stored in the same cage to allow random mating and randomly 167
chosen females were used to produce the next generation to avoid overlapping between generations. 168
Several F7 females were isolated and kept virgin. Virgin females from F1 or F7 generation were allowed 169
to oviposit to produce respectively F2 and F8 recombinant males. For F2 males, each recombinant male 170
was backcrossed with a single female from Kobodo or Makindu parental strains. For F8 males, only the 171
Makindu strain was used, because a dominance of Kobodo alleles on these traits was susceptible to 172
mask phenotypic variation as indicated by a previous study (Benoist et al., 2017). Since no meiosis 173
occurs in males and parental strains are highly inbred, the offsprings from one recombinant male and 174
one female from a parental line contain recombinant females with almost the same recombinant 175
genotype at all loci (they were considered as genetically identical). Each female progeny was called a 176
clonal sibship – CSS in the following text (Pannebakker et al., 2011). In total, 181 CSS were produced: 177
45 from F2 Kobodo backcross, 47 from F2 Makindu backcross, and 89 from F8 Makindu backcross. This 178
experimental design allows replicated phenotyping for each recombinant genotype and thus the 179
measurement of proportion traits on one CSS as well as parasitism success (see below), which requires 180
several individuals to be assessed for accurate estimation, because of its variability. 181
182
2.3 Phenotyping 183
9
Between 15 and 20 females were tested for each CSS. In order to allow mating, sibling females were 184
left at least one day with their brothers in the same cage before the experiments (mating was not 185
controlled). The host caterpillars were placed individually under a 2cm diameter plastic top with one 186
female until the ovipositor insertion was observed. A female that refused to oviposit within 3 minutes 187
was discarded. Very few females were removed as host acceptance is very high (>90%) for the two 188
parasitoid strains (Benoist et al., 2020). After exposure, parasitized host caterpillars were kept in 189
rearing conditions until observation of either the formation of parasitoid cocoon mass (following the 190
emergence of the parasitoid larvae from the host), the death of the host without parasitoid emergence 191
or the formation of host pupa. After parasitoid emergence, each cocoon mass was placed in a tube to 192
obtain the adults. For each CSS, the parasitism success was calculated as the proportion of parasitized 193
hosts from which parasitoid larvae emerged. The two other traits were estimated, taking into account 194
successful parasitism only. The mean offspring number was calculated as the mean number of 195
parasitoid larvae that emerged from the host. The sex ratio for each CSS was determined by counting 196
the number of adult females, on one side, and the number of adult males, on the other, emerging from 197
each successful parasitism. To avoid bias, progenies of unmated females identified from their only 198
male content were not taken into account because the offspring number varies significantly between 199
mated and unmated females (Benoist et al., 2017). All phenotypic data are presented in the 200
supplementary Table S1. The broad-sense heritability in the CSS populations (H²) could not be 201
estimated for parasitism success due to the lack of repetitions: only one measure is obtained for each 202
CSS based on the number of success and failure of the parasitism. By contrast, each success led to the 203
estimation of an offspring number and of a number of males and females. For these two traits, a 204
generalized linear model (GLM) was built, taking into account CSS and backcross type to explain the 205
trait variation. We used the poisson” error family for the offspring number and the “quasi-206
10
binomial” error family for the sex ratio. Genetic variance was estimated from the sum of squares 207
associated with the CSS and it was divided by the total sum of squares to approach H². 208
209
2.4 RAD-Sequencing 210
A RAD-seq approach was performed in order to obtain genetic markers widely distributed in the 211
genome. For each CSS, DNA was extracted from a pool of females using the NucleoSpin Tissue kit 212
(Macherey-Nagel) and a RNase treatment was performed (Roche). All CSS DNA samples were digested 213
using PstI restriction endonuclease. The expected number of restriction sites was approximately 214
18,500 based on C. sesamiae kitale genome analysis (Gauthier et al., 2020). A P1 adapter containing 215
an Illumina adapter sequence, a 10 bp barcode (to identify CSS) and a sticky-end extremity, 216
corresponding to the PstI site, was ligated to the PstI-digested fragments. F2 and F8 samples were 217
pooled separately and adapter-ligated fragments were randomly sheared to obtain an average size of 218
600 bp. The two Illumina libraries were prepared by ligating a P2 adapter with a divergent end to DNA 219
fragments to ensure that only fragments with P1 and P2 adapters would be fully amplified. These 220
libraries were then amplified by PCR with P1 and P2 primers and paired-end sequenced on an Illumina 221
NextSeq 500 instrument. The read length was 75 bp (including 10 bp of the barcode and 6 bp of the 222
restriction site). 223
224
2.5 Identification of RAD locus and genotypes with Stacks 225
RAD-seq reads were trimmed to remove adaptors with Cutadapt v1.9.1 (Martin, 2011). RAD loci and 226
the associated genotypes were determined using the Stacks v1.48 software package (Catchen, 227
Hohenlohe, Bassham, Amores, & Cresko, 2013; Rochette & Catchen, 2017). The trimmed reads were 228
de-multiplexed and the barcodes were removed from reads using process radtags, discarding reads 229
11
with an uncalled base and/or low-quality score. F2 and F8 reads were treated separately. For each 230
sample, reads were grouped in “stacks” to build loci using two approaches: de novo (ustacks) and 231
reference-based (pstacks, in this case a reference genome is used to build loci). This double approach 232
maximized the number of detected markers as the available reference genome is a draft version and 233
is from a different species. Prior to de novo analyses, PCR duplicates were identified based on sequence 234
identity and removed using home-made software. Preliminary tests were performed to optimize 235
Stacks parameters: minimum depth coverage (-m) between 3 and 5, maximum distance between 236
stacks (-M) between 2 and 3 and the number of mismatches allowed to build the catalog (-n) between 237
0 and 2 were tested. The selected parameters (m=3, M=2, n=2) were those that maximized the number 238
of loci and minimized the variance between samples. For reference-based analyses, read pairs were 239
mapped to the closely related C. sesamiae kitale genome (Gauthier et al., 2020) using BWA v0.7.17 (Li 240
et al., 2009), and PCR duplicates sharing strict identical coordinates were removed with Samtools v1.9. 241
The error rate upper bound was fixed at 0.01 for F2 (used to define the locus catalog, see below) and 242
at 0.1 for F8. The deleveraging algorithm was used for de novo analyses. For all other parameters 243
default settings were used. A de novo and a reference-based catalogue were generated from all F2 244
stacks (choosing population option) using the cstacks program with default parameters. Both F2 and 245
F8 stacks were then matched to these catalogs to infer genotypes using the sstacks program with 246
default parameters. We thus obtained two sets of genotypes for each CSS (F2 and F8): one from de 247
novo and one from reference-based analysis. 248
249
2.6 Locus selection and genotype correction 250
The selection of markers from available loci was performed on F2 data. De novo and reference-based 251
data were treated separately. Loci respecting the following conditions were selected: (i) diverging at 1 252
12
to 3 nucleotide sites between Kobodo and Makindu strains; (ii) showing invariance within each 253
parental line; (iii) found in at least 70 CSS; (iv) showing no segregation distortion. For all retained 254
markers, some genotypes of F2 and F8 CSS could be corrected by taking advantage of the backcross 255
design. For each backcross type, only two genotypes are expected among CSS: homozygous for 256
parental allele or heterozygous. For a CSS from the Makindu backcross, if a genotype was inferred as 257
homozygous for Kobodo alleles it was corrected for heterozygosity, assuming that the second allele 258
was not detected because of low coverage. The same procedure was applied for CSS from the Kobodo 259
backcross. After locus selection and genotype correction, de novo and reference-based data were 260
merged as follows. Genotypes were compared for the markers shared between both analyses. If 261
inferred genotypes differed between de novo and reference-based analyses, the heterozygous ones 262
were retained: we assumed that it was more likely to miss a second allele than to detect a false positive 263
one. 264
Only four markers showed segregation distortion. In total, 102,446 genotypes were infered (181 265
samples x 566 markers) and fewer than 1% were corrected based on in silico analysis. The comparison 266
of de novo and reference-based approaches led to the detection of 400 genotype discrepancies 267
between the two approaches, which contributed to the improvement of the genotypic data. 268
269
2.7 Linkage map construction and correction 270
The construction of the linkage map was performed with CarthaGene v1.3 (de Givry, Bouchez, 271
Chabrier, Milan, & Schiex, 2005) and the F2 data. The LOD and genetic distance thresholds used for 272
linkage group identification were respectively 7 and 0.5 Morgan. Marker ordering was done with the 273
default set of algorithms (Defalgo option). For each CSS, genotypes were organized following the 274
linkage map order to visualize recombination events and to correct some genotypes. When crossovers 275
13
were detected on both sides of a marker, the corresponding genotype was questioned. In this case, 276
genotypes were encoded as missing values when coverage was below 10 (159 individual marker 277
genotypes) or manually sequenced (86 individual marker genotypes). The final dataset comprised 3143 278
missing genotypes (3% of the data set). A new map was then generated from corrected data. When 279
several markers were at null genetic distance on F2 and F8 data, the marker with more data was 280 retained. 281 282 2.8 QTL analysis 283
All QTL analysis were performed with R Software (R Core Team, 2018). For each CSS, the probability of 284
the genotypic states (KK, MM and KM for homozygous Kobodo genotypes, homozygous Makindu 285
genotypes and heterozygotes respectively) at every cM map position were estimated using the 286
package R/qtl v1.44-9 (Broman & Sen, 2009). At each position, additive and dominance indices were 287
determined with the following formulas: additive index = 2PKK + PKM; dominance index = PKM, with PKK
288
and PKM corresponding to the probability that the genotype was homozygous for Kobodo alleles or
289
heterozygous. 290
To identify QTL for each trait, multiple regressions using GLM were performed. Due to the cross 291
scheme, data could be classified into 3 backcross types which may influence their genotype: F2 292
backcross with Makindu strain, F2 backcross with Kobodo strain or F8 backcross with Makindu strain. 293
As a consequence, phenotypic variation was analyzed in several steps. In a first step, a GLM was built 294
for each trait, taking into account only the backcross type. They were based on the “quasi-binomial” 295
error family for parasitism success and sex ratio and on the “gaussian” error family for the mean 296
number of offsprings. 297
14
In a second step, all positions were scanned with a full GLM using residuals of the first model as 298
response variable and additive and dominance indices of the given position as explanatory variables. 299
Position LOD scores (LODPosition) were calculated using the formula: LODPosition = n/2 x log10
300
(RSSnull/RSSfull), where n is the sample size, RSSfull is the residual sum of squares of the full model with
301
additive and dominance indices, and RSSnull is the residual sum of squares of the null model (also based
302
on residuals but without explanatory variables). The significant LOD score threshold was estimated by 303
performing 2000 permutations between phenotypes and genotypes within cross types and taking the 304
5 % cut-off of the maximum LOD scores obtained as significant threshold value (Churchill & Doerge, 305
1994) The thresholds obtained were 3.06, 3.03, 3.01 for offspring number, parasitism success and sex 306
ratio respectively. 307
In the next step, additive and dominance indices at the position with the highest significant LOD score 308
were included to build a new model comprising this fixed position, and the genome was rescanned for 309
an additional QTL. The process was repeated until no more significant position was detected. Such a 310
process is especially powerful to detect genetically linked QTLs and QTLs in epistatic relationship. To 311
test for interactions between QTLs, interaction terms for all QTL pairs were added to the model, 312
including all QTLs detected. Each interaction term was then tested separately by an analysis of 313
deviance comparing the model with and without interaction terms. The interaction was declared 314
significant if the p-value was inferior to 0.05. For each trait, the final model that comprises all fixed 315
QTLs and their significant pairwise interactions is called “the complete model” in the following text. In 316
these models F8 backcross was the reference to calculate the intercept. 317
Additive and dominance coefficients are the estimated coefficients in these complete models. Additive 318
effect corresponds to the variation associated with one Kobodo allele. Dominance effect corresponds 319
to the variation resulting from the interaction between the parental alleles at one locus. Due to the 320
“quasi-binomial” error family used for parasitism success models, estimated coefficients for this trait 321
15
are given in logits scale. These coefficients were transformed using the inverse logit transformation to 322
estimate the parasitism success variation associated with additive and dominance effect (Crawley, 323
2012). The percentage of total phenotypic variance explained by each QTL was determined from the 324
complete models with the formula SSQTL/TSS, where SSQTL is the sum of squares associated to QTL and
325
TSS the total sum of squares. The confidence interval of each QTL position corresponded to all positions 326
around the QTL for which LOD score was above LOD score max – 2. 327
328
2.9 Candidate gene identification 329
Gene identification was performed by genomic comparison with the available genome of C. 330
congregata. We first assembled RADseq data from all samples with SPAdes v3.11.1 (Nurk et al., 2013). 331
All markers included in the QTL confidence intervals were mapped on the scaffolds obtained using 332
blastn v2.6.0+ (Boratyn et al., 2012). Scaffolds containing markers were then mapped to the annotated 333
genome of C. congregata using BLAST to identify genes in QTLs. For this genome, an automatic 334
annotation was performed and refined with manual inspection for some gene families (Bracovirus, 335
Venom, Immunity, Detoxification and Chemodetection. Gauthier et al., 2020). 336
337
2.10 Gene Ontology enrichment analysis 338
Gene Ontology (GO) enrichment was tested using the R package topGO (Alexa, Rahnenfuhrer, & 339
Lengauer, 2006). Annotations were those derived from blast2GO analyses of the Cotesia congregata 340
genome performed by Gauthier et al. (2020). Two set of genes were built for each trait based of the 341
gene content of QTL confidence interval. We compared the results of 4 algorithms implemented in 342
topGO, namely ‘classic’, ‘elim’, ‘weight’ and ‘weight01’ that integrate the hierarchical structure of Gene 343
16
Ontology in different ways. Retaining only nodes larger than 5 we computed Fisher tests for the three 344
categories of ‘Biological Process’, ‘Molecular Function’, and ‘Cellular Compartment’. 345 346
3 Results
347 3.1 Descriptive Statistics 348The two parental strains showed a substantial difference for parasitism success and offspring number, 349
but they did not differ for sex ratio (Table 1). The Kobodo strain was more efficient with a higher 350
parasitism success and a higher offspring number. The parasitism success of the clonal sibships (CSS) 351
from the Kobodo backcross was equivalent to those of the Kobodo parental strain. By contrast, the 352
parasitism success of the CSS from Makindu backcrosses (F2 and F8) was higher than the Makindu 353
parental strain, although below the Kobodo. The offspring number of CSS from the Kobodo backcross 354
was far higher than the Kobodo parental strain and the offspring number of the CSS from the Makindu 355
backcrosses were close to those of the Kobodo parental strain. Data showed a higly significant 356
correlation (Spearman's ρ = 0.505, p-value = 5.932 x 10⁻¹¹, calculated with all CSS) between the
357
parasitism success and offspring number, suggesting a relationship between both traits. The broad-358
sense heritability was 29.82 % for offspring number and 14.46% for sex ratio. 359
360
3.2 Marker selection and genotype identification 361
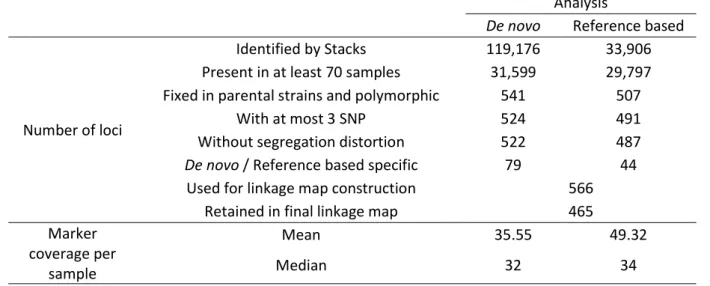
The number of loci identified by Stacks varied considerably between the two approaches: 119,176 and 362
33,906 for de novo and reference-based, respectively (Table 2). However, the number of remaining 363
loci after the first filter step was equivalent between the two approaches, around 30,000, which was 364
similar to the 37,000 expected loci (based on the genome of the sister species C. sesamiae). This 365
17
suggests that a large proportion of loci are split into different stacks with the de novo approach. Among 366
these 30,000 only a small fraction was polymorphic, suggesting that the two strains are genetically 367
close. The majority of the identified markers were shared between the two approaches, but more than 368
20% (123/566) were specific to one of them, which highlighted their complementarity. The median 369
coverage was above 30, which is satifying for reliable genotype inference. 370
371
3.3 Linkage map 372
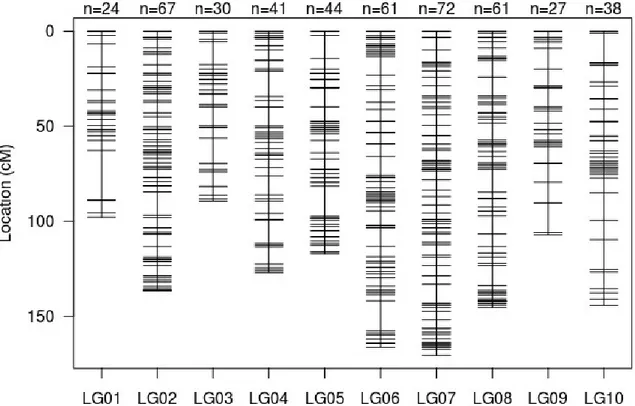
The final linkage map generated from F2 data after removing redundant loci is presented in Figure 2 373
and in supplementary Table S2. It includes ten linkage groups, which is consistent with the number of 374
chromosomes identifed in C. typhae (Christophe Bressac, personal communication), indicating that the 375
map is saturated. In addition, each linkage group matched to one chromosome from C. congregata 376
(Gauthier et al., 2020). The linkage map comprises 465 markers spanning a total length of 1300 cM 377
with an average distance of 2.7 cM between two consecutive markers. 378
379
3.4 QTL mapping for parasitism success and offspring number 380
Three QTLs were identified for parasitism success (PS) and two for offsping number (ON), localized on 381
linkage groups 4 and 6 and on the linkage groups 4 and 5, respectively (Figure 3). No QTL was detected 382
for sex ratio. One peak for parasitism success was not retained (linkage group 1, two QTL scans) 383
because it was observed in the first scan only and was located in a region with low marker density. The 384
QTL observed on the linkage group 5 was common to the two phenotypic traits PS and ON. The length 385
of the QTL confidence intervals varied from 9 to 38 cM (Table 3). For both PS and ON, the pairwise 386
interactions between observed QTLs were not significant. An overdominance effect was observed for 387
18
all ON QTLs, whereas QTL1-PS and QTL3-PS were associated with respectively underdominance and 388
partial dominance of Makindu alleles. The QTL2-PS was strictly additive. The percentage of phenotypic 389
variance explained by each QTL varied between 4 and 14 %. The total phenotypic variance explained 390
reached 27.7 % for parasitism success and 24.5 % for offspring number. 391
392
3.5 Identification of genes within QTL intervals 393
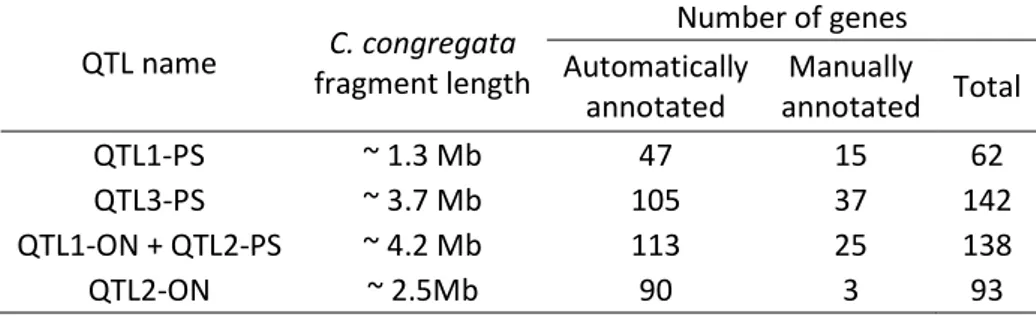
To identify candidate genes, markers in QTL intervals were mapped on the annotated genome of C. 394
congregata. Cumulative length of all QTL intervals represented around 11.7 Mb (Table 4), which 395
corresponds to ~5.9 % of the genome length and comprises 435 genes (Supplementary Table S3) with 396
a putative function. This list of genes was inspected based on literature data. We focused on studies 397
(mainly genomic and transcriptomic studies) that identified genes potentially influencing reproductive 398
success in other parasitoid species. From these studies, 67 genes of interest were identified and are 399
listed in Table 5. Among them we found Bracovirus genes involved in the production of viral particles 400
and other bracovirus genes similar to genes involved in the inactivation of the host immune system in 401
other host parasitoid models (Bézier, Annaheim, et al., 2009; Burke, Walden, Whitfield, Robertson, & 402
Strand, 2014; Chevignon et al., 2015, 2014; Falabella et al., 2007; Gauthier et al., 2020; Pruijssers & 403
Strand, 2007; Thoetkiattikul, Beck, & Strand, 2005). Some genes producing venom components were 404
also identified (Ali, Lim, & Kim, 2015; Arvidson et al., 2019; Burke & Strand, 2014; Colinet, Mathé-405
Hubert, Allemand, Gatti, & Poirié, 2013; Danneels, Rivers, & de Graaf, 2010; Moreau & Asgari, 2015; 406
Sim & Wheeler, 2016). Finally, we reported genes that were highly expressed in ovaries of C. 407
congregata (Gauthier et al., 2020) and N. vitripennis (Sim & Wheeler, 2016) or differentially expressed 408
between resting and ovipositing females of N. vitripennis (Pannebakker, Trivedi, Blaxter, Watt, & 409
Shuker, 2013). 410
19 411
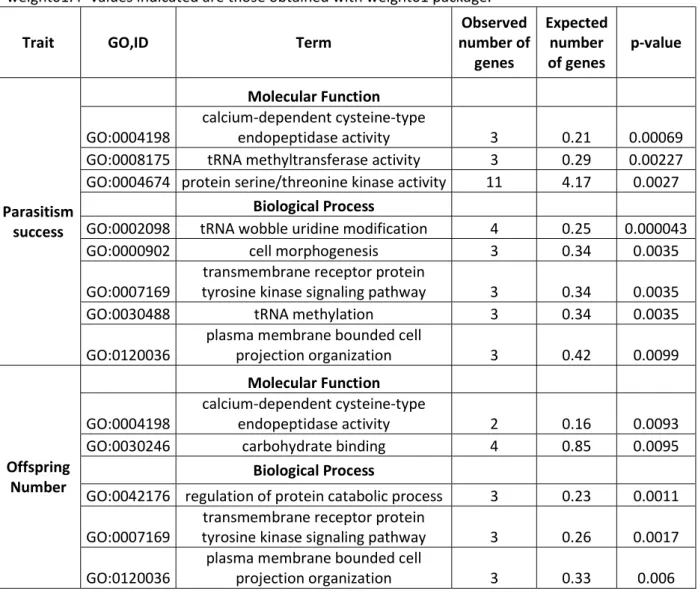
3.6 Gene Ontology enrichment analysis 412
Gene Ontology enrichment results are provided in Table 6. The GO terms were ordered following the 413
results obtained with weight01 algorithm and the GO detected as significantly enriched at the 1% level 414
with the four algorithms are listed. This study revealed an enrichment in GO terms involved in fine 415
regulation processes. The most significant term refers to Calpain function, an intracellular calcium 416
dependent cysteine protease (GO:0004198). This protease family is known to modulate the activity of 417
other proteins, a function required in signal processing (Friedrich & Bozóky, 2005). In Drosophila 418
melanogaster, Vieira, Cardoso, & Araujo (2017) showed that CalpA, a member of the calpain family, 419
was involved in regulating the timing of mitosis during embryonic development. This molecular 420
function may also favor the proper development of C. typhae larvae in its host. Terms involved in tRNA 421
modifications (GO:0008175 and GO:0002098) were also detected as highly significant. Such post-422
transcriptional modifications are well known as modulators of tRNA activity influencing translation 423
speed and fidelity. Repressing tRNA methylation decreased growth rates in yeast Nachtergaele & He 424
(2017). Interestingly, RNA modifications are also widely used by viruses to hijack host cell machinery. 425
426
4 Discussion
427
The QTL approach is used to identify genes differing between lines diverging for one or several 428
phenotypic traits.It is not designed to detect all the genes involved in the phenotype but rather the 429
ones that vary and thus are susceptible to evolve. Applied to fitness related traits, this approach allows 430
us to identify the genetic components involved in an organism’s adaptation. In parasitoids, the QTL 431
study of reproductive success provides an opportunity to identify the key features of host adaptation 432
and hence the genes submitted to the co-evolution processes. Beyond the interest for understanding 433
20
parasitism success and reproduction in parasitoid species, such a study may also be helpful in the 434
selection process in a biological control perspective, for example through marker-assisted selection. 435
The QTL strategy is mainly conducted on model organisms, especially species of agricultural value, to 436
identify genetic components of complex traits and also to support selection processes (Darvasi, 1998; 437
Tanksley, 1993; Xu & Crouch, 2008). It was therefore challenging to develop such an approach on a 438
recently described species. 439
The first challenge was to build a dense and reliable linkage map from scratch. The linkage map 440
obtained comprise 10 linkage groups as the number of chromosomes observed in C. typhae 441
(Christophe Bressac, personal communication) each of them corresponding to one of the 10 442
chromosomes of C. congregata (data not shown, Belle et al., 2002; Gauthier et al., 2020). The length 443
of the genetic map is 1300 cM with an average recombination rate of 7.8 cM/Mb, in line with estimates 444
for other insects (Stapley, Feulner, Johnston, Santure, & Smadja, 2017). The marker density combined 445
with this recombination rate (one marker for each 400 Kbp) is favorable for QTL detection and confirms 446
the interest of using RAD-seq to generate markers. This genetic map will be useful for further studies, 447
for instance for the ongoing assembly of C. typhae genome at the chromosome scale. 448
The second challenge was to detect QTL, to characterize their phenotypic effect and to localize their 449
genomic position as precisely as possible to obtain candidate genes. Owing to the favorable density of 450
the map, the main limitation of QTL detection was the number of progenies to be characterized 451
(Lander & Botstein, 1989). We phenotyped 181 CSS, each of them being characterized for 20 sibling 452
females (more than 4000 parasitisms performed and more than 2600 successful progenies counted). 453
This phenotyping effort allowed us to detect four distinct QTLs even with an impact below 5% of the 454
phenotypic variance. 455
21
No QTL was detected for sex ratio despite a marked broad sense heritability estimated. This negative 456
result probably arises from a complex determinism of sex ratio by numerous genes of low effect. In a 457
comparable study on Nasonia vitripennis, Pannebakker et al. (2011) estimated H² of 9.5% for sex ratio 458
and detected one QTL but explaining only 0.16 % of phenotypic variance and 1.56 % of genetic 459
variance. These authors argued that sex ratio was likely to result from a complex architecture with 460
pleiotropic genes influencing other life history traits such as clutch size. Such trade-off between traits 461
was observed in C. typhae for which progenies from unmated females (with only male offsprings) 462
comprised a significantly higher number of offsprings than progenies from mated females (mixed 463
progenies with males and females, Benoist et al., 2017). This difference may result from ovipositing 464
behavior of the female but also from the higher survival rate of male larvae compared to females. In 465
such case, primary sex ratio (i.e. sex ratio at oviposition) should be a better trait to approach genetic 466
determinism as it is directly imputable to the mother behavior (Ueno & Tanaka, 1997). However, this 467
index is difficult to estimate, particularly for endoparasitoid species. 468
We identified three QTLs for parasitism success and two QTLs for offspring number. Comparison of the 469
phenotypic variation explained by these QTLs with the broad-sense heritability estimated suggests that 470
our approach succeeded in explaining almost all the expected genetic effect. This conclusion should 471
be mitigated by the known bias of QTL detection strategies that result in an overestimate of the QTL 472
effect through selection bias (Broman, 2001). Understanding of the genetic architecture of the host-473
parasite interaction has been approached mainly through the study of host genetic variation. In plant-474
parasite relationships, a gene-for-gene model has been proposed where a single locus is involved in 475
the resistance of the host and a single locus involved in the virulence of the parasite (Thompson & 476
Burdon, 1992). Based on genetic crosses between virulent and avirulent strains of the parasitoid 477
Leptopilina boulardi and tests of parasitism success against different hosts of Drosophila, the same 478
gene-for-gene model was proposed by Dupas et al. (1998) and Dupas and Carton (1999) to explain the 479
22
outcome of the interaction between the two partners. Mochiah, Ngi-Song, Overholt, and Stouthamer 480
(2002) conducted crosses between Cotesia sesamiae strains differing in their ability to parasitize 481
Buseola fusca. They also tested the relative impact of maternal factors and larval ones through 482
superparasitization experiments. They identified a higher number of segregating factors and showed 483
that both maternal factors and larval components (for example surface proteins) were necessary to 484
allow the complete development of the parasitoid and the emergence of adults. Other theoretical 485
models of co-evolution have been proposed that also involve more than one locus with strong epistatic 486
relationship between loci (Tellier & Brown, 2007). The number of loci we identified is consistent with 487
such a model except we did not find evidence of interactions between QTLs. However, the number of 488
QTLs has to be analyzed cautiously as one QTL is not synonymous with one gene but may comprise 489
several genes. The observation of enrichment for some GO terms in the QTL intervals suggests that 490
several genes contribute to the variation in phenotype. 491
Besides the QTL detection, our approach allowed us estimating the additive and dominance effect for 492
each QTL. Strong overdominance effects were observed for offspring number QTLs in agreement with 493
results obtained on hybrid F1 (Benoist et al., 2017). Such effects reveal a positive interaction between 494
alleles, either from a single gene or from different genes in the QTL interval through epistatic 495
interactions or pseudo-superdominance. Under the pseudo-superdominance hypothesis, the 496
overdominance effect is likely due to favorable alleles in the repulsion phase at tightly linked QTLs as 497
observed in maize (Larièpe et al., 2012), suggesting that both Kobodo and Makindu may carry favorable 498
alleles for offspring number. Parasitism success results also reveal the presence of favorable alleles in 499
the Makindu strain, despite its overall poorer performance: negative values were estimated for 500
dominance effect of QTL1-PS and additive effect of QTL3-PS. Taken together, these results indicate 501
that a recombinant strain between Kobodo and Makindu, harboring all favorable alleles, may perform 502
better than the parental strains and could be useful in biocontrol perspective. 503
23
The detection of a QTL shared between parasitism success and offspring number is consistent with the 504
high correlation detected between the two traits. In our experiment, the number of oviposition events 505
was fixed at one. The offspring number thus depends on (i) the number of eggs laid in the host by the 506
female and (ii) the parasitoid larval survival rate. Both larval mortality and parasitism success are 507
directly connected to parasitoid ability to inhibit the host immune system and are therefore naturally 508
correlated. In addition, some authors have even suggested that parasitoid females injecting more eggs 509
enhance the survival rate of their larvae through the saturation of the host immune system (Blumberg 510
& Luck, 1990; Kapranas, Tena, & Luck, 2012; Rosenheim & Hongkham, 1996). It is therefore not 511
surprising that the reproductive success is under the control of at least one common QTL between 512
parasitism success and offspring number. 513
In previous studies we found that the difference in offspring number observed between Kobodo and 514
Makindu females can be explained in part by the number of eggs injected into the host (Benoist et al., 515
2017, 2020). Thus, we expected to find genes related to the oviposition behavior, especially in the QTL 516
specific to offspring number. However, very few genes influencing such behavior are known despite 517
the large number of studies on this topic. This is probably due to the complexity of behavioral traits 518
that involve a huge quantity of genes, complicating their study (Flint, Greenspan, & Kendler, 2010). A 519
refined annotation of genes in the QTL intervals is therefore required to identify candidate genes 520
related to oviposition behavior.
521
Genes belonging to the bracovirus were found in the common QTL and in the QTL3-PS. Within the 522
wasp genome the bracovirus is organized in two types of regions. The first corresponds to genes from 523
a nudiviral origin (nudiviral genes) involved in the bracovirus particle production. Numerous nudiviral 524
genes are clustered in one region, called the nudiviral cluster (Bézier, Annaheim, et al., 2009; Bézier, 525
Herbinière, et al., 2009) encoding in particular major capsid components (VP39, 38K, Wetterwald et 526
al., 2010). The second type corresponds to proviral segments used for the production of the viral circle 527
24
contained in viral particles and harboring virulence genes. In C. congregata, 35 proviral segments 528
organized in 9 proviral loci (PL) were identified. Approximately two-thirds of the proviral segments are 529
localized at the same genomic region, known as macrolocus, and comprising PL1 and PL2, while other 530
are dispersed in the wasp genome (Bézier et al., 2013). The adaptive role of the bracovirus in host 531
range evolution was widely documented in the Cotesia genus. For example, virulence of C. sesamia 532
against Buseola fusca was linked to allelic variation of the CrV1 bracovirus genes (Branca, Le Ru, Vavre, 533
Silvain, & Dupas, 2011; Gitau, Gundersen-Rindal, Pedroni, Mbugi, & Dupas, 2007). Furthermore, 534
several bracovirus genes were shown to be under positive selection in relation with host adaptation, 535
notably in C. sesamiae and C. typhae (Gauthier et al., 2018; Jancek et al., 2013). 536
In the QTL common to both traits we found proviral genes: BV20 genes and genes belonging to EP1-537
like, PTP and Vank families for which some members are known as virulence factors of other parasitoid 538
species (Gueguen, Kalamarz, Ramroop, Uribe, & Govind, 2013; Kwon & Kim, 2008; Pruijssers & Strand, 539
2007). These genes are localized in PL5 and PL8 producing circles 1 and 26 respectively. These two 540
circles are of particular interest. It was shown in the Cotesia congregata-Manduca sexta system that 541
they could integrate into the host genome (Chevignon et al., 2018). They are produced in higher 542
numbers than others (Chevignon et al., 2014) and contain genes highly transcribed in the host. For 543
instance, EP1-like genes and Vank9 are among the most expressed in host haemocytes following 544
parasitism (Chevignon et al., 2014). Genes on these circles are thus good candidates to explain the 545
difference of parasitism success and offspring number between Kobodo and Makindu parasitoid 546
strains. Interestingly, no QTL was detected in the macrolocus region, which concentrates the majority 547
of proviral genes and no virulence genes known to be under positive selection were found in our QTL. 548
Many studies on virulence, with respect to bracovirus, focus on proviral genes but much less on 549
nudiviral genes encoding particle structural components and/or involved in particle production. 550
Interestingly, the QTL3-PS encompasses the whole nudiviral cluster. Among the genes in this QTL some 551
25
have a predicted function based on homology with baculovirus genes: pif3 and pif6 gene products may 552
play a role in virus entry into host cells, whereas VP39 and 38K likely produce major components of 553
nucleocapsids (Bézier, Annaheim, et al., 2009; Herniou, Olszewski, Cory, & O’Reilly, 2003; Wetterwald 554
et al., 2010) containing bracovirus DNA circles. Benoist et al., 2020 observed that the amount of viral 555
particles injected in the host did not explain the difference in parasitism success between Kobodo and 556
Makindu parasitoid strains, which make particle component production unlikely to be involved in the 557
difference between the two strains. The variation of parasitism success induced by this QTL could result 558
from a difference in particle infectivity between the two C. typhae strains, which in turn may result 559
from differences in pif3 and/or pif6 copies. It would be interesting therefore to compare how Kobodo 560
and Makindu bracovirus infect host cells. 561
In all QTLs, except in the QTL3-PS, we found genes associated to venom components, whose role in 562
host adaptation was widely studied (Cavigliasso et al., 2019). In polydnavirus-associated parasitoids, 563
polydnavirus is considered as the main virulence factor. However, it was shown in many species 564
harboring polydnavirus that venom is also required for successful parasitism and could synergize the 565
effect of polydnavirus (Asgari, 2012; Kitano, 1986; Moreau & Asgari, 2015; Tanaka, 1987). The presence 566
of venom genes in the QTLs suggests that their role in virulence might be significant and would 567
therefore make further investigations worthwhile. 568
The goal of this analysis was to identify candidate genes. In total 67 genes of interest were retained, 569
which is rather high for undertaking further studies of their individual implication in phenotypic 570
variation. Complementary approaches, such as comparative transcriptomics or genome wide 571
association study (GWAS) could enable us to select the most interesting candidate genes. Compared 572
to classic QTL approaches, GWAS allow to reach a higher resolution as soon as the sampling effort in 573
mixed or natural populations and the marker density are large enough (Hansson et al., 2018; Santure 574
& Garant, 2018). Focusing on QTL confidence interval, it may help to better target genes of interest. 575
26
Once the number of candidates genes is reduced, we will be able to assess their role using functional 576
analyses available in this model, such as RNA interference; an approach which was shown to work 577
efficiently to knock down targeted gene expression in Hymenoptera (Marco Antonio, Guidugli-578
Lazzarini, do Nascimento, Simões, & Hartfelder, 2008) and more specifically in parasitoid wasps (Burke, 579
Thomas, Eum, & Strand, 2013; Colinet et al., 2014). 580
581
5 Conclusion
582
This work was devoted to the study of genetic components of the reproductive success of a parasitoid 583
species. It pointed out four genomic regions involved in the variations of both parasitism success and 584
offspring number, two traits directly connected to the fitness of individuals. It allowed the 585
identification of a list of genes of interest, notably including bracovirus and venom genes. The 586
detection of those well-known components of parasitoid virulence gives strong support to the strategy 587
presented here. Those genes are particularly interesting in the topic of co-evolution because of their 588
implication in host adaptation. The number of genes pointed out is quite large but clearly limited, their 589
location being restricted by the QTL intervals to well-defined genomic regions. Population studies 590
taking benefit of linkage disequilibrium at small genomic scale, or comparative transcriptomic studies, 591
will allow to approach closer to the candidate genes in the future. 592
593
Acknowledgements
594
We thank Odile Giraudier and Sylvie Nortier for insect rearing at Gif, Julius Obonyo for field collection 595
in Kenya, Matthieu Bodet, Florian Decourcelle, Maxime Villoing and Laurence Signon for their 596
contribution to the crosses and phenotyping, Maud Silvain, Claude Thermes, Delphine Naquin and Yan 597
27
Jaszczyszyn from the I2BC sequencing facility for the RAD-sequencing, Florence Prunier for her 598
methodological advice, Damien Delafoy for his preliminary work on RAD-seq data, Cécile Courret for 599
her help in QTL analysis, Jérémy Gauthier for his advice on sequencing data analysis and his help with 600
the annotated genome of C. congregata, Lionel Saunois, Amandine Dubois and Virginie Héraudet for 601
maize production and Malcolm Eden for linguistic editing of the manuscript. 602
603
Data accessibility
604
RAD-Seq raw data sequences are archived at the NCBI SRA in the BioProject PRJNA622407. Genome 605
database (genomes and annotated genes) are available on the web site BIPAA (Bioinformatic 606
Platform for Agrosystem Arthropods) https://bipaa.genouest.org/is/parwaspdb/. 607
608
Author contributions
609
Conceptualization: R.B., S.D., F.M.; Methodology: R.B., C.C-D., L.M., A.L.R., L.K., F.M.; Software: R.B., 610
C.C-D., F.M.; Validation: R.B, C.C-D., F.M.; Formal analysis: R.B., C.C-D., L.M., A.L.R., F.M.; 611
Investigation: R.B., C.C-D., C.C., R.J., P-A.C., E.V.D., L.K., F.M.; Resources: B.L.R, P-A.C, J-M.D., L.K.; Data 612
curation: R.B, C.C-D., F.M.; Writing - original draft: R.B., F.M.; Writing - review & editing: C.C-D., L.M., 613
A.L.R., P-A.C., E.V.D., S.D., J-M.D., B.L.R, L.K.; Supervision: L.K., F.M.; Project administration: L.K.; 614 Funding acquisition: L.K. 615 616
Funding
617This work was supported by the French National Research Agency (ABC Papogen project ANR-12-618
ADAP-0001 and project Cotebio ANR-17-CE32-0015), and by the authors’ operating grants from IRD, 619
28
CNRS, and icipe. R. Benoist is funded by the Ecole doctorale 227 MNHN-UPMC Sciences de la Nature et 620
de l’Homme: évolution et écologie. The funders had no role in study design, data collection and 621
analysis, decision to publish, or preparation of the manuscript. 622
623
Additional information
624
All experimentations were realized under the juridical frame of a Material Transfer Agreement signed 625
between IRD, icipe and CNRS (CNRS 072057/IRD 302227/00) and the authorization to import Cotesia 626
in France delivered by the DRIAAF of Ile de France (IDF 2017-OI-26-032). 627
628
Supporting information
629
Table S1 Phenotypic data 630
Table S2 Detailed information of linkage map 631
Table S3 QTL gene content 632
29
References
633
Alexa, A., Rahnenfuhrer, J., & Lengauer, T. (2006). Improved scoring of functional groups from
634
gene expression data by decorrelating GO graph structure. Bioinformatics, 22(13),
635
1600–1607. doi: 10.1093/bioinformatics/btl140
636
Ali, M. R., Lim, J., & Kim, Y. (2015). Transcriptome of a specialized extra-embryonic cell,
637
teratocyte, and its host immunosuppressive role revealed by ex vivo RNA interference:
638
Teratocyte transcriptome. Insect Molecular Biology, 24(1), 13–28. doi:
639
10.1111/imb.12132
640
Arvidson, R., Kaiser, M., Lee, S. S., Urenda, J.-P., Dail, C., Mohammed, H., … Adams, M. E.
641
(2019). Parasitoid jewel wasp mounts multipronged neurochemical attack to hijack a
642
host brain. Molecular & Cellular Proteomics, 18(1), 99–114. doi:
643
10.1074/mcp.RA118.000908
644
Asgari, S. (2012). Venoms from endoparasitoids. In Parasitoid Viruses (pp. 217–231). doi:
645
10.1016/B978-0-12-384858-1.00018-7
646
Asgari, S., & Rivers, D. B. (2011). Venom proteins from endoparasitoid wasps and their role in
647
host-parasite interactions. Annual Review of Entomology, 56(1), 313–335. doi:
648
10.1146/annurev-ento-120709-144849
649
Beckage, N. E., & Drezen, J.-M. (Eds.). (2012). Parasitoid viruses: symbionts and pathogens (1st
650
ed). London ; New York: Elsevier/Academic Press.
651
Beckage, N. E., & Gelman, D. B. (2004). Wasp parasitoid disruption of host development:
652
implications for new biologically based strategies for insect control. Annual Review of
653
Entomology, 49, 299–330. doi: 10.1146/annurev.ento.49.061802.123324
30
Belle, E., Beckage, N. E., Rousselet, J., Poirie, M., Lemeunier, F., & Drezen, J.-M. (2002).
655
Visualization of polydnavirus sequences in a parasitoid wasp chromosome. Journal of
656
Virology, 76(11), 5793–5796. doi: 10.1128/JVI.76.11.5793-5796.2002
657
Benoist, R., Chantre, C., Capdevielle-Dulac, C., Bodet, M., Mougel, F., Calatayud, P. A., … Kaiser,
658
L. (2017). Relationship between oviposition, virulence gene expression and parasitism
659
success in Cotesia typhae nov. sp. parasitoid strains. Genetica. doi:
10.1007/s10709-660
017-9987-5
661
Benoist, R., Paquet, S., Decourcelle, F., Guez, J., Jeannette, R., Calatayud, P.-A., … Kaiser, L.
662
(2020). Role of egg-laying behavior, virulence and local adaptation in a parasitoid’s
663
chances of reproducing in a new host. Journal of Insect Physiology, 120, 103987. doi:
664
10.1016/j.jinsphys.2019.103987
665
Bézier, A., Annaheim, M., Herbinière, J., Wetterwald, C., Gyapay, G., Bernard-Samain, S., …
666
Drezen, J.-M. (2009). Polydnaviruses of braconid wasps derive from an ancestral
667
nudivirus.
Science
(New
York,
N.Y.),
323(5916),
926–930.
doi:
668
10.1126/science.1166788
669
Bézier, A., Herbinière, J., Lanzrein, B., & Drezen, J.-M. (2009). Polydnavirus hidden face: the
670
genes producing virus particles of parasitic wasps. Journal of Invertebrate Pathology,
671
101(3), 194–203. doi: 10.1016/j.jip.2009.04.006
672
Bézier, A., Louis, F., Jancek, S., Periquet, G., Theze, J., Gyapay, G., … Drezen, J.-M. (2013).
673
Functional endogenous viral elements in the genome of the parasitoid wasp Cotesia
674
congregata: insights into the evolutionary dynamics of bracoviruses. Philosophical
31
Transactions of the Royal Society B: Biological Sciences, 368(1626), 20130047–
676
20130047. doi: 10.1098/rstb.2013.0047
677
Blumberg, D., & Luck, R. F. (1990). Differences in the rates of superparasitism between two
678
strains of Comperiella bifasciata (Howard) (Hymenoptera: Encyrtidae) parasitizing
679
California red scale (Homoptera: Diaspididae): an adaptation to circumvent
680
encapsulation? Annals of the Entomological Society of America, 83(3), 591–597. doi:
681
10.1093/aesa/83.3.591
682
Boratyn, G. M., Schäffer, A. A., Agarwala, R., Altschul, S. F., Lipman, D. J., & Madden, T. L.
683
(2012). Domain enhanced lookup time accelerated BLAST. Biology Direct, 7(1), 12. doi:
684
10.1186/1745-6150-7-12
685
Branca, A., Le Ru, B. P., Vavre, F., Silvain, J.-F., & Dupas, S. (2011). Intraspecific specialization
686
of the generalist parasitoid Cotesia sesamiae revealed by polyDNAvirus polymorphism
687
and associated with different Wolbachia infection. Molecular Ecology, 20(5), 959–971.
688
doi: 10.1111/j.1365-294X.2010.04977.x
689
Broman, K. W. (2001). Review of statistical methods for QTL mapping in experimental crosses.
690
Lab Animal, 30(7), 44–52.
691
Broman, K. W., & Sen, S. (2009). A guide to QTL mapping with R/qtl. Dordrecht: Springer.
692
Burke, G. R., & Strand, M. R. (2014). Systematic analysis of a wasp parasitism arsenal.
693
Molecular Ecology, 23(4), 890–901. doi: 10.1111/mec.12648
694
Burke, G. R., Thomas, S. A., Eum, J. H., & Strand, M. R. (2013). Mutualistic polydnaviruses share
695
essential replication gene functions with pathogenic ancestors. PLoS Pathogens, 9(5),
696