HAL Id: hal-02366851
https://hal.archives-ouvertes.fr/hal-02366851
Submitted on 17 Nov 2020
HAL is a multi-disciplinary open access
archive for the deposit and dissemination of
sci-entific research documents, whether they are
pub-lished or not. The documents may come from
teaching and research institutions in France or
abroad, or from public or private research centers.
L’archive ouverte pluridisciplinaire HAL, est
destinée au dépôt et à la diffusion de documents
scientifiques de niveau recherche, publiés ou non,
émanant des établissements d’enseignement et de
recherche français ou étrangers, des laboratoires
publics ou privés.
Spatio-temporal population genetic structure, relative to
demographic and ecological characteristics, in the
freshwater snail Biomphalaria pfeifferi in Man, western
Côte d’Ivoire
Yves-Nathan Tian-Bi, Jean-Noël Konan, Abdourahamane Sangaré, Enrique
Ortega-Abboud, Jürg Utzinger, Eliézer N’goran, Philippe Jarne
To cite this version:
Yves-Nathan Tian-Bi, Jean-Noël Konan, Abdourahamane Sangaré, Enrique Ortega-Abboud, Jürg
Utzinger, et al.. Spatio-temporal population genetic structure, relative to demographic and ecological
characteristics, in the freshwater snail Biomphalaria pfeifferi in Man, western Côte d’Ivoire. Genetica,
Springer Verlag, 2019, 147 (1), pp.33-45. �10.1007/s10709-018-0049-4�. �hal-02366851�
1
Tian-Bi et al. GENE-D-17-00317 version September 11 20181
2
Yves-Nathan T. Tian-Bi1,2, Jean-Noël K. Konan3, Abdourahamane Sangaré3, Enrique Ortega-Abboud4, Jurg
3
Utzinger5, Eliézer K. N’Goran2,6, Philippe Jarne4
4
5
Spatio-temporal population genetic structure, relative to demographic and ecological
6
characteristics, in the freshwater snail Biomphalaria pfeifferi, Man, western Côte
7
d’Ivoire
8
9
1 Laboratoire de Génétique, UFR-Biosciences, Université Félix Houphouët-Boigny, 22 BP 1106 Abidjan 22,
10
Côte d’Ivoire
11
2 Centre Suisse de Recherches Scientifiques (CSRS) en Côte d’Ivoire, 01 BP 1303 Abidjan 01, Côte d’Ivoire.
12
3 Centre National de Recherche Agronomique, Adiopodoumé KM 17, route de Dabou, 01 BP 1740 Abidjan 01,
13
Côte d'Ivoire
14
4 Centre d’Ecologie Fonctionnelle et Evolutive, UMR 5175, CNRS - IRD - Université de Montpellier -
15
Université Paul Valéry Montpellier - EPHE, 1919 route de Mende, 34293 Montpellier cedex 5, France
16
5 Swiss Tropical and Public Health Institute, P.O. Box, CH-4002 Basel, Switzerland
17
6 Laboratoire de Zoologie-Biologie Animale,Unité de Recherche et de Formation Parasitologie et Ecologie
18
Parasitaire, UFR Biosciences, Université de Cocody-Abidjan, 22 BP 582 Abidjan 22, Côte d’Ivoire
19
20
Corresponding author Tian-Bi T. Yves-Nathan, tianbyth@yahoo.fr; (+225) 01088960 / 57107394; ORCID
21
0000-0002-0460-9441
22
2
Abstract Combining the analysis of spatial and temporal variation when investigating population structure
1
enhances our capacity for unravelling the biotic and abiotic factors responsible for microevolutionary change. This
2
work aims at measuring the spatial and temporal genetic structure of populations of the freshwater snail
3
Biomphalaria pfeifferi (the intermediate host of the trematode Schistosoma mansoni) in relation to the mating
4
system (self-fertilization), demography, parasite prevalence and some ecological parameters. Snail populations
5
were sampled four times in seven human-water contact sites in the district of Man, western Côte d’Ivoire, and their
6
variability was measured at five microsatellite loci. Limited genetic diversity and high selfing rates were observed
7
in the populations studied. We failed to reveal an effect of demographic and ecological parameters on
within-8
population diversity, perhaps as a result of a too small number of populations. A strong spatial genetic
9
differentiation was detected among populations. The temporal differentiation within populations was high in most
10
populations, though lower than the spatial differentiation. All estimates of effective population size were lower
11
than seven suggesting a strong effect of genetic drift. However, it was compensated by high gene flow. The genetic
12
structure within and among populations reflected that observed in other selfing snail species, relying on high
13
selfing rates, low effective population sizes, environmental stochasticity and high gene flow.
14
Keywords Spatio-temporal structure, demography, parasitic prevalence, gene flow, Biomphalaria pfeifferi
15
16
Electronic supplementary material The online version of this article contains supplementary material, which is
17
available to authorized users.
18
19
20
3
Introduction
1
2
The patterns of genetic variation within and among natural populations depend on several evolutionary forces,
3
including migration, genetic drift and selection (Hartl and Clark 1997; Charlesworth and Charlesworth 2010).
4
Populations of freshwater organisms are generally structured in space and time by marked environmental
5
influences, including for example patchy distribution of habitats and temporal variation in water availability
6
(flooding and droughts). For example, higher gene flow is expected in open (e.g. river) than in closed (e.g. pond)
7
habitats, and genetic drift and extinction should be more common in temporary than in permanent habitats.
8
Empirical studies on population biology and genetics have indeed revealed that the population neutral genetic
9
structure and demographic parameters are affected by habitat characteristics (e.g. Jensen et al. 2005; Lamy et al.
10
2012; Van Leeuwen et al. 2013; Pauls et al. 2014). Focusing on our group of interest here (freshwater snails), less
11
genetic diversity has for example been observed in closed habitats than in open ones, and in temporary than in
12
permanent habitats (Bousset et al. 2004; Escobar et al. 2008). Of course, biological traits also strongly affect
13
genetic structure, especially the mating system. For example, selfing in freshwater snails leads to a loss of diversity
14
and increased differentiation among populations (Jarne 1995; Charbonnel et al. 2002a, b). Another important
15
aspect is parasitism, since parasites act as extrinsic forces that can shape the genetic structure of their host
16
populations. This may result from a direct demographic effect, since some parasites may cause castration and/or
17
death of infected individuals (Ebert et al. 2004; Blair and Webster 2007), but may also proceed from the connection
18
between host genetic variability and susceptibility / adaptation to parasites. Less diverse and/or less heterozygous
19
populations are generally expected to be less resistant to parasites (Hamilton et al. 1990; Lively 2010).
20
These issues are generally tackled in population genetics based on spatial surveys of genetic variation
21
(Charlesworth and Charlesworth 2010; Rowe et al. 2017). However, temporal approaches provide further
22
information that can deepen our understanding of population dynamics, as indicated by both theoretical (Waples
23
1989; Hedgecock 1994; Anderson et al. 2010) and empirical (e.g. Kovach et al. 2010; Howells et al. 2013) studies.
24
They provide a direct access to effective population size (Luikart et al. 2010; Hui and Burt 2015), or even to both
25
the effective population size and migration rate (Wang and Whitlock 2003), allowing to evaluate the relative
26
influence of genetic drift and migration. For example, Palm et al. (2003) showed that differences among brown
27
trout populations, previously thought to be genetically differentiated, could be explained solely by temporal
28
variation within populations. Coupled with demographic analyses, this approach has shown its strengths in
29
freshwater snails, for example to suggest a connection between temporary habitats and drift (Viard et al. 1997;
30
4
Charbonnel et al. 2002). It even indicates that populations of a snail species occupying a network of ponds work1
more as a finite island model than as the expected metapopulation model (Lamy et al. 2012).
2
In such a context, tropical freshwater snails of the Hygrophila group constitute excellent biological models to
3
address the dynamics of population genetic structure in relation to biotic and abiotic factors (Meunier et al. 2001;
4
Charbonnel et al. 2002a, c; Trouvé et al. 2003; Mintsa Nguema et al. 2013). Populations of these snails experience
5
frequent fluctuations in size and dramatic bottlenecks because of seasonal droughts and flooding (Dillon 2000).
6
They have relatively short generation times, from a few weeks to a few months (Brown 1994; Dillon 2000). These
7
hermaphroditic molluscs exhibit either high or low selfing rates (Städler and Jarne 1997; Jarne et al. 2010; Escobar
8
et al. 2011). A consequence of both population demography and selfing is limited neutral variability within
9
populations and fairly large genetic differentiation among populations in selfing species of snails (e.g. Mintsa
10
Nguema et al. 2013). Furthermore, these snails are intermediate hosts for a series of parasitic trematodes, including
11
schistosomes (Brown 1994).
12
The present study focuses on the freshwater snail Biomphalaria pfeifferi (Planorbidae), the intermediate host of
13
the parasitic trematode Schistosoma mansoni (Schistosomatidae), the agent of human intestinal schistosomiasis in
14
Africa, Madagascar and the Middle-East. The population genetics and biology of this species has been studied in
15
a few work (Charbonnel et al. 2002a, b, c, 2005; Campbell et al. 2010; Mintsa Nguema et al. 2013; Kengne-Fokam
16
et al. 2016). However, populations from Côte d’Ivoire have been little investigated. Tian-Bi et al. (2013), studying
17
the spatial variation of phenotypic traits and at microsatellite markers, confirmed that B. pfeifferi is highly selfing,
18
with limited genetic variability within populations and strong population structure. The phenotypic differentiation
19
was not stronger than the neutral molecular differentiation, suggesting that genetic drift plays a strong role in
20
structuring populations. A temporal approach may help deepening our understanding of the population genetics of
21
this species.
22
This work aimed at investigating both the spatial and temporal genetic structure of B. pfeifferi populations in
23
relation to their demography and parasitic prevalence. The study was conducted in the Man region (western Côte
24
d’Ivoire) where human populations are significantly affected by infection by S. mansoni. Our analysis is based on
25
seven populations of B. pfeifferi separated by a few kilometres that have been sampled four times over a year –
26
these sites are those studied by Tian-Bi et al. (2013). The genetic data were analysed in connection with
27
demographic (number of individuals), environmental (e.g. habitat openness) and parasitological (infection by S.
28
mansoni) data based on predictions (detailed in the Methods section) relating them.
29
30
5
1
Material and methods
2
3
Species studied
4
5
Biomphalaria pfeifferi is a freshwater snail distributed over most of Africa, Madagascar and the Middle East
6
(Brown 1994). This highly selfing species (Charbonnel et al. 2005) occupies a variety of water bodies including
7
streams, irrigation channels, ponds and dam lakes (Brown 1994). Populations may experience density variation
8
associated with flooding and drought, leading to bottlenecks and recolonization events (Jarne and Delay 1991;
9
Charbonnel et al. 2002a, b), and to limited neutral variability within populations and strong population structure,
10
even at short geographic distance (Charbonnel et al. 2002a, b, c; Campbell et al. 2010; Mintsa Nguema et al. 2013;
11
Tian-Bi et al. 2013).
12
13
Study sites and s
ampling design
14
15
The study was carried out in the Man region (western Côte d’Ivoire). This mountainous area harbours populations
16
of S. mansoni, the agent of intestinal schistosomiasis (Raso et al. 2005; Assaré et al. 2016). A tropical humid
17
climate prevails in this region, with a rainy season occurring from March to September and a dry season from
18
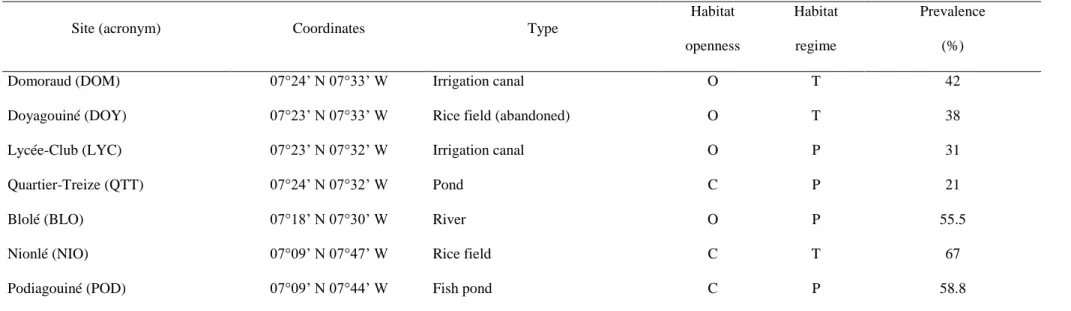
October to February. The snail populations studied were sampled from seven sites. Four are located in the urban
19
district of Man: Domoraud (DOM), Doyagouiné (DOY), Lycée-Club (LYC), Quartier-Treize (QTT), and three are
20
in the rural area: Blolé (BLO), Nionlé (NIO) and Podiagouiné (POD). Their geographic coordinates are reported
21
in Table 1. Distances between site pairs range from a few hundred of meters to 23 km. Sites were classified
22
according to hydrological characteristics as closed or open for habitat openness, and temporary or permanent for
23
habitat regime (see Bousset et al. 2004; Tian-Bi et al. 2013). The prevalence of S. mansoni in humans in the studied
24
sites during the time period of this work ranged between 21% and 67% (Table 1). Snail populations were sampled
25
at four dates. The dry season was sampled at its beginning (October 2004, noted A) and end (January 2005, B),
26
and the rainy season at its beginning (April 2005, C) and middle (June 2005, D). Note that an analysis of spatial
27
genetic structure was reported in Tian-Bi et al. (2013) based on samples from October 2004. During each sampling
28
session, snails were searched and collected over a defined area of each site by the same two persons using a
6
handle sieve for a period of 10 min. Individuals were brought alive to the laboratory and counted. Samples with
1
less than five individuals were discarded from subsequent analyses.
2
3
< Table 1 near here>
4
5
Demography and Schistosoma mansoni prevalence in snail populations
6
7
Demography was analyzed through the number of individuals collected per site and date (N). As sites differed
8
markedly in size, vegetation and water availability, the number of snails collected were compared among samples
9
within sites (i.e. populations), and not among sites. This provided information about the probability of drift and
10
extinction per population (Charbonnel et al. 2002a) which was quantified as the harmonic mean (Nh) and the
11
variance (Var(N)) of N (see Vucetich et al. 1997; Charbonnel et al. 2002a). As the harmonic mean is markedly
12
influenced by low numbers of individuals, low values of Nh reflect high probability of extinction (Wright 1938;
13
Charbonnel et al. 2002a). The harmonic mean is not defined in case of null value in a given sample, and we
14
therefore also ran the analyses by replacing null value (no snail detected) by 1.
15
Snails were brought alive to the laboratory and reared in batches of 20 individuals (at most) in 2 l transparent
16
plastic tanks containing dechlorinated tap water. They were maintained at 23-24° C (water temperature) under a
17
12:12 photoperiod, and fed ad libitum with boiled lettuce. Water was changed at least twice per week. Snails were
18
monitored for parasitic infection by Schistosoma species. To this end, they were observed weekly for the presence
19
of cercariae from day 1 post-sampling until day 45; this allowed detecting infection in snails sampled during the
20
pre-patent period, which is about one month (Pflüger 1976). Snails were checked for cercarial shedding under a
21
binocular microscope after an hour of exposure to artificial light. Indeed, schistosome larvae are generally shed
22
during the day (but see Mouahid et al. 2012), because parasite transmission is insured by human populations. This
23
is likely to be the case in our study area. Schistosomes were identified based on cercariae morphology and
24
displacement (Frandsen and Christensen 1984). Moreover, schistosome egg morphology was used to assess the
25
Schistosoma species to which the shed cercariae belong (see Théron 1986; Mouahid et al. 2012). For this purpose,
26
the schistosome cercariae were collected from naturally infected B. pfeifferi snails and used to infect Swiss white
27
mice. The parasite eggs were then isolated from mice liver and faeces and examined for their morphology under a
28
microscope. The prevalence of S. mansoni (IP) was computed per sample, as the total number of infected snails
29
over the total number of individuals tested (Kirkwood 1988).
7
1
Microsatellite characterization
2
3
DNA was extracted from foot tissues and snails were genotyped at five microsatellite loci (Bpf2, Bpf3, Bpf10,
4
Bpf11 and Bpf12) according to Tian-Bi et al. (2013). Due to logistical constraints, the genetic analyses were
5
conducted on samples of 15-20 snails, randomly chosen from initial samples of more than 15 individuals.
6
7
Statistical analyses
8
9
Within-population genetic diversity, parasitic prevalence and demography
10
11
For each temporal sample of snail populations,allelic frequencies were estimated per locus. These estimates are
12
available in Supplementary Table 1 in Supporting Information. The genetic variation within populations was
13
quantified using several standard parameters including the number of polymorphic locus (Npl), the mean number
14
of alleles per locus (Nall), the mean observed heterozygosity (HO) and gene diversity (HE) (Nei 1987). Genotypic
15
departures from Hardy-Weinberg equilibrium were tested per locus and sample using exact tests, and over all loci
16
using Fisher’s method (Rousset 2015). Genotypic disequilibria were tested for all locus pairs within each sample
17
using G-based statistics. The unbiased estimator
f
of Wright’s inbreeding coefficient FIS was calculated18
according to Weir and Cockerham (1984). The selfing rate was estimated per population using the relationship
s
19
= 2 f
/(1+ f
) (Pollak 1987). All these genetic estimates and associated significance tests were computed using20
GENEPOP Version 4.5.1 (Rousset 2015). In populations that were polymorphic at more than a single locus, the
21
selfing rate (
s
'
) was also estimated using the maximum-likelihood multilocus method implemented in RMES
22
(David et al. 2007).
23
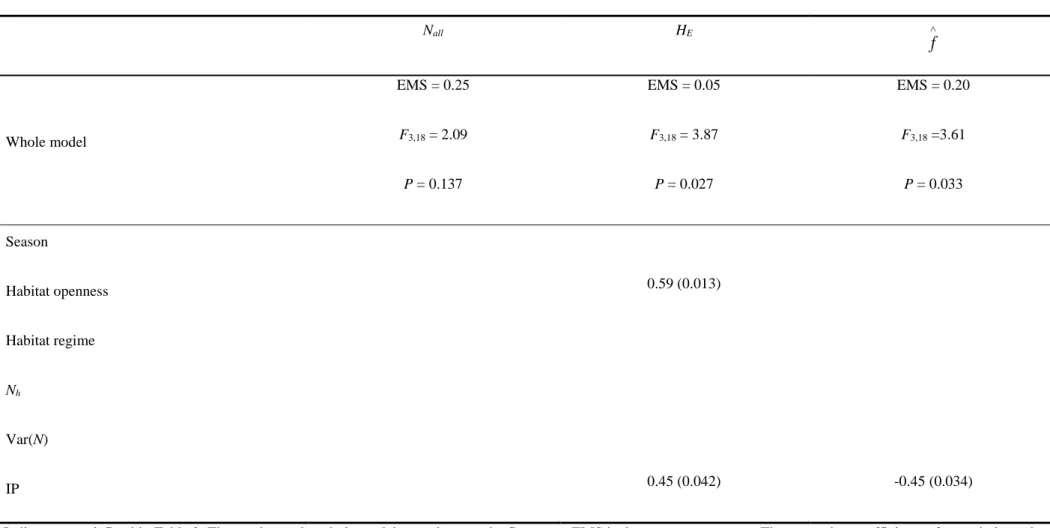
The effects of environmental and demographic stochasticity on genetic diversity (HE; Nall) and selfing rate (through
24
f
) within populations were tested using a multiple regression analysis in which season, habitat openness, habitat25
regime, Nh, Var(N) and S. mansoni infection prevalence (IP) were used as predicting (independent) variables. Then
26
the effect of each independent variable was tested separately using an ascendant stepwise regression. Lower values
27
of HE and Nall, and higher values of selfing rates are expected during the dry season (due to higher probability of
8
drift within populations), in temporary habitats (with higher drift due to regular droughts) and in closed habitats1
(which are more likely to completely dry out) (Charbonnel et al. 2002b; Bousset et al. 2004). A positive correlation
2
was expected between Nh and both HE and Nall. Moreover, a negative correlation was expected between the selfing
3
rate and Nh. Host diversity may be affected by parasites. Indeed, parasites may reduce host population sizes, and
4
therefore their genetic diversity (Lively 2010; Whitehorn et al. 2011), leading here to a negative correlation
5
between IP and diversity (HE and Nall). In addition, traits related to fitness, such as the susceptibility to parasites,
6
may be affected by inbreeding (Charlesworth and Willis 2009), generating a positive correlation between IP and
7
f
and a negative one between IP and HE (Charbonnel et al. 2002a).8
The regression analyses were performed using the software STATISTICA version 7.1 (Stat Soft 2005).
9
10
Genetic differentiation among populations
11
12
The spatial genetic differentiation was analysed estimating the global FST over all loci (Weir and Cockerham 1984),
13
over all populations ( g
) and over all populations sampled at the same date ( g sp
). We also computed the global14
estimator of FST over all populations sampled within the same season ( S
), over all populations according to15
habitat openness ( HO
), over all populations according to habitat regime ( HR
). Estimates of spatial16
differentiation were also computed between population pairs at a given sampling date ( 2sp
). Two additional17
methods were used to assess the spatial differentiation among populations. (i) For each of the three sampling dates
18
A, B and C, isolation by distance was tested using a Mantel-like test on the relationship between genetic distance
19
estimated by FST/(1-FST) and the logarithm of geographic distance (Rousset 2015). This test was not conducted
20
with sample D (June 2005), because only two snail samples were obtained at this date. (ii) Assignment and
21
exclusion methods were applied to identify immigrants and their origin (Cornuet et al. 1999) within populations
22
for the same sampling date. Individuals were excluded when their probability of belonging to a population was
23
below 0.05. Excluded individuals were reassigned to the population for which their probability of belonging is the
24
highest. Reassignment was done only for probabilities higher than 0.10 (Cornuet et al. 1999). The assignment
25
probability was based on Cavalli-Sforza’s chord distance (Cavalli-Sforza and Edwards 1967). A GLM was used
26
to test the effects of season and habitat on exclusion/reassignment rates. More exclusion (i.e. migration) was
27
expected in the rainy season and in open habitats.
28
9
Temporal genetic differentiation ( tp
) was analysed per population by estimating the temporal differentiation1
both over all sampling dates and between two successive samples. The distributions of genetic differentiation
2
between population pairs for a given sampling date ( 2sp
) and temporal genetic differentiation between two3
successive samples for a given population were compared using Wilcoxon test. High temporal differentiation could
4
indicate a substantial decrease of population sizes or extinction followed by immigration or recolonization within
5
the same population over time, resulting in substantial genetic drift (Charbonnel et al. 2002b; Lamy et al. 2012).
6
All estimates of genetic differentiation and their associated P-values were computed using GENEPOP Version
7
4.5.1 (Rousset 2015). Tests of genetic variation conducted with the GENEPOP package were based on Markov
8
chain procedure (parameters: 1 000 000 for dememorisation, 1000 batches and 10 000 iterations per batch).
9
Temporal differentiation was also used to jointly estimate the effective population size (Ne) and migration rate (m)
10
based either on two successive samples, or over all samples for a given population, using the likelihood method of
11
Wang and Whitlock (2003). Samples separated by two to three months were assumed to bridge one generation
12
(see Charbonnel et al. 2002b; Tian-Bi et al. 2008, 2013). The samples of October 2004 (A) were considered as
13
generation zero, and those of January 2005 (B), April 2005 (C) and June 2005 (D) as generation 1, 2, and 3
14
respectively. The method assumes an infinitely large source population providing immigrants to the focal
15
population in which Ne and m are estimated. The maximum Ne was set at 1000 and the source population was
16
constituted from all other samples except that of the focal population. Ne and m, and their 95% confidence intervals,
17
were estimated using the program MLNE Version 1.0 (Wang and Whitlock 2003). The relationships between
18
temporal FST, and both Ne and m were assessed using multiple regressions.
19
Control for multiple testing was performed based on the false discovery rate (FDR) method of Benjamini and
20
Hochberg (1995).
21
Spatial and temporal differentiation were further analysed using the sNMF (Bayesian) approach to population
22
structure developed by Frichot et al. (2014). This method is akin to methods reconstituting population clusters
23
based on ancestry coefficients such as that implemented in STRUCTURE (Pritchard et al. 2000), but is as efficient
24
in terms of inference of cluster number and runs much faster. Importantly, it is not sensible to strong inbreeding,
25
as shown by Frichot et al. (2014) in their analysis of the highly selfing plant Arabidopsis thaliana. The sNMF
26
approach was performed using the R package LEA (Frichot and François 2015) was run using all data with a target
27
number of clusters varying from 1 to 20 and the default regularization parameter of 10. We run further simulations
28
considering the October 2004, January 2005 and April 2005 samples apart, with 1 to 17 clusters (simulations
29
10
stalled at higher value due to the lower amount of individuals). We also ran simulations using InStruct software1
(Gao et al. 2007) which is based on the same approach and got essentially similar results (not shown).
2
3
Results
4
5
Demography, parasitic prevalence and variability within populations
6
7
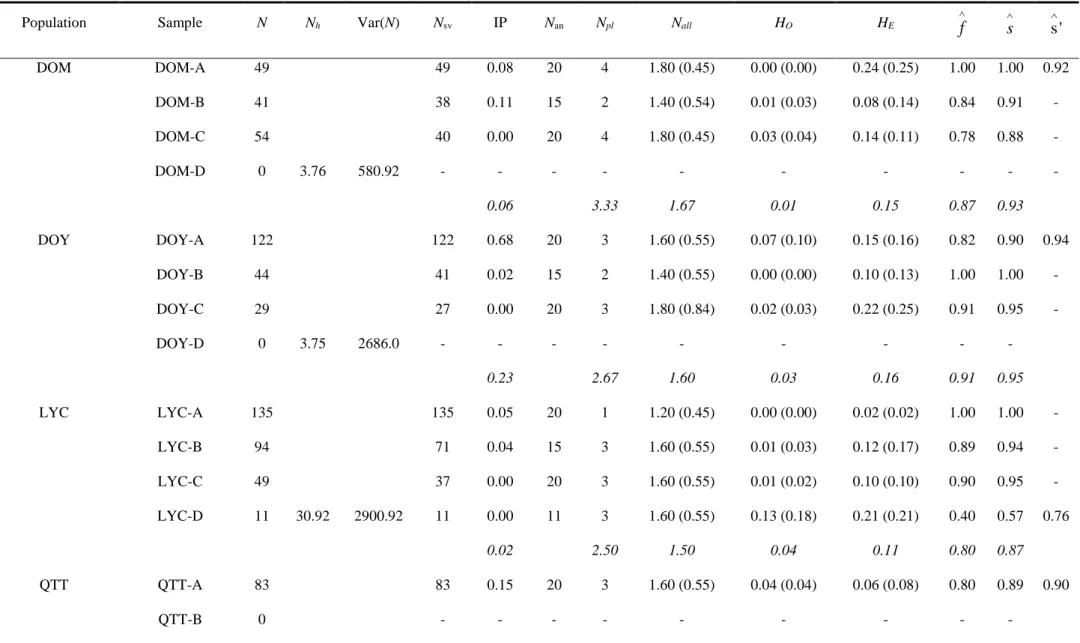
Over the seven studied populations surveyed between October 2004 and June 2005, no snails were found in five
8
cases, one in January 2005 (QTT-B) and four in June 2005 (DOM-D, DOY-D, QTT-D and POD-D). A single
9
individual was collected in NIO-D (June 2005). We thus obtained 22 samples including 1020 snails (mean per
10
sample: 36.43; s.d.: 37.08) for the genetic analyses. In most populations, the highest N was detected during the dry
11
season (Table 2). We observed strong variation in both Nh (harmonic mean of N) and Var(N) (variance of N). Nh
12
varied from 1.97 in QTT to 30.92 in LYC and Var(N) from 126.33 in POD to 2900.92 in LYC.
13
Snails were found infected by schistosomes at least once in six of the seven populations studied. Identification
14
based on egg morphology showed that all the screened eggs exhibit the S. mansoni morphology. The mean
15
prevalence of S. mansoni varied from 0.00 in NIO to 0.23 in DOY. The highest prevalence was observed during
16
the dry season (e.g. 0.68 in DOY-A; Table 2).
17
18
< Table 2 near here>
19
20
The genetic variation within populations was low (Table 2). Considering the loci separately, all snail samples were
21
fixed for one allele at one locus at least and monomorphism was observed in 60 locus-sample situations out of 110
22
(see Online Resource 1). The number of polymorphic loci per sample ranged from 1 to 4, and the mean per
23
population from 1.67 to 3.33 (Table 2). The mean number of alleles per locus (Nall) ranged from 1.20 to 2.20, and
24
the mean per population from 1.40 to 1.67. Gene diversity (HE) per sample varied from 0.02 to 0.24, and its mean
25
value per population from 0.04 to 0.16. No heterozygote was detected in six samples and the highest observed
26
heterozygosity was detected in LYC-D (HO = 0.13; Table 2). Overall, similar values of the standard genetic
27
parameters were detected over time within each of the seven populations studied (chi-square tests lead to P-values
28
> 0.05 within all populations). The test of Hardy-Weinberg equilibrium (HWE) at each locus per snail sample was
29
possible in 50 cases only (due to monomorphism), and significant departures from HWE were detected in 23
30
11
samples after FDR correction (Supplementary Table 1). Multilocus departure from HWE was significant for 141
samples out of 22. Except for two samples (LYC-D and NIO-B), the estimates of FIS (
f
) were all higher than2
0.75. The selfing rate (
s
) derived from
f
thus ranged between 0.57 and 1, with the lower selfing rate observed3
in LYC-D and pure selfing detected in six samples (DOM-A, LYC-A, POD-A, DOY-B, QTT-C and BLO-C). The
4
selfing rate
'
s
based on RMES ranged between 0.76 and 0.98 (Table 2). Tests of genotypic disequilibrium were5
performed within populations for 56 locus pairs only (out of 220 possible pairs), and significant disequilibria were
6
found for Bpf10-Bpf11 and Bpf3-Bpf11 in DOY-A (P = 0.008) and DOY-C (P = 0.001), respectively. This is no
7
more than what is expected by chance at the 5% significance level. After adjustment of p-values following the
8
procedure of Benjamini and Hochberg (1995), none of the demographic and ecological parameters was correlated
9
with those of within-population genetic diversity (Table 3).
10
11
< Table 3 near here>
12
13
Among-population differentiation
14
15
The global estimate ( g
) of FST over all the 22 temporal snail samples was 0.67. The FST estimates over all16
populations sampled at the same date were above 0.60 for the first three dates and equal to 0.46 for sample D.
17
Estimates of differentiation over all populations sampled during the same season ( S
) were 0.69 and 0.65 for the18
dry season and for the rainy season, respectively. FST estimates over all populations from the same type of habitat
19
were 0.66, 0.59, 0.66 and 0.68 for open, closed, temporary and permanent habitats, respectively (Online Resource
20
2). The pairwise FST estimates ( 2sp
) ranged between 0.07 and 0.93 in October 2005, between -0.005 and 0.8121
in January 2005, and between 0.003 and 0.93 in April 2005 as indicated in Online Resource 3 (OR3A, OR3B,
22
OR3C). The sole pairwise FST estimates ( 2sp
) of June 2005 was 0.46. Most estimates were significantly different23
from zero (P < 0.001).
24
No significant isolation by distance was detected for each of the three sampling dates (A, B, C) tested (all P >
25
0.05). Assignment analyses indicated that the probabilities of assigning individuals to the population in which they
26
were sampled was high for each sampling date, though low rates of assignment were observed in April 2005 (Fig.
27
12
1). Individuals of other origin were detected within 20 out of the 22 samples. The percentage of excluded1
individuals ranged between 0 (in DOY-A and NIO-A) to 95% (in QTT-A and QTT-C). Most of the excluded
2
individuals were reassigned to populations geographically close to populations in which they were sampled. The
3
exclusion percentage was affected by habitat openness only, with higher values observed in closed habitats (mean,
4
open habitats = 20.38% / closed habitats = 50.96%, GLM, P = 0.012).
5
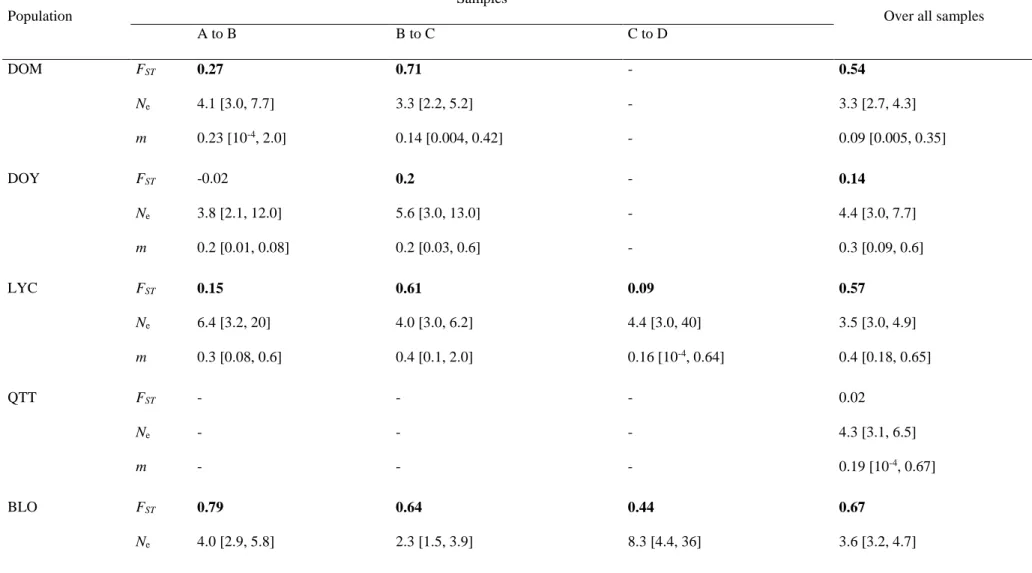
FST estimates over all sampling dates for the same population ranged between -0.02 and 0.67 (Table 4). These
6
estimates differed all from zero (P < 0.001), except for the values in the POD and QTT populations. All values of
7
genetic differentiation between two successive samples for the same population differed significantly from zero
8
(P < 0.001; Table 4), except in the POD population. Estimates between successive samples were also significantly
9
different from 0 in 10 situations out of 14 (Table 4). POD again showed great temporal stability. The mean spatial
10
differentiation was significantly higher than the mean temporal differentiation (Wilcoxon test, z = 2.33, P = 0.020).
11
Estimates of effective population size (Ne) between successive samples were all different from zero, though below
12
7 in all cases, ranging between 2 and 6.4. Likewise, the estimates of migration rate per generation (m) were all
13
significantly different from zero and the values varied from 8.10-5 to 1 (Table 4). Estimates over all samples ranged
14
between 2.5 and 4.4 for Ne, and from 0.0002 to 0.94 for m. Temporal FST was negatively associated with Ne and
15
positively correlated with m (whole model: F3,18 = 16.05; error mean square = 0.02; P < 0.0001).
16
The Bayesian analysis using sNMF returned six groups when considering all populations at once (Online Resource
17
4 and 5). However, the six groups do not correspond to the seven populations. The sample clustering is consistent
18
with the pairwise FST values, and somewhat with the geographical distances; for example, DOY, QTT et LYC are
19
closely related, although this is not fully stable in time, while DOM is rather apart as a mix of different clusters.
20
NIO (late samples) and POD are clustered in a single group. Seven clusters were returned by Instruct (not shown).
21
A comparison with results from sNMF with the same number of clusters indicate that we retrieved similar grouping
22
(e.g., LYC and QTT are related; DOM is apart) with some variation indicative of a labile spatio-temporal genetic
23
structure. A separate sNMF analysis of each sampling time retained four to five clusters (not shown) with again
24
limited stability of clusters in time. This is consistent with the results above with allelic frequency rapidly changing
25
through time.26
27
28
Discussion
29
30
13
The current study addresses the spatial and temporal distribution of neutral molecular variation of Biomphalaria1
pfeifferi populations in connection with demographical, ecological and parasitological parameters. We discuss
2
below successively what the analysis of within- and among population structure brings to our understanding of the
3
functioning of these populations. Given the limited number of individuals and populations considered, our
4
conclusions should of course be considered with caution.
5
6
Demography, parasite prevalence and their influence on within-population genetic diversity
7
8
Our previous study (Tian-Bi et al. 2013) conducted on the first seven samples of B. pfeifferi snails, collected in
9
October 2004 and designated here as sample A, revealed a limited genetic diversity within populations. This
10
pattern was confirmed with the three other samples (B, C and D), with fixation of an allele at least at one locus in
11
the 22 samples and low values of standard genetic parameters (Npl, Nall, HO and HE). This low genetic diversity
12
results in part from the mating system. Our analysis indeed confirms that B. pfeifferi is a preferential selfer, as
13
shown for example by Charbonnel et al. (2005) in populations from Madagascar. Selfing decreases the effective
14
population size, and therefore the within-population variation (Jarne 1995; Ingvarsson 2002). A further process
15
potentially leading to low variation is limited population size. This is often assumed in population genetics studies,
16
but more rarely followed in time based on genetic analyses. We here observed large temporal fluctuation in the
17
number of snails collected per site - the largest values were obtained during the dry season when site size is
18
shrinking and populations contract on limited areas and the smallest in the middle of the rainy season when sites
19
exhibit their largest size and individuals are dispersed by water flows, resulting in a large Var(N) and small Nh in
20
most sites with Nh < 4 in most samples (note though that Nh was driven down by demographic extinction in some
21
samples). This confirms the demographic pattern observed in freshwater snails, both in general (Dillon 2000) and
22
in planorbid snails in Africa and Madagascar, including B. pfeifferi (Loreau and Baluku 1987; Woolhouse 1992;
23
Brown 1994; Charbonnel et al. 2002a). The effective size, as estimated from the method of Wang and Whitlock
24
(2003), was accordingly small. The effective size is indeed strongly influenced by low densities (Wright 1938;
25
Kalinowski and Waples 2002). Our data suggest that at least four of the studied populations went through strong
26
bottlenecks, but were rapidly recolonized. Extinction / colonization processes tend to depress variation within
27
populations (Ingvarsson 2002). This was also shown in populations of vertebrates such as brown trout (Salmo
28
trutta: Salmonidae) (Jensen et al. 2005).
14
All the snails screened were infected with S. mansoni-like parasite (our method does not allow to ascertain species1
status). Such an observation seems consistent with the prevalence of S. mansoni infection in humans in Man, where
2
up to 67% persons suffer from intestinal schistosomiasis. According to OMS (2004), this rate corresponds to a
3
high prevalence of S. mansoni, indicating a strong presence (or pressure) of this parasite in both human and snail
4
hosts in the area and during the time period of this study. At the same time, the values of S. mansoni infection
5
prevalence in snails were very low in this work as previously shown by numerous field studies on schistosome
6
infections (Anderson and May 1979; Hamberger et al. 1998; Sire et al. 1999; Charbonnel et al. 2002a; De Kock et
7
al. 2004). This may be explained by the low probability of an encounter between snails and schistosomes (Mitta
8
et al. 2017). High prevalence of schistosomiasis in final hosts is often observed in conjunction with low infection
9
rates in snails (see e.g., De Kock et al. 2004 in B. pfeifferi), but infection rates in these latter may increase when
10
site size is shrinking at the end of the dry season (Woolhouse and Chandiwana, 1989). Parasites may exert a
11
pressure on host survival, further depressing sizes of host populations (Lively 2010; Whitehorn et al. 2011) and
12
contributing here to lower genetic diversity. This should be investigated in more details.
13
We did not detect an effect of demographic and ecological parameters on within-population diversity as found in
14
other studies (e.g. Lamy et al. 2012). This may be due to the limited number of populations (7) and individuals
(4-15
21) considered here compared with previous studies in B. pfeifferi (Charbonnel et al. 2002a,b; Campbell et al.
16
2010; Mintsa Nguema et al. 2013) where up to 30 populations and above 30 individuals per population were
17
analysed at up to 18 microsatellite markers. The limited number of loci (5) is probably of lower importance.
18
Moreover, at this small spatial scale, similar ecological factors might have played as homogenizing factors among
19
genetically and geographically close populations, as observed in our previous study on the first seven snail samples
20
with no difference among populations for several fecundity traits (Tian-Bi et al. 2013). Although we found no
21
significant effect of environmental parameters on genetic diversity, a trend towards higher mean gene diversity
22
(HE) in open habitats seemed to be observed (see Table 3). This is consistent with previous studies in freshwater
23
snails when contrasting open and closed sites (Charbonnel et al. 2002c; Bousset et al. 2004; Escobar et al. 2008)
24
or more or less connective sites (Lamy et al. 2012). Indeed, migration and colonization should maintain larger
25
effective population size (i.e. more variation) in open habitats Bousset et al. 2004; Escobar et al. 2008).
26
27
Among-population genetic differentiation
28
15
A strong global genetic differentiation (0.67) was observed among all the 22 temporal snail samples. This estimate1
is slightly higher than that obtained (0.58) at a similar scale over 19 populations from the Ihosy region in
2
Madagascar (Charbonnel et al. 2002b). More generally, empirical studies show that the genetic differentiation is
3
extremely high in selfing species, whether in plants (e.g. Porcher et al. 2006) or in animals (Viard et al. 1997;
4
Charbonnel et al. 2002a, b, c). Whatever the spatial partitioning considered (i.e. among populations sampled at the
5
same date, during the same season and from the same habitat type), the global estimates of FST were above 0.59
6
to the exception of sample D (which however included a lower number of samples). This is consistent with the
7
prediction derived from the theory of structured populations / metapopulations (Jarne 1995; Ingvarsson 2002):
8
differentiation should increase with the selfing rate, because of both decreased effective population size and
9
decreased effective migration rate (when migration occurs in the diploid state). This can simply be envisioned
10
under the island model: the equilibrium value of FST is the inverse of 1+4Nm in outcrossing populations (see e.g.
11
Whitlock and McCauley 1999) and therefore of 1+Nm in selfing populations, with N the effective population size
12
and m the migration rate, leading to much higher differentiation. The Nm product can here be derived from the
13
analysis based on Wang and Whitlock’s (2003) method. From Table 4, we can infer that Nm is generally (slightly)
14
greater than one, consistent with FST values higher than 0.5 (assuming an island model). More interestingly,
15
although the FST estimates taken at face value are pretty high, migration is strong enough to maintain a continuous
16
input of genetic variation and to depress the influence of genetic drift due to small size and bottlenecks.
17
Our study indicates that the temporal differentiation within populations can be extremely high, almost as high as
18
the spatial differentiation in five out of seven populations. This is somewhat unexpected: in previous studies
19
conducted in snail species, the temporal differentiation is generally much lower than the spatial differentiation in
20
outcrossing species (ca. an order of magnitude; e.g. Lamy et al. 2012). In selfing species for which such an estimate
21
is available, the temporal / spatial ratio of differentiation was found to be of the order of two (Viard et al. 1997;
22
Charbonnel et al. 2002c). This again pleads for a very dynamical system in which the marked demographical
23
variation that should lead to very limited variation is counter-acted by efficient migration. The estimates of
24
migration rate were indeed pretty high, leading as mentioned above to Nm values above one in general. A note of
25
caution should be introduced here: in the much more detailed and extensive analysis of Lamy et al. (2012)
26
conducted in Lesser Antilles populations of the outcrossing snail Drepanotrema depressissimum, there was no
27
relationship between estimated population size based on genetic markers (microsatellites) and demographic
28
results; demographic extinction can indeed have absolutely no influence on genetic variation. In addition to
29
efficient migration in this system, this is also due to the fact that this species may survive through dry periods,
30
16
apparently hiding in dry mud. The probability of population persistence is indeed higher in sites that dry out than1
in sites that remain wet (Lamy et al. 2013). The aestivation ability of B. pfeifferi has not been evaluated
2
experimentally, but most tropical freshwater pulmonates can aestivate for some time (Brown 1994). If true, this
3
should decrease the temporal estimates of genetic differentiation, contrary to what has been observed here.
4
The negative correlation between temporal FST and Ne is to some extent similar to some results found by Lamy et
5
al. (2012). It suggests the occurrence of bottlenecks between successive temporal samples. This contrasts with the
6
positive correlation between temporal FST and m. Indeed, migration tends to genetically homogenise populations,
7
leading to the reduction of value of FST. In this study, a substantial amount of migration was observed among
8
populations.
9
The results from sNMF analysis of temporal genetic structure of populations are to some extent consistent with
10
those on temporal differentiation (FST), estimates of N and m. These latter also corroborate the results from the
11
assignment method. The proportion of individuals that were re-assigned to their population of origin is rather high,
12
and most of the excluded individuals (77.4%) were reassigned to geographically close populations, a much higher
13
value than in the Malagasy populations of Charbonnel et al. (2002c), but in line with the results of Lamy et al.
14
(2012) in D. depressissimum. This is consistent with the isolation by distance patterns, i.e. the increase of pairwise
15
FST with geographic distance. Note that 22.6% of the excluded individuals were not reassigned to any of the
16
sampled populations, indicating that their population of origin were not sampled. This is not surprising given the
17
limited number of populations sampled, and calls for more extensive sampling in the future. Surprisingly, the
18
percentage of exclusion was higher in closed than in open habitats. This is inconsistent with the prediction of
19
higher immigration expected in open habitat, but not with the possibility that populations of B. pfeifferi might
20
survive very well through dry periods. Another explanation is that most of the closed habitats surveyed are
man-21
made (e.g. POD is a fish pond with and QTT is an irrigation well), which can be filled with water from elsewhere,
22
therefore allowing more immigration than expected for closed sites.
23
The analysis based on the sNMF approach allowed us to consider all samples at once, and produced results which
24
are consistent with the comparison based on pairwise FST. Six clusters were detected, but they do not correspond
25
to populations with some populations associated at one time point and not at another, suggesting significant
26
temporal variation within population. Some populations are however more closely related, and one remains
27
somewhat apart. On the whole, all the results on population genetic structure are consistent with a system working
28
as a metapopulation from a demographical point of view, with frequent extinction and colonization events, as
29
observed in previous work conducted in this species (Charbonnel et al. 2002a; Gow et al. 2007; Campbell et al.
30
17
2010; Mintsa Nguema et al. 2013). However, the spatial and temporal differentiation, even if strong considering1
the spatial scale at which the study was conducted and affected by low effective population size, is maintained
2
below that expected under fixation of alleles in all populations / loci by migration. Another possibility is that
3
individuals are able to aestivate in dried-out sites, maintaining more variation than expected in a metapopulation.
4
This is what has been suggested by Lamy et al. (2012) in another snail species. However, a much more detailed
5
analysis would be required to be more conclusive on whether our study system is a metapopulation or a structured
6
population, including genetic data, long-term demographical survey of populations and ecological follow-up of
7
sites (see Lamy et al. 2012).
8
9
Acknowledgments We thank two reviewers for interesting comments. This work received financial support from
10
the Swiss Development Cooperation (SDC) allocated to the Centre Suisse de Recherches Scientifiques (CSRS)
11
via a project entitled “Contribution to the process of national reconciliation in Côte d’Ivoire” (AVS). We are
12
grateful to the Swiss Tropical and Public Health Institute (Swiss TPH) for having entirely supported the purchase
13
of all the genetic analysis materials. We thank the Centre National de Recherche Agronomique (CNRA) for having
14
allowed snail genotyping in the Laboratoire Central de Biotechnologie (LCB). We are also grateful to Rodolphe
15
Dieugbé from ODAFEM-Man for his assistance during snail sampling.
16
17
Compliance with ethical standards
18
19
Conflict of Interest Author Yves-Nathan T. Tian-Bi declares that he has no conflict of interest. Author Jean-Noël
20
K. Konan declares that he has no conflict of interest. Author Abdourahamane Sangaré declares that he has no
21
conflict of interest. Author Enrique Ortega-Abboud declares that he has no conflict of interest. Author Jurg
22
Utzinger declares that he has no conflict of interest. Author Eliézer K. N’Goran declares that he has no conflict of
23
interest. Author Philippe Jarne declares that he has no conflict of interest.
24
25
26
References
27
28
Anderson CD, Epperson BK, Fortin MJ et al (2010) Considering spatial and temporal scale in landscape‐genetic
29
studies of gene flow. Mol Ecol 19:3565-3575
30
18
Anderson RM, May RM (1979) Prevalence of schistosome infections within molluscan populations: observed1
patterns and theoretical predictions. Parasitology 79:63-94
2
Assaré RK, Tian-Bi Y-NT, Yao PK et al (2016) Sustaining control of Schistosomiasis mansoni in western Côte
3
d’Ivoire: results from a SCORE study, one year after initial praziquantel administration. PLoS Negl Trop Dis
4
10:e0004329
5
Benjamini Y, Hochberg Y (1995) Controlling the false discovery rate: a practical and powerful approach to
6
multiple testing. J R Stat Soc Series B Stat Methodol 57:289-300
7
Blair L, Webster JP (2007) Dose-dependent schistosome-induced mortality and morbidity risk elevates host
8
reproductive effort. J Evol Biol 20:54-61
9
Bousset L, Henry P-Y, Sourrouille P, Jarne P (2004) Population biology of the invasive freshwater snail Physa
10
acuta approached through genetic markers, ecological characterization and demography. Mol Ecol
13:2023-11
2036
12
Brown D (1994) Freshwater snails of Africa and their medical importance, 2nd edn. Taylor and Francis Ltd,
13
London
14
Campbell G, Noble LR, Rollinson D et al (2010) Low genetic diversity in a snail intermediate host (Biomphalaria
15
pfeifferi Krass, 1848) and schistosomiasis transmission in the Senegal River Basin. Mol Ecol, 19:241-256
16
Cavalli-Sforza LL, Edwards AWF (1967) Phylogenetic analysis: models and estimation procedures. Am J Hum
17
Genet 19:233-257
18
Charbonnel N, Angers B, Rasatavonjizay R et al (2002a) Evolutionary aspects of the metapopulation dynamics of
19
Biomphalaria pfeifferi, the intermediate host of Schistosoma mansoni. J Evol Biol 15:248-261
20
Charbonnel N, Angers B, Rasatavonjizay R et al (2002b) The influence of mating system, demography, parasites
21
and colonisation on the population structure of Biomphalaria pfeifferi in Madgascar. Mol Ecol 11:2213-2228
22
Charbonnel N, Quesnoit M, Razatavonjizay R et al (2002c) A spatial and temporal approach to microevolutionary
23
forces affecting population biology in the freshwater snail Biomphalaria pfeifferi. Am Nat 160:741-755
24
Charbonnel N, Rasatavonjizay R, Sellin E et al (2005) The influence of genetic factors and population dynamics
25
on the mating system of the hermaphroditic snail Biomphalaria pfeifferi. Oikos 108:283-296
26
Charlesworth D, Willis JH (2009) The genetics of inbreeding depression. Nat Rev Genet 10:783-796
27
Charlesworth B, Charlesworth D (2010) Elements of evolutionary genetics. Roberts & Co. Greenwood Village,
28
CO
29
19
Cornuet J-M, Piry S, Luikart G et al (1999) New methods employing multilocus genotypes to select or exclude1
populations as origins of individuals. Genetics 153:1989-2000
2
David P, Pujol B, Viard F et al (2007) Reliable selfing rate estimates from imperfect population genetic data. Mol
3
Ecol 16:2474-2487
4
De Kock KN, Wolmarans CT, Bornman M (2004) Distribution and habitats of Biomphalaria pfeifferi, snail
5
intermediate host of Schistosoma mansoni, in South Africa. Water SA, 30:29-36
6
Dillon RT (2000) The Ecology of Freshwater Molluscs. Cambridge University Press
7
Ebert D, Carius HJ, Little T, Decaestecker E (2004) The evolution of virulence when parasites cause host castration
8
and gigantism. Am Nat 164:S19-S32
9
Escobar JS, Nicot A, David P (2008) The difference sources of variation in inbreeding depression, heterosis and
10
outbreeding depression in a metapopulation of Physa acuta. Genetics 180:1593-1608
11
Escobar JS, Auld JR, Correa AC et al (2011) Patterns of mating-system evolution in hermaphroditic animals:
12
Correlations among selfing rate, inbreeding depression and delayed selfing: patterns of mating-system
13
evolution in hermaphroditic animals. Evolution 65:1233-1253
14
Frandsen F, Christensen NØ (1984) An introduction guide to the identification of cercariae from African
15
freshwater snail with special reference to cercariea of trematode species of medical and veterinary importance.
16
Acta Trop 41:181-202
17
Frichot E, François O (2015) LEA: an R package for landscape and ecological association studies. Methods in
18
Ecology and Evolution 6:925-929
19
Frichot E, Mathieu F, Trouillon T, Bouchard G, François O (2014) Fast and efficient estimation of individual
20
ancestry coefficients. Genetics 196:973–983
21
Gao H, Williamson S, Bustamante CD (2007) An MCMC approach for joint inference of population structure and
22
inbreeding rates from multi-locus genotype data. Genetics (online)
23
Gow JL, Noble LR, Rollinson D et al (2007) Contrasting temporal dynamics and spatial patterns of population
24
genetic structure correlate with differences in demography and habitat between two closely related African
25
freshwater snails. Biol J Linn Soc Lond 90:747-760
26
Hamilton WD, Axelrod R, Tanese R (1990) Sexual reproduction as an adaptation to resist parasites (a review).
27
Proc Natl Acad Sci USA 87:3566-3573
28
Hartl DL, Clark AG (1997) Principles of Population Genetics, 3rd edn. Sinauer Associates, Sunderland,
29
Massachusetts
30
20
Hedgecock D (1994) Does variance in reproductive success limit effective population sizes of marine organisms?1
In Beaumont AR (ed) Genetics and the Evolution of Aquatic Organisms. Chapman and Hall, London, pp
122-2
134
3
Howells EJ, Willis BL, Bay LK, Oppen MJ (2013) Spatial and temporal genetic structure of Symbiodinium
4
populations within a common reef‐building coral on the great barrier reef. Mol Ecol 22:3693-3708
5
Hui TYJ, Burt A (2015) Estimating effective population size from temporally spaced samples with a novel,
6
efficient maximum-likelihood algorithm. Genetics 200:285-293
7
Ingvarsson PK (2002) A metapopulation perspective on genetic diversity and differentiation in partially
self-8
fertilizing plants. Evolution 56:2368-2373
9
Jarne P, Delay B (1991) Population genetics of freshwater snails. Trends Ecol Evol 6:383-386
10
Jarne P (1995) Mating system, bottlenecks and genetic polymorphism in hermaphroditic animals. Genet Res
11
65:193-207
12
Jarne P, Pointier J-P, David P, Koene JM (2010) Basommatophoran Gastropods. In Córdoba-Aguilar and JL
13
Leonard (eds A) The Evolution of Primary Sexual Characters in Animals. Oxford University Press, Oxford,
14
pp 173-196
15
Jensen LF, Hansen MM, Carlsson J et al (2005) Spatial and temporal genetic differentiation and effective
16
population size of brown trout (Salmo trutta, L.) in small Danish rivers. Conserv Genet 6:615-621
17
Kalinowski ST, Waples RS (2002) Relationship of effective to census size in fluctuating populations. Conserv
18
Biol 16:129-136
19
Kovach AI, Breton TS, Berlinsky DL et al (2010) Fine-scale spatial and temporal genetic structure of Atlantic cod
20
off the Atlantic coast of the USA. Mar Ecol Prog Ser 410:177-195
21
Kengne-Fokam AC, Nana-Djeunga HC, Djuikwo-Teukeng FF, Njiokou F (2016) Analysis of mating system,
22
fecundity, hatching and survival rates in two Schistosoma mansoni intermediate hosts (Biomphalaria pfeifferi
23
and Biomphalaria camerunensis) in Cameroon. Parasit Vectors 9:10.
https://doi.org/10.1186/s13071-015-24
1285-4
25
Kirkwood BR (1988) Essentials of medical statistics. Blackwell Scientific Publications
26
Lamy T, Pointier J-P, Jarne P, David P (2012) Testing metapopulation dynamics using genetic, demographic and
27
ecological data. Mol Ecol 21:1394-1410
28
Lamy T, Gimenez O, Pointier J-P et al (2013) Metapopulation dynamics of species with cryptic life stages. Am
29
Nat 181:479-491
30
21
Lively CM (2010) A review of Red Queen models for the persistence of obligate sexual reproduction. J Hered1
101:S13-S20
2
Loreau M, Baluku B (1987) Growth and demography of populations of Biomphalaria pfeifferi (Gastropoda,
3
Planorbidae) in the laboratory. J Molluscan Stud 53:171-177
4
Luikart G, Ryman N, Tallmon DA et al (2010) Estimation of census and effective population sizes: the increasing
5
usefulness of DNA-based approaches. Conserv Genet 11:355-373
6
Meunier C, Tirard C, Hurtrez-Boussès S et al (2001) Lack of molluscan host diversity and the transmission of an
7
emerging parasitic disease in Bolivia. Mol Ecol 10:1333-1340
8
Mintsa Nguema RM, Langand J, Galinier R et al (2013) Genetic diversity, fixation and differentiation of the
9
freshwater snail Biomphalaria pfeifferi (Gastropoda, Planorbidae) in arid lands. Genetica 141:171-184
10
Mitta G, Gourbal B, Grunau C, Knight M, Bridger JM, Théron A (2017) The compatibility between Biomphalaria
11
glabrata snails and Schistosoma mansoni: an increasingly complex puzzle. Adv Parasitol 97:111-145
12
Mouahid G, Idris MA, Verneau O, Théron A, Shaban MM, Moné H (2012) A new chronotype of Schistosoma
13
mansoni: adaptive significance. Trop Med Int Health 17:727-732
14
Nei M (1987) Molecular Evolutionary Genetics. Columbia University Press, New York
15
OMS - Organisation Mondiale de la santé (2004) Agir contre les vers. Janvier 2004 numéro 4
16
Pauls SU, Alp M, Bálint M et al (2014) Integrating molecular tools into freshwater ecology: developments and
17
opportunities. Freshw Biol 59:1559-1576
18
Palm S, Dannewitz J, Järvi T et al (2003) Lack of molecular genetic divergence between sea‐ranched and wild sea
19
trout (Salmo trutta). Mol Ecol 12:2057-2071
20
Pflüger W (1976) Ecological studies in Madagascar of Biomphalaria pfeifferi, intermediate host of Schistosoma
21
mansoni. 1. Seasonal variations and epidemiological features in the endemic area of Ambositra. Arch Inst
22
Pasteur Madagascar 45:9-114
23
Pollak E (1987) On the theory of partially inbreeding finite populations. I. Partial selfing. Genetics 117:353-360
24
Porcher E, Giraud T, Lavigne C (2006) Genetic differentiation of neutral markers and quantitative traits in
25
predominantly selfing metapopulations: confronting theory and experiments with Arabidopsis thaliana. Genet
26
Res 87:1-12
27
Pritchard JK, Stephens M, Donnelly P (2000) Inference of population structure using multilocus genotype data.
28
Genetics 155:945-959
29
22
Raso G, Matthys B, N’Goran EK et al (2005) Spatial risk prediction and mapping of Schistosoma mansoni1
infections among schoolchildren living in western Côte d’Ivoire. Parasitology 131:97-108
2
Rousset F (2015) Genepop 4.4 for Windows/Linux/Mac OS X
3
Rowe G, Sweet M, Beebee T (2017) An introduction to molecular ecology, 3rd edn. Oxford University Press
4
Sire C, Durand P, Pointier JP, Théron A (1999) Genetic diversity and recruitment pattern of Schistosoma mansoni
5
in a Biomphalaria glabrata snail population: a field study using random-amplified polymorphic DNA markers.
6
J parasitol 85:436-441
7
Städler T, Jarne P (1997) Population biology, genetic structure, and mating system parameters. In Streit B, Städler
8
T, Lively CM (eds) Ecology and evolution of freshwater organisms. Birkhaüser Verlag, Basel, pp 231-262
9
Stat Soft. (2005) STATISTICA (Data analysis software) 7.1 ed. Paris, France
10
Théron A. (1986) Polymorphisme des œufs de Schistosoma mansoni dans le foyer Guadeloupéen (Antilles
11
Françaises): présence de «S. rodhaini-like» parasites? Acta trop 43:335-342
12
Tian-Bi TY-N, N’Goran KE, N’Guetta S-P et al (2008) Prior selfing and the selfing syndrome in animals: an
13
experimental approach in the freshwater snail Biomphalaria pfeifferi. Genet Res 90:61-72
14
Tian-Bi TY-N, Jarne P, Konan KJ-N et al (2013) Contrasting the distribution of phenotypic and molecular
15
variation in the freshwater snail Biomphalaria pfeifferi, the intermediate host of Schistosoma mansoni. Heredity
16
110:466-474
17
Trouvé S, Degen L, Renaud F, Goudet J (2003) Evolutionary implications of a high selfing rate in the freshwater
18
snail Lymnaea truncatula. Evolution 57:2303-2314.
19
Van Leeuwen CH, Huig N, Van Der Velde G et al (2013) How did this snail get here? Several dispersal vectors
20
inferred for an aquatic invasive species. Freshw Biol 58:88-99
21
Viard F, Justy F, Jarne P (1997) Population dynamics inferred from temporal variation at microsatellite loci in the
22
selfing snail Bulinus truncatus. Genetics 146:973-982
23
Vucetich JA, Waite TA, Nunney L (1997) Fluctuating population size and the ratio of effective to census
24
population size. Evolution 51:2017-2021
25
Wang J, Whitlock MC (2003) Estimating effective population size and migration rates from genetic samples over
26
space and time. Genetics 163:429-446
27
Waples RS (1989) Temporal variation in allele frequencies: testing the right hypothesis. Evolution 43:1236-1251
28
Weir BS, Cockerham CC (1984) Estimating F-statistics for the analysis of population structure. Evolution
29
38:1358-1370