Coupling
of electronic and nuclear motion
in
a negative ion resonance: Experimental
and
theoretical study of benzene
Michael Allan,1,a) Roman ˇCurík,2,b) and Petr ˇCársky2,c) AFFILIATIONS
1Department of Chemistry, University of Fribourg, Chemin du Musée 9, CH-1700 Fribourg, Switzerland 2J. Heyrovský Institute of Physical Chemistry, Academy of Sciences of the Czech Republic, v.v.i, Dolejškova 3,
18223 Prague 8, Czech Republic
a)Electronic mail:[email protected] b)Electronic mail:[email protected]
c)Author to whom correspondence should be addressed:[email protected]
ABSTRACT
We present calculated and measured elastic and vibrational excitation cross sections in benzene with the objective to assess the reliability of the theoretical method and to shed more light on how the electronic motion of the incoming electron is coupled with the nuclear motion of the vibrations. The calculation employed the discrete momentum representation method which involves solving the two-channel Lippmann-Schwinger equation in the momentum space. The electron-molecule interaction was described by the exact static-exchange potential extended by a density-functional theory correlation-polarization interaction that models the molecular response in the field of the incoming electron. Cross sections were calculated for all 20 vibrational modes from near threshold until 20 eV. They were convoluted with a simulated instru-mental profile for comparison with electron energy-loss spectra or appropriately summed for overlapping vibrations for comparison with measured cross sections plotted as a function of electron energy. An electron spectrometer with hemispherical analyzers was employed for the measurements. Good agreement of theory with experiment was obtained for the spectral profiles at 8 eV, and a nearly quantitative agree-ment was obtained at 3 and 4.8 eV. The theoretical results provided new insight into the excitation process, and it showed that more modes are excited than predicted by simple symmetry rules. Spectra showing the details of boomerang structure in the 1.15 eVπ∗resonance were recorded and are presented, although this aspect of experiment cannot be compared with the current theory.
Published under license by AIP Publishing.https://doi.org/10.1063/1.5110677., s
I. INTRODUCTION
A key issue in electron-driven chemistry is how the energy of the incoming electron is coupled to the motion of nuclei of a target molecule. Theoretical treatment of this process is greatly compli-cated by the transient nature of the intermediate negative ion (the resonance), given by the spontaneous loss of the electron. In this work, we evaluate the capacity of an improved version of the Dis-crete Momentum Representation (DMR) method1to excite an ele-mentary type of nuclear motion—the fundamental vibrations. We do this by comparing calculated and measured vibrational excitation cross sections.
The DMR method (i) provides also, apart from the ener-gies and widths of the resonances, the cross sections for excit-ing all vibrational modes without a priori assumptions, (ii) is applicable even to large polyatomic molecules, and (iii) signifi-cantly improves the description of resonances by augmenting the exact static-exchange potential by a density-functional theory (DFT) correlation-polarization interaction. Our earlier work on cyclo-propane1 demonstrated the power of the DMR method to quan-titatively treat the problem and provided a deep insight into the excitation mechanism, without a priori assumptions about eliminat-ing certain partial waves. It is thus more powerful than selection rules and correctly predicted and described even the excitation of
http://doc.rero.ch
Published in "The Journal of Chemical Physics 151(6): 064119, 2019"
which should be cited to refer to this work.
unexpected modes, where the electron leaves in a p partial wave—that is, a wave other than the generally assumed possi-bilities of either the same wave as the incoming electron or an s-wave.2,3
We chose benzene for our study. It is a prototype of a molecule with aπ electron system, and it is also a prototype for vibrational excitation of polyatomic molecules by electron impact because it was on benzene that Wong and Schulz2pointed out the great selec-tivity of the resonant excitation and rationalized this selecselec-tivity by selection rules, assuming that the scattered electron can leave the resonance either in the same partial wave in which it arrived or in an s-wave. Despite its prototype nature, there is not much theoreti-cal work concerning vibrational excitation and only few quantitative experimental cross sections. Primarily, the elastic electron scattering was studied. For a comprehensive bibliography, we refer the reader to the most recent paper4on this topic.
Experimentally, several resonances were found in the energy range below 20 eV by electron transmission spectroscopy (ETS).5–9 The lowest resonance was reported by different laboratories between 1.1 and 1.6 eV (depending on whether adiabatic or vertical attach-ment energy was taken) and was interpreted asπ e2u. Another
reso-nance was observed by electron transmission spectroscopy at about 5 eV and assigned5–7asπ b2g. It was also observed as a weak
shoul-der8,9below 5 eV on the plotted total cross section data. Theπ res-onances were later also observed as peaks in (relative) vibrational excitation cross sections (Fig. 40 of Ref.10and Ref.11). Compila-tion4of electron scattering studies on benzene shows a broad peak observed in the region 7–13 eV.
The positions of the resonances and their assignments were reproduced by rigorous ab initio calculations.4,12,13Gianturco and Lucchese12 computed the π e2u resonance by the
single-center-expansion method at 1.82 eV, theπ b2gresonance at 7.44, and the
e1uresonance at 10.07 eV. Bettega et al.13using the Schwinger
mul-tichannel approach reported theπ e2uresonance at 2.3 eV and the
π b2gresonance at 8.3 eV. Prajapati et al.4used the R-matrix
calcu-lations and reported theπ e2uresonance at 2.66 eV and theπ b2g
resonance at 7.41 eV, obtained from the energy dependence of the total cross sections. The effect of inelastic channels was simulated by an “absorption” potential.
In contrast to elastic scattering, experimental data on vibra-tional excitation of benzene by electron impact are scarce. After the pioneering papers by Schulz and collaborators,2,14 the only vibra-tional electron energy loss spectra (EELS) of benzene we found in the literature were those reported in the reviews by Allan10for residual electron energies of 0.49, 0.75, and 1.10 eV and by Kato and col-laborators15for the incident electron energy of 7.5 eV. We did not find in the literature any true ab initio calculation of vibrationally inelastic scattering by benzene. Still, benzene was the molecule on which symmetry selection rules for vibrational excitation by res-onant electron impact were formulated.2,3 The rules were based on symmetry considerations, namely, on the symmetries of fun-damental modes and of the electronic states of the negative ion. The original selection rules by Wong and Schultz2 were based on symmetry considerations only. Gallup realized3 that the vibration excited by various resonances should be determined by inspection of the symmetry and also of the magnitude of S-matrix elements given in terms of integrals over vibrational functions and electronic states.
Several computational methods have been employed in calcu-lations of the electron-impact vibrational excitation of polyatomic molecules. The complex Kohn variation technique was used by Rescigno et al.16in their CO2study. Dissociative electron attachment
and the vibrational excitation of CH3I were explored with the
single-pole R-matrix method.17 A number of calculations employed a single-center expansion technique for small polyatomic systems with different levels of approximations for the nuclear dynamics. The molecular systems considered by these computational studies were H2O,18H2S,19CH4,20and cyclopropane C3H6.21
The aim of the present work is to calculate the vibrational cross section for all modes quantitatively, in ab initio manner, and to compare them to absolute experimental cross sections. The measurements automatically yielded, as a sideline, details of the boomerang structure in the 1.15 eVπ e2uresonance which we also
present and discuss even though it is not addressed by the DMR method.
II. EXPERIMENT
The measurements were performed with a spectrometer using hemispherical electrostatic energy analyzers which has been described previously22,23and does not require a detailed description here. The technical quality of the data is substantially improved in comparison with the older benzene measurements performed with a magnetically collimated spectrometer.10The experimental condi-tions were the same as in our previous studies on cyclopropane1 and diacetylene.24As in our previous studies, absolute values of the cross sections were determined by the relative flow technique and normalized to a theoretical helium elastic cross section.25The confi-dence limit for the magnitudes of the inelastic cross sections is about ±25% (two standard deviations). As in our previous work, we shall compare experimental and calculated data in two formats: (i) cross sections for a given electron energy loss, plotted as a function of the incident electron energy, which we shall call energy dependence spectra (EDS), and (ii) cross section plotted as a function of electron energy lossΔE for a given incident electron energy.
III. THEORETICAL MODEL AND COMPUTATIONAL DETAILS
The computational method, which we use and which we call DMR (Discrete Momentum Representation), is a two-channel approach in the discrete momentum representation expressed for each vibrational mode by the following two matrix equations:
T10= U10+ U10G0T00+ U11G1T10, (1)
T00= U00+ U00G0T00+ U01G1T10, (2)
where 10 and 00 mean the transitions 1 ← 0 and 0 ← 0, respec-tively. Equations(1)and(2)represent a traditional expression for a two-channel scattering process, coupling in our case the elastic channel (T00) with the vibrational channel for a particular
vibra-tional mode (T10). All integrals for the interaction potential operator
U are calculated rigorously in the ab initio manner. For evaluation of U10and U01matrix elements, the harmonic vibrational functions
were assumed. As in the theory of infrared (IR) spectroscopy, the integration over the vibrational coordinate was approximated by
means of analytical derivatives of U matrix elements with respect to normal coordinates at the equilibrium geometry. Details of the method and the numerically controllable approximations used have been described in our earlier papers.26,27The code used in this work has been technically improved to provide higher numerical stabil-ity at low energies. For clarstabil-ity, we note also here the approximation referring to coupling of the elastic and vibrationally inelastic chan-nels in Eqs.(1)and(2)because it is relevant for the discussion in Secs.IVandV. It stems from our observation that cross sections for elastic scattering evaluated by means of Eq.(2)for different vibra-tional modes differ very little, and this fact permits us to simplify this equation as
T00= U00+ U00G0T00 (3)
and to obtain the T00 matrix by a standard single-channel, often
called fixed-nuclei calculation for elastic scattering. The T00matrix
obtained by means of Eq.(3)is then used in Eq.(1)for all vibra-tional modes. Hence, the two-channel approach is so converted to a pseudosingle-channel approach where the size of all matrices is only N× N instead of 2N × 2N, where N represents the number of plane-wave functions in the electronic basis. Next, by defining matrices A11
and B10as
A11= (1 − U11G1)−1, (4)
B10= U10(1 + G0T00) (5)
for each vibrational mode, we obtain the matrix of amplitudes as
T10= A11B10. (6)
The interaction matrices U00, U10, and U11are of the SEP
(static-exchange plus polarization) type. The SE part is calculated rigorously in an ab initio manner by using the Hartree-Fock density matrix. Its analytical derivatives with respect to coordinates of the target and dipole moment derivatives are obtained from coupled perturbed Hartree-Fock calculations. The short-range correlation potential is approximated by a model based on the DFT (density functional the-ory) as described previously.28The long-range polarization part is determined by the static polarizabilities and their derivatives with respect to the nuclear coordinates. The static polarizabilities used in the present calculations were obtained as linear response functions in DFT calculations with PBE0 functional and Sadlej’s polarized VTZ basis set29as implemented in the program Dalton, Release 2.0 (2005).30
A direct output of scattering calculations is a manifold of calcu-lated vibrational cross sections which can be taken as a theoretical line electron energy loss spectrum. The obtained lines were posi-tioned at values of experimentally determined frequencies.31 We follow the conventional numbering and labeling of the 20 normal modes (10 of which,ν11–ν20, are doubly degenerate) of benzene.31
If not noted otherwise, for direct comparison with the experiment, we assumed a Gaussian shape for each line with a half-width of 15 meV corresponding to the resolution of experimental measure-ments done in this paper. The heights of the peaks are set at the val-ues of calculated differential cross sections. For degenerate modes, the cross sections were calculated for a single component of the normal mode only, and the result was multiplied by a factor of two.
It is important to note that the use of the procedure depicted by Eqs.(1)–(6)does not lead to the known adiabatic approxima-tion32for vibrations as the present theory starts from the coupled two-channel system of Eqs.(1)and(2). Equations(1)and(2) rep-resent a set of two coupled equations in the vibrational degrees of freedom (initial and final states), and thus, it cannot be considered neither the fixed-nuclei nor the adiabatic approximations. Although the later simplification of the theory in Eqs. (3)–(6) leads to the elastic events decoupled from the inelastic collisions(3)and thus resulting in a fixed-nuclei elastic theory, the inelastic T-matrix ele-ments are not obtained by a simple average32over the nuclear states involved.
A limitation of the DMR method in its present form is the use of the harmonic approximation. The consequence of this is that our theoretical model does not account for the excitation of over-tones and combination bands. Nor does it account for phenomena caused by the coupling of electron and nuclear movements in the intermediate resonant state, which cause the boomerang structure in the low-energyπ e2uresonance of benzene. We chose it because
it is currently the only manageable way for treatments of polyatomic molecules. We obtained good results with it for cyclopropane1and diacetylene.24
IV. ELASTIC SCATTERING
We begin our discussion with elastic cross sections because good results for elastic scattering are a prerequisite for successful evaluation of cross sections for vibrationally inelastic scattering in
FIG. 1. Differential elastic cross sec-tion measured (red line) and calculated (black line) at a scattering angle of 90○. The experimental data were normalized to the absolute data of Cho et al.11 (shown as gray circles) at 6 eV. The experimental and the theoretical data are independently on absolute scales. The right panel shows the low energy region in detail.
TABLE I. Differential elastic cross sections measured at 135○by comparison with
helium using the relative flow method.
Energy (eV) 0.2 0.4 0.8 1.0 1.15 2.5 5.0
DCS (Å2/sr) 0.975 1.330 0.986 0.680 0.999 1.014 1.618
our approach. It can be seen from Eqs. (1)and (2) of our two-channel model that the T00amplitudes calculated for elastic
scat-tering are needed for evaluation of the amplitudes of vibrational channels. As expected, our single-channel calculation (shown in the left panel ofFig. 1) almost duplicates the results of the calculations reported by Gianturco and Lucchese12and Bettega et al.13We have not measured the absolute values at 90○and have normalized our elastic excitation function at this angle to the absolute value of Cho et al.11 at 6 eV. Figure 1shows that with this normalization the present excitation function agrees with the values of Cho et al.11also at other energies, confirming the consistency of the shape of the exci-tation function. At 135○, we have measured the absolute elastic val-ues at several electron energies using the relative flow method, with the results listed inTable I, and show them inFig. 2as red, yellow-filled circles. The excitation function, corrected for the instrumental response function as in our earlier work, has been normalized to our absolute value at 1 eV. The good agreement between the yellow circles and the red line inFig. 2even at energies other than 1 eV con-firms the internal consistency of the absolute measurements and the excitation function. There is good agreement between the present absolute values and those of Cho et al.,11except of some discrepancy at 8.5 and 10 eV at 135○.
Figures 1and 2 compare the experimental cross sections to
our calculation. The calculated position of the e2u resonance, at
1.6 eV, agrees very well with the center of the boomerang struc-ture of the experimental band (that is, with the vertical attachment energy) which is around 1.4 eV. This indicates correct treatment of polarization and short-range electron-molecule interactions by our theory.
The experimental curves, in particular the expanded views in the right panels of Figs. 1and 2, show a clear-cut vibrational progression in theπ e2uresonance due to the boomerang
mecha-nism.33Our theoretical model describes the negative ion with fixed
nuclei for elastic scattering and is consequently not amenable to treatment of vibrational motion in the negative ion. A meaning-ful comparison can nonetheless be made, based on the analysis by Chandra and Temkin,34 which they performed on the pro-totype case of vibrational excitation of N2 via theπg resonance.
They compare the results of the fixed nuclei theory, which does not reproduce the boomerang structure, with those of the “hybrid” vibrational-close-coupling theory, which does. They find that the
2π
gresonance appears 0.4 eV wide in the fixed nuclei
approxima-tion, which is about the “electronic” widthΓ of the resonance. This is also about the width of the individual boomerang peaks in the close-coupling theory. The whole envelope of the boomerang struc-ture, which they calculated by the close-coupling theory, is about 1 eV wide, in agreement with the experiment. The fixed nuclei peak is much higher than the boomerang structures such that the areas under the fixed nuclei peak and the boomerang peaks are comparable.
Given the findings of Chandra and Temkin,34we conclude that our calculation reproduces not only the energy of theπ e2uresonance
correctly but also approximately its magnitude if it is taken into account that the height of the narrow peak of the fixed nuclei level of theory is in the experiment distributed over several boomerang peaks.
The experimental cross sections inFigs. 1and2show weak but clear structures around 5 eV due to theπ b2gresonance.
Unexpect-edly, this structure is missing in the theoretical elastic cross sections. This is consistent with earlier theoretical papers12,13that do not show any peak or shoulder in the region from 3 to 8 eV. It will be shown below that despite the fact that the effect of this resonance on the elastic cross section appears to be underestimated by our theory, the theory is capable to describe its role for the vibrationally inelastic cross sections.
Our calculation further yields two distinct resonant peaks around 7 and 11–12 eV, in contrast to earlier theoretical papers12,13 where only one broad peak could be discerned in this energy range. These two resonances are ofσ e1uandσ e2gtype, respectively. Their
determination and their impact on the vibrational excitation of var-ious modes will be discussed below. The experiment yields only one broad peak in the 7–12 eV range at 90○, with a slightly flattened top indicating two unresolved peaks. The reasons for the absence of two distinct peaks could be that (i) the peak calculated at 11 eV is at 10 eV in the experiment and thus cannot be resolved from the 7 eV
FIG. 2. Differential cross section mea-sured (red line) and calculated (black line) at the scattering angle of 135○. Black, gray filled circles show the cross sections of Choet al.11(at 130○). Red,
yellow filled circles are the present abso-lute values at 135○. All data are indepen-dently on absolute scale. The right panel shows the low energy region in detail.
peak or (ii) that the potential curves of the negative ion are strongly repulsive, making the experimental peaks broader, by Franck-Condon factors, than their electronic width alone. These peaks do not have a boomerang structure, the reasons presumably being that (i) their potential surfaces are likely to be repulsive and (ii) their electronic width is much larger than vibrational spacings. At 135○, two peaks are observed both in the experiment and in theory, around 7.5 and 13 eV. In terms of absolute values, good agreement between theory and experiment is found up to about 6 eV, but the calculated cross sections are larger than in experiment above this energy.
In particular, the 13 eV feature is very broad and the question may be raised whether it is appropriate to denote it as a resonance. It is a question of semantics. It is known that every nonrelativis-tic Hamiltonian is fully described by a set of poles in a complex momentum (or energy) plane. These poles are the true resonances of the system35,36[Eqs. (59) and (61) of Ref.36]. The influence of the respective resonances on the cross section seen on the real energy axis depends on the distance of these poles from the real axis, rep-resented by the resonance width. A Breit-Wigner fit to a distant pole’s eigenphase will show a weak increase that is difficult to dis-tinguish from the background formed by the other distant poles. There is no strict criterion to decide from what imaginary value of the pole we shall call it a “resonance” and below which it is just a “background.”
V. VIBRATIONAL EXCITATION: THEORY AND EXPERIMENT
In this section, we compare theory and experiment for vibra-tional excitation. Since the current theory is limited to (i) the har-monic description of the vibrations of the target molecule and con-sequently cannot describe excitation of overtones and (ii) does not describe boomerang motion in the resonance, this section will be limited to excitation of fundamentals and disregard the boomerang structure. Overtone excitation and boomerang structure will be presented in Sec.VI.
There are two important ways to compare theory and experi-ment:
1. Comparison of cross sections for exciting selected specific vibrational modes, plotted as a function of electron energy (EDS). This method of comparison is particularly suitable for discerning the role of resonances, which generally cause enhancement of cross sections, that is, peaks in the spectra. 2. Comparison of energy-loss spectra recorded at given fixed
incident electron energies. The spectra show all vibrational modes (albeit in some cases overlapping) and thus address an important strength of the present theory—the capacity to cal-culate cross sections for all modes. This way of comparison thus reveals the selectivity of excitation with respect to specific modes.
A. Differential cross sections as a function of electron energy
Theory has a decisive advantage over experiment—it provides cross sections for all modes separately, whereas vibrations with
close-lying frequencies can often not be fully resolved in the exper-iment. This power of theory is illustrated inFig. 3, presenting cross sections calculated for all 20 vibrational modes of benzene. It should be noted that all lines inFig. 3are open to uncertainties in the low-energy range around theπ e2uresonance as the theoretical model
used in this paper cannot account for the complicated nature of this resonance. This also applies to the theoretical EDS lines in
Figs. 4and5. For the comparison with theory suitable
superposi-tions of cross secsuperposi-tions of overlapping vibrasuperposi-tions need to be made as described in Secs. V A 1andV A 2. The energy losses of 123 and 380 meV were chosen for comparison. The former contains the ring stretch mode and is thus expected to be sensitive toπ∗ reso-nances, where the temporarily occupied orbital has nodes between carbon atoms, making the potential surface repulsive with respect to the C–C bond lengths. The 380 meV energy loss is dominated by C–H stretches and is expected to be sensitive toσ∗resonances, with the temporarily occupied orbitals having nodes between car-bon and hydrogen atoms and a potential repulsive with respect to the C–H bonds. In this section, we also provide assignment of the symmetries to the resonances computed up to 11 eV of col-lision energies. This assignment is carried out via analysis of the inelastic T-matrix elements as previously done by ˇCurík et al.1 More details will be given in a follow-up publication describing the role of the symmetries in electron-impact vibrational excitation of benzene.
1. Energy loss of 123 meV
Five vibrational modes contribute to the observed signal at the energy loss of∆E = 123 meV: ν2,ν6,ν7,ν14, andν19, with the
ener-gies 123, 125, 123, 129, and 121 meV, respectively. Reference toFig. 3
reveals that these modes include the totally symmetrical ring stretch (ν2) and three C–H bend modes. The left panel ofFig. 4shows the
calculated differential cross sections (DCS) for these five modes. It shows that the dominant contributions to resonant enhancement are due to the ν19 and ν7 modes. EDS plotted for the sum of all
five calculated cross sections is compared with the experimental EDS in the right panel. (Simple sum, rather than the weighted sum, is taken because the frequencies of the five modes are close to each other.)
As in the plot for an elastic cross section, the peak for the first resonance in the calculated curve is narrower and higher than the experiment because of the neglect of vibrational motion in the transient anion. The right panel of Fig. 4 suggests a satisfactory agreement even for the e2uresonance, but it should be taken with
some caution. The theory suggests (left panel ofFig. 4) that the cross section is due primarily to excitation ofν19(e2uC–H bend),
with negligible contribution ofν2(symmetrical ring stretch), and,
as already mentioned, these two modes cannot be resolved in the present experiment on C6H6. They were resolved in the C6D6
spec-trum of Wong and Schulz,2however, because the ring stretch vibra-tion remains nearly unchanged at 117 meV, whereas the C–D bend vibrations all drop to about 100 meV. The C6D6spectrum indicates
a prominent excitation ofν2.
A clear resonant enhancement is calculated at 4.2 eV, rea-sonably close to the experimental value of 4.8 eV. It is some-what surprising that the resonance is calculated at a lower energy than measured because the experimental energy is lowered by
FIG. 3. Energy dependencies of the dif-ferential vibrational cross sections calcu-lated for all 20 vibrational modes of ben-zene at the scattering angle of 90○(black lines) and 135○(green lines).
configuration mixing with an excited configuration,6,13not included in the present calculation. The accuracy of the resonant positions is sensitive to the reliability of the DFT correlation-polarization interaction. It looks as though the DFT correlation tends to be
somewhat too weak on the carbon centers, giving insufficient shift of the e2u resonance, whereas it is probably too strong on the
C–H bonds and thus overshooting the 4.8 eV resonance to lower energies.
FIG. 4. Energy dependence of the differential cross section at the angle of 90○and with the fixed energy loss of 123 meV. Left panel: calculated EDS curves for the five modes
with frequencies in the 123 meV range. Right panel: the black line represents the sum of all five contributions. The red line stands for the observed EDS. The assignment labels in the right panel indicate which modes make major contributions to the respective resonant enhancement. Modeν6is omitted because of its low cross section in the
whole energy range. All curves are independently on absolute scales.
FIG. 5. Energy dependence of the dif-ferential cross section at the angle of 90○and with the fixed energy loss of 380 meV. The left panel presents EDS curves for modesν1,ν5,ν12, andν15
with the frequencies 380, 380, 380, and 378 meV, respectively. The black line in the right panel represents the sum of all four contributions. The red line stands for the observed EDS. All curves are on absolute scale.
The calculated 4.8 eV peak is lower in absolute magnitude than that observed by the experiment, but taking into account that calcu-lation of quantitative cross sections is generally a very difficult task because the cross section is a very steep function of the calculated parameters of the resonance, in particular, its width, the agreement may be classified as very satisfactory. The width of the 4.5 eV peak also appears narrower in the theory (0.5 eV) than in the experiment (0.8 eV). This could be due to the fact that the calculated energy is lower than the measured and resonance widths generally steeply rise with rising energy. It is also likely that the potential curve is repulsive and the experimental width is a combination of the elec-tronic widthΓ and the Franck-Condon width, which will intervene even in cases where there is no boomerang structure. The theoretical curve also reproduces qualitatively correctly the cross section above 6 eV except that the two features calculated at 7.5 and 10.5 eV are not resolved as individual peaks in the experiment but appear as one broad peak peaking at around 9 eV. This could be due to the larger width of the experimental peak which causes them to strongly overlap.
In conclusion, theory agrees well with experiment at energies above about 2 eV. At the 1.15 eV resonance, theory reproduces the total vibrational excitation atΔE = 123 meV satisfactorily but underestimates the excitation of the symmetrical ring stretch vibra-tion ν2, which is revealed by the C6D6 spectrum of Wong and
Schulz.2
2. Energy loss of 380 meV
The energy loss is fixed at 380 meV inFig. 5, and the observed signal is due to the four CH stretching modesν1,ν5,ν12, andν15,
with the energies 380, 380, 380, and 378 meV, respectively. The-ory and experiment agree in that the cross sections for exciting the ΔE = 380 meV vibrations are dominated by very broad features in the 5–15 eV energy range. Theory and experiment also agree reason-ably well on the absolute magnitude of the cross section. Similar to the data inFig. 4, two overlapping peaks appear around 8 and 10 eV in the calculated cross section, but only one peak peaking around 8 eV can be discerned in the experimental spectrum.
As can be seen inFig. 3, theory predicts that the e2uresonance
at 1.15 eV and the b2gresonance at 4.8 eV are absent in the cross
sections exciting these four vibrations at 90○(the 4.8 eV resonance is weakly present in the cross section for exciting ν5 at 135○ but
not at 90○). The weaker (in terms of areas under the peaks) peaks
appearing at these energies in the experimental spectrum in the right panel ofFig. 5are thus likely to be due to the excitation of over-tone vibrations, not accounted for in the theory. The behavior of the cross section for excitingν1in the 2–5 eV range (left panel inFig. 5)
differs from the behavior of the cross section for exciting the other ΔE = 380 meV vibrations, in that it does not continuously drop to zero with decreasing energy below 5 eV but retains a considerable value (around 0.01 Å2/sr) down to 2 eV. This behavior appears to be confirmed by the experiment—the cross section inFig. 5is siz-able in the 2–4 eV range. Explanation of this problem on theoretical grounds needs a detailed analysis of symmetries of resonance. The work along these lines is in progress.
B. Electron energy-loss spectra 1. Incident electron energy of 3 eV
At this energy, we obtained an almost quantitative agreement between theory and experiment, as can be seen inFig. 6. In the case of band overlap,Fig. 6lists only those modes which, according to the calculation, dominate a given observed peak. A weak peak at −50 meV is assigned to the ν201→ 0 anti-Stokes transition, called
a “superelastic peak” in the electron scattering community. Because of the reversibility principle, the height of this peak relative to the
FIG. 6. Electron energy loss spectrum at the incident electron energy of 3 eV and the scattering angle of 135○. The experimental spectrum is plotted in red, and the theoretical spectrum is plotted in black. Both spectra are plotted on absolute scale. Assignment of the observed peaks is assisted by the calculated cross sections (Fig. 3) in cases of ambiguity caused by peak overlap.
inelastic peak is given by the Boltzmann factor for the abundance of the first excited vibrational state at room temperature. Numerically, it is 13%, which corresponds to the ratio of heights of 1→ 0 and 1 ← 0 peaks. As already mentioned above, five modes in the energy range of 121–129 meV form a peak at 123 meV. We designated it inFig. 6
asν19, as according to our calculations its contribution is the largest,
although it is not dominant. The ratio of calculated cross sections is 1:2:3:2:5 in the seriesν2,ν6,ν7,ν14, andν19.
2. Incident electron energy of 4.8 eV
The spectrum for this electron energy, corresponding to the b2g
resonance, was published by Wong and Schulz2for C6D6. This
res-onance was characterized as short-lived, based on the broad peak without the boomerang structure in the electron transmission spec-tra of Nenner and Schulz6 and Burrow et al.7 Accordingly, it is amenable to treatment by our theoretical model. The agreement of theory with experiment is satisfactory shown inFig. 7, although the calculated cross sections for most modes are underestimated. There is some overlap of peak due to vibration modes that are close in fre-quency. Hence, the theory suggests that theν4peak contains
admix-ture ofν8in the ratio 2:1. The strongest peak is predicted to be due
to theν7mode, with the other four modes close in energy being 3–4
times weaker. Wong and Schulz2also assigned the strongest peak in their C6D6spectrum to theν7mode with b2gsymmetry and assigned
the peak at twice this frequency to the 2ν7 transition. Wong and
Schulz2 designated the CD stretching peak asν1(a1g). Our
calcu-lations for C6H6predict that all four CH stretching modes provide
appreciable contributions to the 380 meV peak (in the ratios 5:3:5:6 forν1,ν5,ν12, andν15).
There are five vibrational modes close in energy in the 123 meV region. The two strongest peaks,ν7andν19, are of about the same
intensity. The peak at 241 meV is assigned tentatively to 2ν7.
3. Incident electron energy of 8 eV
Figure 8shows excellent agreement between the observed
spec-trum and the calculated profile of vibrational excitation. The cal-culated elastic cross section is slightly larger than the measured, as already pointed out in Sec.IVand shown inFig. 2.
FIG. 7. Electron energy loss spectrum of C6H6at the incident electron energy of
4.8 eV and the scattering angle of 135○. The experimental spectrum is plotted in red, and the theoretical spectrum is plotted in black. Both spectra are plotted on absolute scale. In the case of overlapping modes, the labels indicate the mode with the largest calculated cross section.
FIG. 8. Electron energy loss spectrum for the incident electron energy of 8 eV and the scattering angle of 135○. The experimental spectrum is plotted in red, and the calculated one is plotted in black. Both spectra are plotted in absolute scale. In the case of overlapping modes, the labels indicate the mode with the largest calculated cross section.
As previously mentioned, in the case of overlapping modes, the labels inFig. 8indicate the mode(s) with the largest calculated cross sections. Theory suggests that the peak labeledν4also contains
con-tribution from theν8mode (in the ratio 2:1) and thatν3andν9are of
about the same calculated intensities. The highest peak is due to five modes,ν2,ν6,ν7,ν14, andν19, with the ratio of their predicted
inten-sities 0.7:1:2:2:3. Theν10peak is overlapped by the 10 times stronger
ν17peak. All four CH stretching modes contribute to the peak at
380 meV. The calculated intensities for theν1,ν5,ν12, andν15modes
are in the ratio 2:1:2:4. In contrast to the spectra recorded for 3 and 4.8 eV, we do not see an overtone at 245 meV and the “superelastic” peak at−51 meV.
VI. BOOMERANG STRUCTURE OF THEπ∗e
2u
RESONANCE AT 1.15 eV AND OVERTONE EXCITATION
While recording the experimental data for this publication, we necessarily obtained information on two phenomena currently not accessible to the present DMR method, and, to our knowledge, no other theory. They are (a) the boomerang structure of the2e2u
low-estπ∗resonance and (b) the excitation of overtone and combination vibrational states. We shall report this experimental information in this section because even a qualitative discussion of these data yields conclusions relevant to this paper and provides experimental information to guide future theoretical work.
The qualitative interpretation of the experimental data will be based on the following rules:
(i) Infrared (IR) active modes may be excited directly by the dipole mechanism. The cross sections due to this mecha-nism peak at threshold and then steeply decrease within a few tenths of an eV. The mechanism may be described the-oretically by the Born approximation. This threshold peak is absent for IR inactive vibrations, that is, for IR inac-tive modes and for transition to overtone and combination vibrational states.
(ii) Cross sections for infrared inactive modes, including over-tone and combination vibrations, are useful for identifying resonances because the background of direct excitation is absent.
(iii) Shorter-lived resonances, i.e., resonances with a large elec-tronic width Γ, excite overtones relatively less than they excite fundamentals because excitation of overtones requires large nuclear relaxation, not possible during the short interaction time of short-lived resonances. (Note that the experimentally observed widths of EDS peaks are com-binations of the electronic widths Γ and the Franck-Condon widths and thus do not provide direct information about Γ.) The relative heights of resonant peaks in the ED spectrum of an overtone, as compared to the spectra of the corresponding fundamental, thus provide qualita-tive information on the relaqualita-tive electronic widthsΓ of the resonances.
(iv) Vibrational modes along which the potential surface of the temporary anion is strongly repulsive at the point of attach-ment are strongly excited.37
A. Boomerang structure within the firstπ∗resonance and the threshold region
The first step is to identify which are the prominent energy losses for which the cross sections should be recorded. For this pur-pose, we recorded an energy-loss spectrum at an incident electron energy corresponding to the vibrational origin of the e2uresonance
and show it inFig. 9. It is analogous to the C6D6spectrum of Wong
and Schulz2except that they measured C6D6at 70○. The peaks are
identified by their apparent (i.e., taken from the spectrum, within ±5 meV) energy loss inFig. 9because several overlapping modes are sometimes responsible for one peak. [The peak labeled “2× 123” contains the first overtones of all modes whose fundamentals are contained in the peak labeled “123,” “123 + 51” contains the com-bination vibrations of any of the modes whose fundamentals are
FIG. 9. Electron energy loss spectrum for the incident electron energy of 1.169 eV recorded at 90○. The numbers above the spectrum indicate the observed energy losses of the peaks, in meV.
contained in the peak labeled “123” combined with one quantum “51” (ν20), etc.]
In the second step, cross sections for selected energy losses were recorded as a function of the incident electron energy, and representative results are shown inFig. 10.
The following comments based on the spectra inFig. 10can be made:
● The electronic width of the e2uresonance, given by the width
of the lowest boomerang peak, is 75± 10 meV.
● The width of the entire progression of the boomerang peak (the Franck-Condon width of the peak) depends on which mode is excited. It is widest for excitingν16 and
narrow-est for exciting theΔE = 123 meV group of modes. We
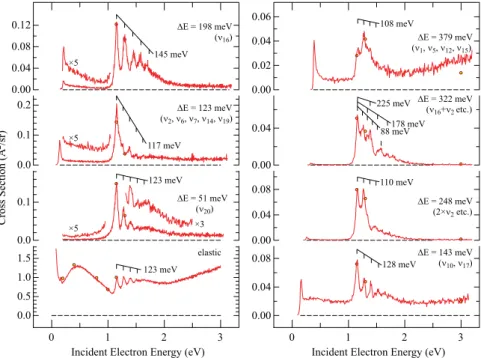
FIG. 10. Vibrational excitation cross sec-tions recorded at 135○ for the fixed energy losses corresponding to the fun-damental frequencies of the normal modes and for the overtone and com-bination bands as indicated. Boomerang progressions are indicated by grids above the spectra, with indication of the observed spacings.
interpret these widths as the Franck-Condon widths of the attachment peak, that is, as reflecting the slope of (the real part of) the resonant potential hypersurface at the point of attachment—a steep potential hypersurface at the point of attachment leads to a wide peak.
● The spacings of the boomerang peaks also depend on the mode excited. They are 123 meV for the elastic cross section and theν20excitation but attain other values (though all in
the same ballpark) for exciting the other energy losses. ● The bands for exciting fundamental frequencies are
dom-inated by single progressions. The bands for exciting the overtone (ΔE = 248 meV) and combination (ΔE = 322 meV) vibrational states have more complex shapes, defying simple assignment to progressions. Thus starts with two peaks 110 meV apart, of equal height, followed by an abrupt drop of cross section, not fitting any expected Franck-Condon pro-file. The band withΔE = 322 meV is also complex. Two pro-gressions, 88 and 178 meV, can be discerned. A peak is found at 225 meV and another is found at 410 meV, both with-out discernible progressions, the latter being higher than any possible vibration.
● Threshold peaks are observed which are largely compati-ble with an assignment to Born-type direct dipole excita-tion. The vibrationsν6,ν14, andν19in theΔE = 123 meV
group are IR active, explaining the threshold peak in the ΔE = 123 meV cross section. ν10is IR active, albeit weak, in
theΔE = 143 meV group. ν5is IR active (very weak) andν12
is IR active (strong), in theΔE = 379 meV group, explain-ing the large threshold peak (note thatν12 is split to two
peaks at 376 and 382 meV due to a Fermi resonance withν13
+ν16, but both components contribute to theΔE = 379 meV
group with our resolution).ν16 is IR inactive, and there
is only a small threshold peak, which could be due to a small transition dipole due to anharmonicity. (ν20 is also
strongly IR active, but our spectrum in Fig. 10does not extend to sufficiently low energy to show the threshold peak.) The overtone and combination vibrations yield only very small threshold peaks, which also could be due to a small transition dipole due to anharmonicity.
● The cross sections in the range from just above the Born peak to just below the e2uresonance (about 0.5–1.0 eV) are
peculiar. They are much smaller than those caused by the (very strong) e2uresonance but still quite substantial (they
are high above the instrumental background). These cross sections cannot be assigned to the Born mechanism—they descend far too slowly (in the case ofν16) or are even
con-stant (in the case of the peak withΔE = 123 meV, with several unresolved vibrations). The excitation is selective— it is weak in theν20cross section and much stronger in the
C–H stretch excitation. The cross sections in this energy range are nearly zero for the overtone and combination vibration excitations,ΔE = 248 and 322 meV. The mecha-nism of this excitation is uncertain. It could be due to the low-energy tail of theπ∗e2uresonance.
A final interesting question is what vibrational modes are excited following an attachment of an electron not to the v = 0 level of the resonance, like inFig. 9, but to a higher level.Figure 11
FIG. 11. Electron energy loss spectra for the incident electron energies of 1.15 and 1.3 eV recorded at the scattering angle of 135○.
addresses this question by comparing energy-loss spectra obtained at Ei= 1.15 eV and 1.3 eV (this time at 135○). The experimental answer is that a much higher density of overtone and combination vibra-tions is excited, in particular, at higher energy losses. It is important to note that this gradual loss of selectivity does not interfere with the postulation of the selectivity rules by Wong and Schulz2—those rules were expressly postulated to apply only for electron attachment to the v = 0 level of the resonance, with a totally symmetrical vibra-tional wave function in the transient anion.Figure 11shows that the question of “selection rules” is closely linked, at least for resonances with the boomerang structure, to the incident electron energy and the symmetry of the intermediate (boomerang) wave function of the nuclei.
The qualitative picture to rationalize these observations is based on the calculation of Chourou and Orel,38who calculated the motion of a nuclear wavepacket, in three dimensions, on an ab initio com-plex potential hypersurface, to obtain a quantitative dissociative electron attachment cross section in acetylene. In our case, the nuclear wavepacket does not reach the dissociation point but decays by autodetachment into a vibrationally excited state of the target molecule. In the benzene case, the situation is fundamentally sim-ilar but more complex because of the many dimensions involved and because of the Jahn-Teller effect. The Jahn-Teller active modes are along the e2gcoordinate which should let it descent to the D2h
point group, but vibronic coupling withσ∗states further changes the shape of the resonant potential surface, leading to a C2v(Ref.39)
or even C2(Ref.40) ground state of the benzene anion. The
pro-cess of nuclear wavepacket relaxation appears to be accompanied by intramolecular vibrational redistribution (IVR) whereby the initially vibrationally selective electron attachment at higher energies within the resonance is converted to vibrational states with many overtones and combinations excited.
B. Overtone excitation at higher energies
Wide energy range spectra of the excitation of the ΔE = 123 meV and the ΔE = 380 meV groups of fundamental vibra-tions and of their first overtones atΔE = 245 meV and ΔE = 745 meV are shown inFig. 12. The value of 745 meV is less than twice the fun-damental frequency of 380 meV because of anharmonicity and was
FIG. 12. Energy dependence spectra recorded at the scattering angle 90○for fixed
energy losses corresponding to frequencies of normal modes at 123 and 380 meV and their first overtones.
determined from an energy-loss spectrum recorded at a constant residual energy of 8 eV, where a progression of peaks at 380, 745, and 1095 meV appears. We do not know to which of the overlap-ping modesν1,ν5,ν12, andν15does the energy loss peak of 745 meV
belong.
The following comments based on the spectra inFig. 12can be made:
● The height of the peak at 4.8 eV, relative to the e2upeak
at 1.15 eV, decreases when going from theΔE = 123 meV spectrum to theΔE = 245 meV spectrum. This is in line with a shorter lifetime of the b2g resonance as compared
to the e2u resonance. This is also in line with the absence
of the boomerang structure in this peak, although note that the absence of the boomerang structure can also be a consequence of a repulsive potential hypersurface.
● Similarly, the height of the very broad peak at 8–9 eV, rela-tive to both the e2upeak at 1.15 eV and the b2gpeak at 4.8 eV,
decreases when going from fundamentals to overtones, indicating very short lifetime (largeΓ) of the σ∗resonances. Note that the width of the peak in the spectrum cannot be taken as the electronic widthΓ because it is likely to be caused in part by the Franck-Condon width associated with strongly repulsive hypersurfaces.
Interestingly, there is a nonzero cross section in the 2–4 eV energy range, both in theΔE = 123 meV and ΔE = 380 meV spectra, although this range is nominally between the e2uand the b2gπ∗
res-onances. This signal disappears for the overtoneΔE = 245 meV but persists in theΔE = 745 meV overtone excitation, proving its reso-nant origin. Note that this weak cross section is reproduced by our calculation, as shown for the modeν7inFig. 3. We assign it to a very
broad e1uresonance.
VII. SUMMARY AND CONCLUSIONS
In this paper, we tested the capacity of the Discrete Momentum Representation (DMR) method to describe resonances in electron-molecule scattering and, in particular, whether it correctly describes the coupling between the electron and nuclear motion, in the sense whether it correctly describes which normal modes are excited by which resonances and with what cross sections. In a broader sense, this coupling is essential for the description of electron-driven chemistry in the gas phase.
Limited resolution of the experiment does not permit measure-ments of cross sections for all vibrational modes individually, but experimental spectra were compared with theoretical profiles show-ing appropriate sums of cross sections for overlappshow-ing vibrations. Both the shapes and the heights of the profiles were compared since both the theory and the experiment yielded absolute values of the cross sections.
The DMR theory succeeds best for electron energies corre-sponding to resonances without narrow boomerang structure. Thus, we obtain a nearly quantitative agreement between the calculated and measured spectral profiles of energy-losses at the incident elec-tron energy of 3 eV, both in terms of shape and of absolute magni-tude. Satisfactory agreement was obtained also at 4.8 and 8 eV. Peaks in plots of cross sections are plotted as a function of energy reveal resonances. The DMR theory correctly reproduced the energies of theπ∗resonances. The DMR theory does not treat nuclear motion of the temporary anion and thus does not reproduce the experi-mentally observed boomerang vibrational structure of the firstπ∗ resonance and calculates it as a single peak. Although the theory cal-culated the resonance at the correct energy and with a qualitatively correct area under the peak in the elastic scattering, our calcula-tions are not compatible with the strong excitation ofν2reported
by Wong and Schulz,2and thus, the mechanism ofν2excitation by
the firstπ e2uresonance in benzene remains an unresolved
prob-lem. The DMR theory qualitatively correctly reproduced the ener-gies of theσ∗resonances—the broad peaks in the 5–15 eV region. The calculated resonances appear to be somewhat narrower than the experiment and appear as separate peaks, whereas the experiment shows only one very broad peak. The symmetry of the lowerσ∗ res-onance at 7.5 eV was determined as e1uin agreement with the work
of Gianturco and Lucchese12who computed it at 10.07 eV. The sym-metry of the otherσ∗resonance at 10.5 eV was identified as e2g. We
notice that resonances can be discerned much more clearly in plots of vibrational excitation cross sections than in plots of elastic cross sections. This means that the DMR theory, providing vibrational excitation cross sections, is more powerful in identifying shape res-onances than theories calculating elastic cross sections alone. Of key importance is the applicability of the DMR theory even to large poly-atomic molecules, including molecules of practical importance. As
an example, work is in progress on the molecule Fe(CO)5, relevant
for nanolithography.
Our experimental spectra inFigs. 7and9are fully compatible (isotopic shifts of vibrational frequencies taken into account) with the C6D6energy loss spectra at 1.15 and 4.8 eV of Wong and Schulz.2
Our work shows, however, that the selection rules which they pro-pose and which were later treated in more depth3 are essentially correct as the first approximation but that the situation is more com-plex at a closer look, in particular, that more modes are excited than predicted by the selection rules by Wong and Schulz.2We pointed this out already in our earlier work on cyclopropane,1where vibra-tional modes were excited requiring that an electron arriving in an f-wave departs in a p-f-wave, thus extending the postulate of Wong and Schulz that the electron can depart either in the same partial wave in which it arrived or in an s-wave. Note that Wong and Schulz were cautious in their formulation of the selection rules in the sense that they apply only when the vibrational wave function of the transient anion is totally symmetric, that is, v = 0, reached with an incident electron energy of 1.15 eV. Their selection rules were thus expressly not intended to cover higher incident energies, like in the top panel
ofFig. 11. Note also that our results at 4.8 eV show a less dramatic
selection of modes than assumed by Wong and Schulz. Our calcula-tions suggest that the 4.8 eV resonance does not excite just a single CH stretching mode (a1g ν1) and also not just a single CH bend
(b2gν7).
Our work shows that the selection rules of Wong and Schulz, while valuable for qualitative assessment, oversimplify the excitation process and cannot replace a quantitative calculation like the present one.
We complemented the above work with experimental results on boomerang structure in the firstπ∗ resonance and on excita-tion of overtones. The cross secexcita-tions for overtone excitaexcita-tion point out that the intensity of the thirdπ∗ resonance at 4.8 eV, relative to the first and second resonance (degenerate at 1.15 eV), decreases in the overtone spectrum, reflecting its larger width. Similarly, the very broadσ∗peak in the 8–10 eV range decreases faster than allπ∗ resonances, indicating an even larger widthΓ.
The boomerang structure within the 1.15 eV resonance is dom-inated by spacings of around 123 meV which vary as a function of which vibrational mode is being excited. The width and shape of the boomerang profile, that is, the number and relative intensity of the boomerang overtones, vary dramatically in dependence for which the final mode is the cross section recorded. Increasing the incident energy within the boomerang profile, for example, from 1.15 eV to 1.3 eV, dramatically increases the number of overtones and density of states excited after the departure of the electron. These results point out complex nuclear dynamics on the resonant potential sur-face, which is further complicated by Jahn-Teller distortion, and indicate extensive intramolecular vibrational redistribution (IVR) when vibrational energy is available in the transient benzene anion. ACKNOWLEDGMENTS
R. ˇC. and P. ˇC. wish to thank the Grant Agency of the Czech Republic (Grant No. 18-02098S) for support of this work. M.A. acknowledges support from the Swiss National Science Foundation (Project No. 200020-144367/1).
REFERENCES
1R. ˇCurík, P. ˇCársky, and M. Allan,J. Chem. Phys.142, 144312 (2015). 2S. F. Wong and G. J. Schulz,Phys. Rev. Lett.35, 1429 (1975). 3G. A. Gallup,J. Chem. Phys.99, 827 (1993).
4D. Prajapati, H. Yadav, P. C. Vinodkumar, C. Limbachiya, A. Dora, and M. Vinodkumar,Eur. Phys. J. D72, 210 (2018).
5L. Sanche and G. J. Schulz,J. Chem. Phys.58, 479 (1973). 6
I. Nenner and G. J. Schulz,J. Chem. Phys.62, 1747 (1975).
7P. D. Burrow, J. A. Michejda, and K. D. Jordan,J. Chem. Phys.86, 9 (1987). 8
P. Mo´zejko, G. Kasperski, C. Szmytkowski, G. P. Karwasz, R. S. Brusa, and A. Zecca,Chem. Phys. Lett.257, 309 (1996).
9
C. Makochekanwa, O. Sueoka, and M. Kimura, Phys. Rev. A 68 , 032707 (2003).
10M. Allan,J. Electron Spectrosc. Relat. Phenom.48, 219 (1989).
11H. Cho, R. J. Gulley, K. Sunohara, M. Kitajima, L. J. Uhlmann, H. Tanaka, and S. J. Buckman,J. Phys. B: At., Mol. Opt. Phys.34, 1019 (2001).
12F. A. Gianturco and R. R. Lucchese,J. Chem. Phys.108, 6144 (1998). 13M. H. F. Bettega, C. Winstead, and V. McKoy,J. Chem. Phys. 112, 8806 (2000).
14R. Azria and G. J. Schulz,J. Chem. Phys.62, 573 (1975).
15H. Kato, M. Hoshino, H. Kawahara, C. Makochekanwa, S. J. Buckman, M. J. Brunger, H. Cho, M. Kimura, D. Kato, H. A. Sakaue, I. Murakami, T. Kato, and H. Tanaka, National Institute for Fusion Science, NIFS-DATA-105, 2009. 16T. N. Rescigno, W. A. Isaacs, A. E. Orel, H.-D. Meyer, and C. W. McCurdy,
Phys. Rev. A65, 032716 (2002).
17A. Schramm, I. I. Fabrikant, J. M. Weber, E. Leber, M.-W. Ruf, and H. Hotop,
J. Phys. B: At., Mol. Opt. Phys.32, 2153 (1999).
18T. Nishimura and Y. Itikawa, J. Phys. B: At., Mol. Opt. Phys. 28, 1995 (1995).
19A. Jain and D. G. Thompson,J. Phys. B17, 443 (1983).
20S. C. Althorpe, F. A. Gianturco, and N. Sanna,J. Phys. B: At., Mol. Opt. Phys. 28, 4165 (1995).
21R. ˇCurík and F. A. Gianturco, J. Phys. B: At., Mol. Opt. Phys.35, 1235 (2002).
22M. Allan,J. Phys. B: At., Mol. Opt. Phys.40, 3531 (2007). 23M. Allan,Phys. Rev. A81, 042706 (2010).
24R. ˇCurík, I. Paidarová, M. Allan, and P. ˇCársky,J. Phys. Chem, A118, 9734 (2014).
25R. K. Nesbet,Phys. Rev. A20, 58 (1979).
26P. ˇCársky and R. ˇCurík, in Low-Energy Electron Scattering by Molecules,
Biomolecules and Surfaces, edited by P. ˇCársky and R. ˇCurík (CRC Press;
Taylor&Francis Group, 2012), p. 263.
27P. ˇCársky and R. ˇCurík,Theor. Chem. Acc.134, 102 (2015).
28R. ˇCurík and M. Šulc,J. Phys. B: At., Mol. Opt. Phys.43, 175205 (2010). 29J. Sadlej,Collect. Czech. Chem. Commun.53, 1955 (1988).
30Seehttp://daltonprogram.orgfor Dalton, a molecular electronic structure pro-gram, Release 2.0, 2005.
31T. Shimanuchi, Tables of Molecular Vibrational Frequencies Consolidated (National Bureau of Standards, 1972), Vol. 1, p. 1.
32D. M. Chase,Phys. Rev.104, 838 (1956).
33A. Herzenberg,J. Phys. B: At., Mol. Opt. Phys.1, 548 (1968). 34N. Chandra and A. Temkin,Phys. Rev. A13, 188 (1976). 35A. J. F. Siegert,Phys. Rev.56, 750 (1939).
36O. I. Tolstikhin, V. N. Ostrovsky, and H. Nakamura,Phys. Rev. A58, 2077 (1998).
37
I. C. Walker, A. Stamatovic, and S. F. Wong,J. Chem. Phys.69, 5532 (1978).
38
S. T. Chourou and A. E. Orel,Phys. Rev. A77, 042709 (2008).
39
L. Andjelkovic, M. Peric, M. Zlatar, S. Grubiši´c, and M. Gruden-Pavlovi´c, Tertrahedron Lett.53, 794 (2012).
40A. P. Bazante, E. R. Davidson, and R. J. Bartlett,J. Chem. Phys.142, 204304 (2015).