HAL Id: hal-00303154
https://hal.archives-ouvertes.fr/hal-00303154
Submitted on 1 Nov 2007HAL is a multi-disciplinary open access
archive for the deposit and dissemination of sci-entific research documents, whether they are pub-lished or not. The documents may come from teaching and research institutions in France or abroad, or from public or private research centers.
L’archive ouverte pluridisciplinaire HAL, est destinée au dépôt et à la diffusion de documents scientifiques de niveau recherche, publiés ou non, émanant des établissements d’enseignement et de recherche français ou étrangers, des laboratoires publics ou privés.
Modeling cosmogenic radionuclides 10Be and 7Be
during the Maunder Minimum using the
ECHAM5-HAM General Circulation Model
U. Heikkilä, J. Beer, J. Feichter
To cite this version:
U. Heikkilä, J. Beer, J. Feichter. Modeling cosmogenic radionuclides 10Be and 7Be during the Maunder Minimum using the ECHAM5-HAM General Circulation Model. Atmospheric Chemistry and Physics Discussions, European Geosciences Union, 2007, 7 (6), pp.15341-15372. �hal-00303154�
ACPD
7, 15341–15372, 2007 10
BE,7BE modeled in ice cores
U. Heikkil ¨a et al.
Title Page Abstract Introduction Conclusions References Tables Figures ◭ ◮ ◭ ◮ Back Close
Full Screen / Esc
Printer-friendly Version Interactive Discussion
EGU Atmos. Chem. Phys. Discuss., 7, 15341–15372, 2007
www.atmos-chem-phys-discuss.net/7/15341/2007/ © Author(s) 2007. This work is licensed
under a Creative Commons License.
Atmospheric Chemistry and Physics Discussions
Modeling cosmogenic radionuclides
10
Be
and
7
Be during the Maunder Minimum
using the ECHAM5-HAM General
Circulation Model
U. Heikkil ¨a1, J. Beer1, and J. Feichter2
1
EAWAG, D ¨ubendorf, Switzerland
2
Max-Planck Institute for Meteorology, Hamburg, Germany
Received: 18 September 2007 – Accepted: 19 October 2007 – Published: 1 November 2007 Correspondence to: U. Heikkil ¨a (ulla.heikkilae@eawag.ch)
ACPD
7, 15341–15372, 2007 10
BE,7BE modeled in ice cores
U. Heikkil ¨a et al.
Title Page Abstract Introduction Conclusions References Tables Figures ◭ ◮ ◭ ◮ Back Close
Full Screen / Esc
Printer-friendly Version Interactive Discussion
EGU
Abstract
All existing 10Be records from Greenland and Antarctica show increasing concentra-tions during the Maunder Minimum period (MM), 1645–1715, when solar activity was very low and the climate was colder (little ice age). In detail, however, the10Be records deviate from each other. We investigate to what extent climatic changes influence the
5 10
Be measured in ice by modeling this period using the ECHAM5-HAM general circu-lation model. Production calcucircu-lations show that during the MM the mean global10Be production was higher by 32% than at present due to lower solar activity. Our modeling shows that the zonally averaged modeled10Be deposition flux deviates by only ∼8% from the average increase of 32%, indicating that climatic effects are much smaller than
10
the production change. Due to increased stratospheric production, the10Be content in the downward fluxes is larger during MM, leading to larger 10Be deposition fluxes in the subtropics, where stratosphere-troposphere exchange (STE) is strongest. In polar regions the effect is small. In Greenland the deposition change depends on latitude and altitude. In Antarctica the change is larger in the east than in the west. We use the
15 10
Be/7Be ratio to study changes in STE. We find larger change between 20◦N–40◦N during spring, pointing to a stronger STE in the Northern Hemisphere during MM. In the Southern Hemisphere the change is small. These findings indicate that climate changes do influence the 10Be deposition fluxes, but not enough to significantly dis-turb the production signal. Climate-induced changes remain small, especially in polar
20
regions.
1 Introduction 10
Be (half-life 1.5 million years) and7Be (half-life 53.2 days) are natural radionuclides, which are produced in the atmosphere by collisions of cosmic ray particles with at-mospheric N and O atoms. Their production rate anticorrelates with solar activity and
25
so-ACPD
7, 15341–15372, 2007 10
BE,7BE modeled in ice cores
U. Heikkil ¨a et al.
Title Page Abstract Introduction Conclusions References Tables Figures ◭ ◮ ◭ ◮ Back Close
Full Screen / Esc
Printer-friendly Version Interactive Discussion
EGU lar wind and the geomagnetic dipole field (Masarik and Beer, 1999). Soon after their
production 10Be and 7Be become attached to ambient aerosols (mostly sulfate) and are transported and deposited with them. Besides radioactive decay the only sink for the radionuclides is wet and dry deposition. Owing to its long half-life, 10Be can be measured in natural archives, revealing information about past changes in the
produc-5
tion rate. 10Be measured in ice cores has recently been used to reconstruct the solar activity during the Holocene (McCracken et al., 2004; Muscheler et al., 2007; Von-moos et al., 2006). All these reconstructions are based on the assumption that the
10
Be concentrations archived in ice are directly proportional to their production rate. While this is a reasonable first assumption in view of the fact that10Be is well mixed
10
during its residence time of 1–2 years in the stratosphere, and changes in snow ac-cumulation rate are smoothed out when averaged over several years, climate changes lasting over decades, such as the cooling which occurred during the Maunder Mini-mum, could cause significant changes in the10Be concentrations in ice. Comparison of Arctic and Antarctic10Be records reveals very similar variability overall indicating that
15
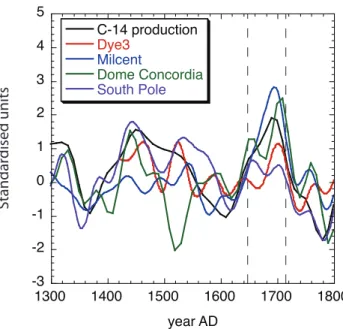
the variations observed are solar changes. However, in detail the records deviate from each other. Figure 1 shows the10Be concentrations measured in ice at four different sites, Dye3 (Beer et al., 1990) and Milcent (Beer et al., 1988) in Greenland and Dome Concordia and the South Pole in Antarctica (Bard et al., 1997; Raisbeck et al., 1978; Raisbeck et al., 1990). All records have been standardized to a mean value of 1. The
20
production rate of another cosmogenic radionuclide,14C, is also shown (Stuiver et al., 1977). The production processes of14C are similar to those of10Be, but14C is archived in tree rings and its geochemical behavior is completely different. After its production
14
C oxidizes to 14CO2 and is involved in the carbon cycle. Although extracted from
completely different types of archives situated in very different latitudes, both
radionu-25
clides show a similar production signal. This is reflected in Fig. 1 by the fact that all data sets show a maximum during the Maunder Minimum, although its intensity varies. This indicates that the radionuclides show a common solar signal even though their concentrations are influenced by the local meteorology.
ACPD
7, 15341–15372, 2007 10
BE,7BE modeled in ice cores
U. Heikkil ¨a et al.
Title Page Abstract Introduction Conclusions References Tables Figures ◭ ◮ ◭ ◮ Back Close
Full Screen / Esc
Printer-friendly Version Interactive Discussion
EGU The Maunder Minimum (1645–1715) coincides with the coldest period during the
Little Ice Age (1300–1800) in the Northern Hemisphere. This period is characterized by especially low solar activity, during which very few sunspots were observed. The change in the solar irradiance between the Maunder Minimum and the present day is not known and the estimates range from 0.05% to 0.5% (see Luterbacher, 1999, and
5
references therein for discussion). The Late Maunder Minimum (1675–1715) was the climax of this cold period with especially severe winters and wetter and colder summers in central and eastern Europe (Luterbacher, 1999).
In order to study production and climate related changes of10Be and7Be transport and deposition to polar regions during two climatically different periods, we compare
10
the Maunder Minimum (MM) with Present Day (PD). The 10Be concentrations mea-sured in ice depend on the solar modulation of the production rate, the stratosphere-troposphere exchange (STE), the tropospheric transport and the precipitation rate at the measurement site. An important question is to what extent the production changes of 10Be are masked by the meteorological conditions during periods of variable
cli-15
mate. Another interesting issue is whether there have been changes in the intensity of STE which can influence the10Be concentrations between MM and PD. Finally, we want to investigate whether climate induced changes in10Be deposition differ between Greenland and Antarctica.
An earlier general circulation model study has addressed the effect of a changing
20
climate on 10Be. Field et al. (2006) modeled the transport of 10Be to polar regions under variable solar, magnetic field and greenhouse gas conditions. Their model simu-lations confirmed that changes in transport should be taken into account when inferring production changes in ice cores.
The 10Be/7Be ratio offers an interesting tool to study the stratospheric transport of
25
the radionuclides. The10Be/7Be ratio at the time of production is 0.5. Since this ratio only depends on the nuclear reactions, it can be considered as constant in time (Lal and Peters, 1967; Masarik and Beer, 1999). However, the ratio grows exponentially with time due to the radioactive decay of7Be. Koch and Rind (1998) and Rehfeld and
ACPD
7, 15341–15372, 2007 10
BE,7BE modeled in ice cores
U. Heikkil ¨a et al.
Title Page Abstract Introduction Conclusions References Tables Figures ◭ ◮ ◭ ◮ Back Close
Full Screen / Esc
Printer-friendly Version Interactive Discussion
EGU Heimann (1995) have used the10Be/7Be ratio in their model runs to study stratospheric
transport. Land and Feichter (2003) also used the10Be/7Be ratio to study the effect of a changing climate on the STE. They found that the induced changes in STE were latitude dependent depending on the involved processes. They concluded that the
10
Be/7Be ratio depends not only on the STE but also on tropospheric transport in a
5
changing climate which thus has to be taken into account.
The10Be/7Be ratio has also been used in connection with observational data to de-tect STE. Heikkil ¨a et al. (2007)1 measured10Be and7Be at a high and a low altitude station in Switzerland and detected a maximum of 10Be/7Be in spring at the high al-titude station. The ratio at the low alal-titude station did not show such a strong spring
10
peak. Also Brown et al. (1988), Graham et al. (2003) and Monaghan et al. (1985/1986) have published10Be/7Be ratios. Graham et al. (2003) also detected a maximum in the
10
Be/7Be ratio during winter and spring. The ratios, all measured in the midlatitudes, vary between 1.3 and 2, which is higher than the global average of 1.1–1.4 estimated by Heikkil ¨a et al. (2007)1 using a 2-box model pointing to a strong latitudinal
depen-15
dence.
2 Model description and setup
ECHAM5 is a fifth-generation atmospheric global circulation model (GCM) developed at the Max-Planck Institute for Meteorology, Hamburg, evolving originally from the Euro-pean Centre of Medium Range Weather Forecasts (ECWMF) spectral weather
predic-20
tion model. It solves the prognostic equations for vorticity, divergence, surface pressure and temperature, expressed in terms of spherical harmonics with a triangular trunca-tion. Non-linear processes and physical parametrizations are solved on a Gaussian grid. A complete description of the ECHAM5 GCM is given in Roeckner et al. (2003).
1
Heikkil ¨a, U., Beer, J., and Alfimov, V.: 10Be and7Be in precipitation in D ¨ubendorf (440 m) and at Jungfraujoch (3580 m), Switzerland (1998–2005), submitted, 2007.
ACPD
7, 15341–15372, 2007 10
BE,7BE modeled in ice cores
U. Heikkil ¨a et al.
Title Page Abstract Introduction Conclusions References Tables Figures ◭ ◮ ◭ ◮ Back Close
Full Screen / Esc
Printer-friendly Version Interactive Discussion
EGU The additional aerosol module HAM includes the microphysical processes, the
emis-sion and deposition of aerosols, a sulfur chemistry scheme and the radiative prop-erty scheme of the aerosols (Stier et al., 2005). For this study a model version with a horizontal resolution of T42 (2.8×2.8 degrees) with 31 vertical levels up to 10 hPa (∼31 km) was used. Each run was allowed to spin up for five years to let10Be reach
5
the equilibrium. For the MM, only the years 1705–1709, and for the PD, the years 1986–1990, were used for the analysis. The production rates of the radionuclides were taken from Masarik and Beer (1999). The profiles were interpolated as a function of lat-itude and altlat-itude using the solar modulation function φ available athttp://www.faa.gov/ education research/research/med humanfacs/aeromedical/radiobiology. These φ
val-10
ues differ only slightly from values reconstructed by Usoskin et al. (2005). For the PD run, monthly mean φ values were used so that temporal changes in the production rate were taken into account by the model. During the MM a constant value of φ=200 MeV was assumed, which is an average for the whole period of MM (McCracken et al., 2004). This increases the production rate of cosmogenic radionuclides by 32% during
15
the MM compared with PD. The change in the geomagnetic field intensity is small and was neglected in this study (Yang et al., 2000).
The aerosol emission for both scenarios PD (year 2000) and MM (preindustrial, year 1750) was taken from the AEROCOM aerosol model inter–comparison experiment B. This data is available athttp://nansen.ipsl.jussieu.fr/AEROCOM.
20
For these runs we used prescribed sea surface temperatures (SST), which were ob-tained from the coupled atmosphere–ocean model ECHAM4-HOPE-G (ECHO-G) run (Gonzalez-Rouco et al., 2003; Zorita et al., 2005). During the MM the solar constant was reduced by 1.5 W/m2compared with the present day value of 1365 W/m2following the ECHO-G run (Crowley et al., 2000). The greenhouse gases were set to
preindus-25
trial values (CO2=283 ppm, CH4=716 ppm, N2O=276.7 ppm, CFCs=0).
A comparison with the observations shows a tendency of the simulations to underes-timate observed deposition fluxes and atmospheric concentrations. Although observa-tional data are sparse, this indicates that the source strength may be underestimated.
ACPD
7, 15341–15372, 2007 10
BE,7BE modeled in ice cores
U. Heikkil ¨a et al.
Title Page Abstract Introduction Conclusions References Tables Figures ◭ ◮ ◭ ◮ Back Close
Full Screen / Esc
Printer-friendly Version Interactive Discussion
EGU The Masarik and Beer (1999) production rate was therefore increased by 50%. In their
most recent production calculations the stratospheric production rate is higher by 15%, the tropospheric rate by 11% and the global average production rate by 13% (Masarik, 20072). Hence, the production increase of 50% made for this study represents rather an upper limit.
5
2.1 Deposition of10Be and7Be
The10Be and7Be are transported in ECHAM5-HAM similarly to aerosols. The deposi-tion of these tracers, however, needs to be described explicitly because the deposideposi-tion processes of the aerosol module HAM depend on the aerosol characteristics, such as solubility and size. It is necessary to define to which aerosols 10Be and 7Be are
at-10
tached and to describe their deposition proportional to these aerosols. This appeared to be the most important issue in modeling the radionuclides. Since most of the ra-dionuclides are produced in the stratosphere (50% according to Masarik and Beer, 1999, and 67% according to Lal and Peters, 1967) where sulfate particles dominate, a strong connection between sulfate and7Be deposition has been established (Igarashi
15
et al., 1998) and10Be and7Be were only attached to sulfate.
ECHAM5-HAM calculates the sedimentation and dry deposition as a product of the sedimentation or dry deposition velocity and the atmospheric aerosol concentration. The sedimentation is calculated throughout the atmospheric column. The dry deposi-tion depends on the aerodynamic resistance of the surface and acts as a lower
bound-20
ary condition for the vertical diffusion. Therefore it is only calculated for the surface layer concentration. For the radionuclides the sedimentation velocity and dry deposi-tion velocity are calculated as an average of the deposideposi-tion velocities of the aerosols. This average is weighted by the surface area of the aerosols because the probability of a radionuclide becoming attached to an aerosol is proportional to its surface area.
25
2
Masarik, J. and Beer, J.: Simulation of particle fluxes and cosmogenic nuclide production in the Earth’s atmosphere revisited, J. Geophys. Res., submitted, 2007.
ACPD
7, 15341–15372, 2007 10
BE,7BE modeled in ice cores
U. Heikkil ¨a et al.
Title Page Abstract Introduction Conclusions References Tables Figures ◭ ◮ ◭ ◮ Back Close
Full Screen / Esc
Printer-friendly Version Interactive Discussion
EGU The wet deposition of aerosols in ECHAM5-HAM is treated differently for convective
and stratiform clouds. A wet scavenging efficiency is calculated by both the convective and the stratiform routines and averaged. The averaged scavenging efficiency is then applied to the wet deposition of the radionuclides.
In ice clouds we assume that only 10% of the radionuclide mass is scavenged by
5
nucleation scavenging (Feichter et al., 2004).
3 Model validation
3.1 Surface air concentrations and deposition fluxes
To validate the modeled7Be surface air concentrations, the collection of7Be data mea-sured in air filters worldwide, provided by the Environmental Measurement Laboratory,
10
has been used. Yearly average concentrations are available for 91 stations, and sea-sonal data for 46 stations. The observational data used was averaged over the whole measurement period and scaled to an average solar year of solar modulation function φ=700 MeV (see Koch et al., 1996, for description).
Less data is available in the case of7Be deposition fluxes, providing, therefore, less
15
than worldwide coverage. The data used in this study is from 36 stations and is gener-ally the same as used by Koch et al. (1996) and Land and Feichter (2003).
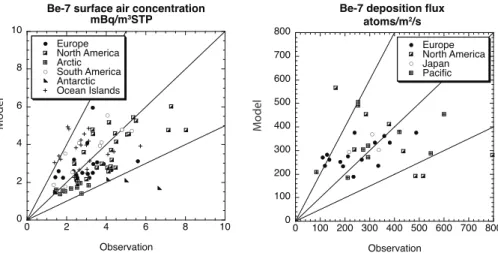
Figure 2 compares the modeled and measured annual average7Be concentrations and deposition fluxes from different continents. The 7Be surface air concentrations agree generally within a factor of 2 with the observed concentrations and there seems
20
to be no regional bias. Only at two of the Antarctic stations are the modeled concen-trations too low. The agreement of the deposition fluxes is also good although the modeled values deviate more from the observations than the surface air concentra-tions. This is probably due to the fact that annual variations are less smoothed out during shorter observation times of the deposition fluxes.
25
ACPD
7, 15341–15372, 2007 10
BE,7BE modeled in ice cores
U. Heikkil ¨a et al.
Title Page Abstract Introduction Conclusions References Tables Figures ◭ ◮ ◭ ◮ Back Close
Full Screen / Esc
Printer-friendly Version Interactive Discussion
EGU Overall, the modeled concentrations agree well with the measurements at continental
stations and high altitude stations as well as on the islands. At Kap Tobin in Greenland the model simulates the correct order of magnitude of the observations but the strong seasonality observed is not reproduced. A similar though less pronounced effect is observed in Antarctica.
5
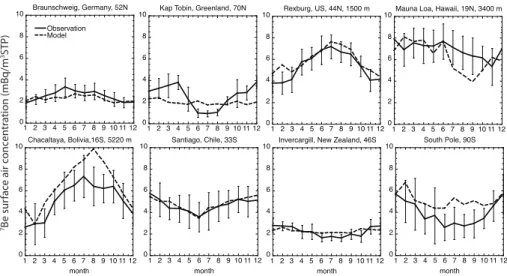
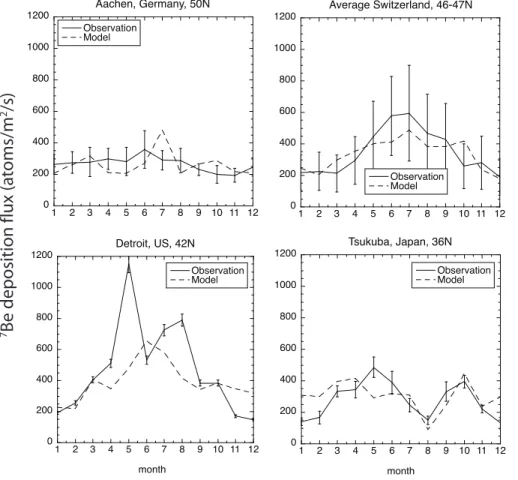
Seasonal7Be deposition fluxes measured in Germany (Thomas Steinkopff, German Weather Service, private communication), Switzerland (Heikkil ¨a et al., 20071), United States (McNeary and Baskaran, 2003) and Japan (Igarashi et al., 1998) are shown in Fig. 4. The observed seasonal fluxes were averaged over the measurement period, which was usually not the same as the modeled period. At the European and Japanese
10
stations the data cover several years, at Detroit only 18 months, leading to a larger monthly variability. The error bars are standard deviations of the monthly averages. In the case of Detroit the measurement errors are given (<5%).
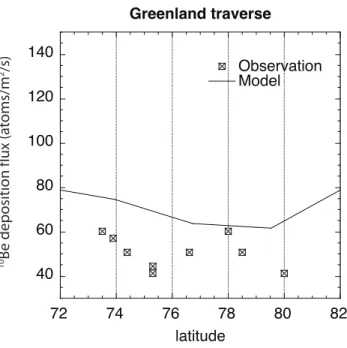
To validate the modeled 10Be deposition fluxes, we compare them with the fluxes measured during a Greenlandic traverse (Stanzick, 1996) from central to northern
15
Greenland. Shallow cores from different latitudes cover periods ranging from medieval times to the mid 1990s (Fig. 5). Only those fluxes are used which cover the period from 1980 to 1994 and which coincide with the calculated period. The modeled 10Be de-position flux was averaged over the Greenlandic longitudes. The agreement between the measured and modeled fluxes is generally good. The modeled fluxes are
approxi-20
mately 30% higher than the observed fluxes, being well within the accepted uncertainty of a factor of two.
3.2 Altitude profiles
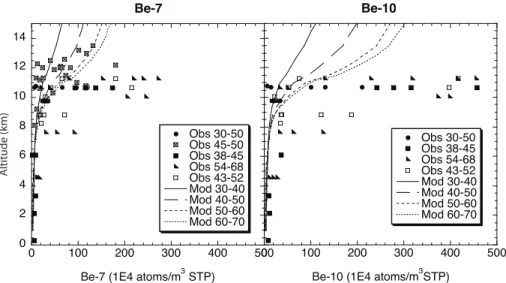
In Fig. 6 the modeled10Be and 7Be concentrations in air are compared with obser-vations from aircraft measurements (Dibb et al., 1997; Jordan et al., 2003; Winiger
25
et al., 1976) from the troposphere and lower stratosphere (altitudes between 0 and 14 km). All observations are from the Northern Hemisphere, representing different lon-gitudes and time periods. Because of their instantaneous character, the observations
ACPD
7, 15341–15372, 2007 10
BE,7BE modeled in ice cores
U. Heikkil ¨a et al.
Title Page Abstract Introduction Conclusions References Tables Figures ◭ ◮ ◭ ◮ Back Close
Full Screen / Esc
Printer-friendly Version Interactive Discussion
EGU represent specific meteorological conditions and lie within a wide range. Therefore we
compare them with modeled zonal mean values of four different latitude bands (30– 40◦N, 40–50◦N, 50–60◦N and 60–70◦N) corresponding to the observations. If the modeled zonal mean values lie between the range of the observations, we consider the agreement between the modeled and measured concentrations to be good.
5
In the stratosphere, the concentrations are mostly lower at low latitudes and increase towards the poles in concordance with the latitudinal dependence of the 10Be and
7
Be production rates. In the troposphere this structure disappears due to tropospheric transport and precipitation. The variability in the observational data is high, especially at 10–11 km, depending on whether the samples were taken in the stratosphere or in
10
the troposphere, and also on the temporal and longitudinal differences of the obser-vations. The modeled concentrations tend to be on the low side of the observations, especially in the case of10Be. Too low concentrations in the stratosphere indicate that in the model the tracers are transported downwards too rapidly and therefore cannot accumulate enough.7Be is less affected by this process than10Be because of its short
15
half-life compared with the stratospheric residence times. A too strong STE seems to be a common problem of many GCMs, including ECHAM5 and is likely to be associated with too coarse vertical resolution (Timmreck et al., 1999).
4 Comparison between the Maunder Minimum (MM) and the Present Day (PD)
Table 1 shows the global budgets of 10Be and 7Be for the MM and PD simulations.
20
The radionuclide production rate was higher by 32% during MM compared with PD. This leads to a corresponding increase of the 10Be deposition by 32%. In contrast, the7Be deposition increases by only 20% and the decay by 40%. This means that a larger part of7Be decays than is deposited, which is due to the longer stratospheric residence time. The ratio of dry to total deposition remains constant. During a period
25
of lower solar activity the contribution of low energy particles to the10Be production is higher (Masarik and Beer, 1999). These particles contribute mostly to the production
ACPD
7, 15341–15372, 2007 10
BE,7BE modeled in ice cores
U. Heikkil ¨a et al.
Title Page Abstract Introduction Conclusions References Tables Figures ◭ ◮ ◭ ◮ Back Close
Full Screen / Esc
Printer-friendly Version Interactive Discussion
EGU in the upper atmosphere, which leads to an increased stratospheric fraction of the
radionuclide production during MM compared with PD. This prolongs the atmospheric residence times and increases the burdens by 58% (10Be) and 45% (7Be). The change in the tropospheric burdens of the radionuclides is similar to the deposition change, and the tropospheric residence times remain constant. The fact that the tropospheric
5
residence times are equal in MM and in PD indicates that transport and deposition processes did not change significantly.
4.1 Comparison with ice cores
We compare the modeled 10Be concentrations in ice, the deposition fluxes and the precipitation rates with measurements from the two Greenlandic ice cores, Dye3 and
10
Milcent, and two Antarctic ones, the South Pole and Dome Concordia. The compar-ison of measured and modeled average precipitation rates, 10Be concentrations and fluxes are summarized in Table 2. The precipitation rates are modern values calcu-lated from the accumulation rates measured in the ice cores. The10Be concentrations are averaged over the period of 1705–1709. The measured fluxes are derived from the
15
measured10Be concentrations using the modern precipitation rate.
In southern and central Greenland the modeled 10Be concentration in rain dur-ing the MM (1.4×10⁴atoms/g) agrees fairly well with the observed concentration (∼1.7×10⁴atoms/g). At Milcent the modeled precipitation rate (0.8 mm/day water equivalent (W. E.)) is lower than the observed one (1.4 mm/day W. E.). The10Be flux
20
is also lower than the observed one, but the10Be concentration in precipitation is cor-rect. If we average over the neighboring grid boxes, the precipitation rate is closer to the observed one (1.0 mm/day W. E.), but the10Be concentration remains the same. At the Dye3 station the model reproduces the observed precipitation rate well (both 1.4 mm/day W. E.). The 10Be concentration in precipitation (1.2×10⁴atoms/g) also
25
agrees well with the observation (1.5×10⁴atoms/g).
In Antarctica, the precipitation rates are generally lower than in Greenland, leading to higher10Be concentrations in precipitation. ECHAM5-HAM is capable of simulating the
ACPD
7, 15341–15372, 2007 10
BE,7BE modeled in ice cores
U. Heikkil ¨a et al.
Title Page Abstract Introduction Conclusions References Tables Figures ◭ ◮ ◭ ◮ Back Close
Full Screen / Esc
Printer-friendly Version Interactive Discussion
EGU lower precipitation rates in Antarctica, although the precipitation rates at the Antarctic
sites are still 2–3 times too high. This leads to a dilution resulting in lower modeled
10
Be concentrations in precipitation. Therefore, we also compare the deposition fluxes. The observed deposition fluxes in Table 2 are approximated using the modern day pre-cipitation rate because the prepre-cipitation rate during the MM is not known. The modeled
5 10
Be deposition fluxes agree within a factor of 2 with the observed fluxes, indicating that the uncertainty is mainly related to an incorrect precipitation rate rather than to transport to the Antarctic continent. This is also confirmed by the good agreement of the modeled7Be surface air concentrations with the measured data from air filters at the South Pole (see Sect. 3.1).
10
The precipitation rate modeled at Dome Concordia is approximately 2–3 times too high, leading to a 10Be concentration, which is approximately 6 times too low. The modeled flux is comparable with the observed flux. If we corrected the precipitation rate by a factor of 3, the10Be concentrations would still be too low but within a factor of 2 of the observed value. At the South Pole, the modeled precipitation rate agrees
15
slightly better with the observation than at Dome Concordia, and is twice as high. The
10
Be concentration is about a factor of 2 too low and agrees much better with the ob-servations than at Dome Concordia. A correction of the precipitation rate by a factor of 2 would lead to an agreement with the measured10Be concentration. We conclude that ECHAM5-HAM simulates the10Be concentrations in Greenland very well, in contrast
20
to Antarctica, where the very low precipitation rates complicate the correct modeling of the concentrations.
4.2 Change in deposition of10Be
Figure 7 shows the10Be deposition fluxes during MM and PD, and the change between the two periods. The distribution of the fluxes is strongly determined by the precipitation
25
rate. The deposition is high in the intertropical convection zone where the precipitation is high, and low in the polar regions with low precipitation. The maximum deposition occurs in the midlatitudes as a result of high precipitation in the midlatitude storm
ACPD
7, 15341–15372, 2007 10
BE,7BE modeled in ice cores
U. Heikkil ¨a et al.
Title Page Abstract Introduction Conclusions References Tables Figures ◭ ◮ ◭ ◮ Back Close
Full Screen / Esc
Printer-friendly Version Interactive Discussion
EGU tracks. Moreover, the injections of stratospheric air with high10Be and7Be content in
the subtropics increase the deposition fluxes broadening the maximum towards these latitudes. Generally the deposition distribution of both 10Be and 7Be (not shown) is very similar, but the10Be deposition has a larger variability because its changes are not damped by radioactive decay.
5
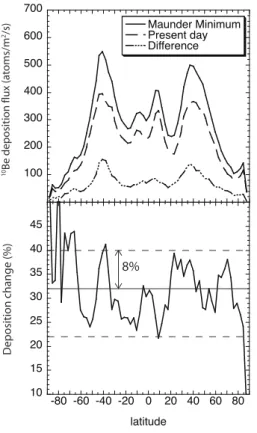
Figure 7 also shows the change in10Be deposition between MM and PD, in absolute and relative units. The absolute change is largest in the subtropics and small in the polar regions. In general, the relative changes are highest in the midlatitudes and in the convection zone. The deviations from the average production–induced change of 32% are within ∼8%. The fact that the production change dominates the variability
10
is an important result because it contradicts the claim that weather–related changes mask the production signal (Lal, 1987). On the other hand, these changes can explain the observed discrepancies between10Be records from different sites (Fig. 1).
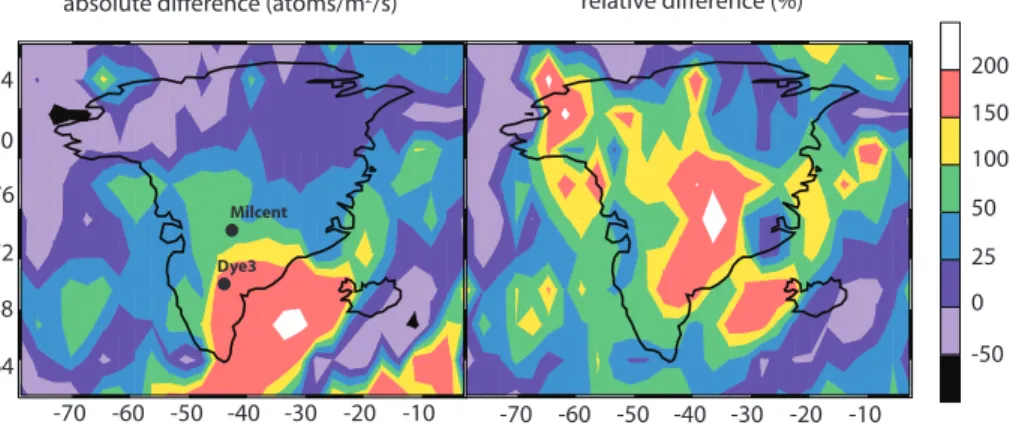
Figures 8 and 9 show the10Be deposition changes in Greenland and in Antarctica. The absolute deposition change is largest in southern Greenland and decreases
to-15
wards the pole. The relative change in Greenland seems to follow the topography and is largest at the highest point of Greenland. Both sites, Milcent (2410 m a.s.l.) and Dye3 (2480 m a.s.l.), have the same altitude. The model results reveal similar depo-sition changes between MM and PD for both sites. In Antarctica, the modeled10Be concentrations do not agree as well with the observations as in Greenland, but the
20
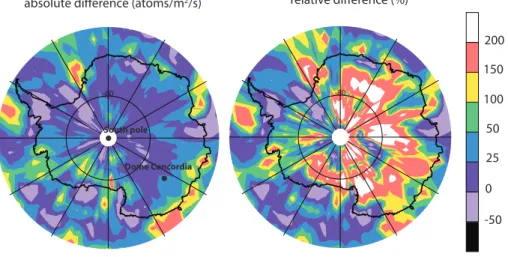
model uncertainty may be similar for both runs. In Antarctica the change, both abso-lute and relative, seems to be larger in eastern Antarctica, where Dome Concordia is located, than at the South Pole. This suggests that the change at Dome Concordia was larger than at the South Pole although the accumulation rate at Dome Concordia is smaller. This finding seems to be in agreement with the observed maxima (Fig. 1)
25
ACPD
7, 15341–15372, 2007 10
BE,7BE modeled in ice cores
U. Heikkil ¨a et al.
Title Page Abstract Introduction Conclusions References Tables Figures ◭ ◮ ◭ ◮ Back Close
Full Screen / Esc
Printer-friendly Version Interactive Discussion
EGU 4.3 Changes in STE between the Maunder Minimum and the Present Day using
10
Be/7Be
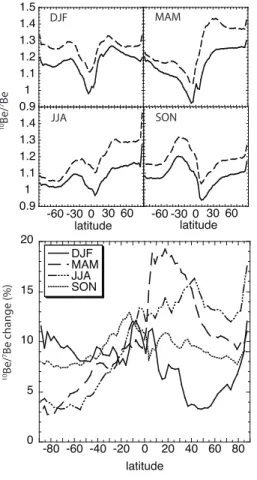
To study possible changes in STE between MM and PD, we investigate the10Be/7Be ratio. At the time of production the global mean ratio is 0.5, but it grows exponentially with time as7Be decays. In the stratosphere high ratios are observed because of the
5
long residence time which allows7Be to decay, raising the ratio. In the troposphere the ratios remain closer to 0.5 because the tropospheric residence time is short compared with the half-life of7Be. Therefore, large 10Be/7Be ratios in the troposphere point to an intrusion of stratospheric air into the troposphere. As the net mass downward flux from the stratosphere shows a distinct seasonal cycle with a maximum in spring in the
10
Northern Hemisphere and in midwinter in the Southern Hemisphere (Stohl et al., 2003), we expect larger10Be/7Be ratios during these seasons. The upper panel of Fig. 10 shows the zonally averaged seasonal10Be/7Be ratios calculated from the deposition fluxes.
The slightly higher level of10Be/7Be ratios during MM is caused by a longer
strato-15
spheric residence times of7Be and10Be compared with PD, caused by a higher frac-tion of stratospheric producfrac-tion. Because the increase is similar in all latitudes, it is probably not caused by changes in STE, which has a latitudinal dependence. Instead, because the stratospheric downward fluxes are strongest in the subtropics, changes in10Be/7Be ratios at these latitudes could be attributed to STE changes. The lower
20
panel of Fig. 10 shows the relative seasonal change in the10Be/7Be ratio. The largest change takes place during spring in the Northern Hemisphere at mid- and low latitudes. During the summer months in both hemispheres the ratios are higher than during the winter months probably because of a lower precipitation rate, which increases the tro-pospheric residence time. During the Southern Hemispheric fall the ratio has a
mid-25
and low latitude maximum, but it is much less pronounced than in the Northern Hemi-sphere. These results point to a stronger STE in the Northern Hemisphere during the colder climate of MM. In the Southern Hemisphere the changes were probably not
ACPD
7, 15341–15372, 2007 10
BE,7BE modeled in ice cores
U. Heikkil ¨a et al.
Title Page Abstract Introduction Conclusions References Tables Figures ◭ ◮ ◭ ◮ Back Close
Full Screen / Esc
Printer-friendly Version Interactive Discussion
EGU significant.
5 Summary and conclusions
The cosmogenic radionuclides 10Be (half-life 1.5×10⁶ years) and 7Be (half-life 53.2 days) have been modeled during the Maunder Minimum (MM) and the present day (PD) climate with the ECHAM5-HAM general circulation model. We concentrated on
5
changes which can influence the10Be concentrations measured in ice cores such as enhanced radionuclide production, possible changes in the stratosphere-troposphere exchange (STE), and in the local precipitation rate at the measurement sites. We also investigated to what extent climate changes during a period of low solar activity mask the production signal in the measured10Be concentrations in ice cores.
10
The lower solar activity during the MM raises the mean global production rate of10Be and7Be by 32%. Moreover, the production becomes stronger in the upper atmosphere, raising the ratio of stratospheric to total production. This leads to longer atmospheric residence times and higher stratospheric burdens of the radionuclides. Higher strato-spheric burdens cause a higher radionuclide content in the downward fluxes from the
15
stratosphere. This causes higher deposition fluxes during MM in the subtropics, but in the polar regions the effect is small.
While the total10Be deposition increases by 32%, directly reflecting the increase in production rate, the7Be deposition increases only by 20% because a larger part of7Be decays due to longer atmospheric residence times. The zonal mean10Be deposition
20
change deviates locally only by ∼8% from the mean increase of 32%. The ∼8% varia-tion represents the climate signal, which is caused by changes in precipitavaria-tion rate and tropospheric transport. It is small compared to the production change. Therefore, the common assumption made so far when reconstructing the solar activity, namely that the10Be measured in ice is proportional to the total production rate, seems reasonable.
25
The ECHAM5-HAM simulates the 10Be fluxes and concentrations in ice at Green-landic sites fairly well. In Antarctica the model has some difficulties in reproducing the
ACPD
7, 15341–15372, 2007 10
BE,7BE modeled in ice cores
U. Heikkil ¨a et al.
Title Page Abstract Introduction Conclusions References Tables Figures ◭ ◮ ◭ ◮ Back Close
Full Screen / Esc
Printer-friendly Version Interactive Discussion
EGU very low level of precipitation which leads to an underestimation of the10Be
concentra-tions in ice. In Greenland the absolute deposition change between MM and PD seems to depend on the topography with a north-south gradient and with the largest values in the south of Greenland. The relative difference is largest at high altitudes. The model results suggest a similar deposition change between MM and PD at Dye3 and Milcent.
5
In Antarctica the modeled deposition changes remain generally small, especially in dry areas. The model results suggest that the change was larger at Dome Concordia than at the South Pole.
Finally, the10Be/7Be ratio is generally higher due to a longer stratospheric residence time during the MM. This longer residence time is primarily the result of a change in
10
the structure of stratospheric to tropospheric production between MM and PD and not in the STE. However, during spring in the Northern Hemisphere a large increase in the ratio between the 20◦N and 40◦N is observed, which probably can be attributed to a stronger STE during the MM. In the Southern Hemisphere no such strong change was observed.
15
Modeling the atmospheric transport improves the interpretation of10Be in ice cores in terms of production effects and helps to make full use of cosmogenic radionuclides. At the same time atmospheric10Be and 7Be data provide a tool to study atmospheric transport processes such as the STE, and to validate GCMs.
Acknowledgements. We are grateful to the German Computer Center (DKRZ) for providing
20
us with the computing time. This work is financially supported by the Swiss National Science Foundation.
References
Bard, E., Raisbeck, G., Yiou, F., and Jouzel, J.: Solar modulation of cosmogenic nuclide pro-duction over the last millennium: comparison between14C and 10Be records, Earth Planet.
25
ACPD
7, 15341–15372, 2007 10
BE,7BE modeled in ice cores
U. Heikkil ¨a et al.
Title Page Abstract Introduction Conclusions References Tables Figures ◭ ◮ ◭ ◮ Back Close
Full Screen / Esc
Printer-friendly Version Interactive Discussion
EGU Baskaran, M., Coleman, C., and Santchi, P.: Atmospheric depositional fluxes of7Be and210Pb
at Galveston and College Station, Texas, J. Geophys. Res., 98, 20 555–20 571, 1993. Beer, J., Siegenthaler, U., and Blinov, A.: Temporal10Be variations in ice: Information on solar
activity and geomagnetic mfield intensity, in: Secular Solar and Geomagnetic Variations in the Last 10,000 Years, Kluwer Academic Publishers, 297–313, 1988.
5
Beer, J., Blinov, A., Bonani, G., Finkel, R. C., Hofmann, H. J., Lehmann, B., Oeschger, H., Sigg, A., Schwander, J., Staffelbach, T., Stauffer, B., Suter, M., and W ¨olfli, W.: Use of10Be in polar ice to tracer the 11-year cycle of solar activity, Letters to Nature, 347, 164–166, 1990. Brown, L., Stensland, G. J., Klein, J., and Middleton, R.: Atmospheric deposition of7Be and
10
Be, Geochimica et Cosmochimica Acta, 53, 135–142, 1988.
10
Crowley, T.: Causes of Climate Change Over the Past 1000 Years, Science, 289, 270–277, 2000.
Dibb, J. E., Talbot, R. W., Lefer, B. L., Scheuer, E., Gregory, G. L., Browell, E. V., Bradshaw, J. D., Sandholm, S. T., and Singh, H. B.: Distributions of beryllium 7 and lead 210, and soluble aerosol-associated ionic species over the western Pacific: PEM West B, February–March
15
1994, J. Geophys. Res., 102, 28 287–28 302, 1997.
Feichter, J., Roeckner, E., Lohmann, U., and Liepert, B.: Nonlinear aspects of the climate response to greenhouse gas and aerosol forcing, J. Climate, 17(12), 2384–2398, 2004. Field, C., Schmidt, G., Koch, D., and Salyk, C.: Modeling production and
climate-related impacts on 10Be concentration in ice cores, J. Geophys. Res., 111, D15107,
20
doi:10.1029/2005JD00640, 2006.
Gonzalez-Rouco, J. F., Zorita, E., Cubasch, U., von Storch, H., Fischer–Bruns, I., Valero, F., Montavez, J. P., Schlese, U., and Legutke, S.: Simulating the climate since 1000 AD with the AOGCM ECHO–G, In: Proceedings of the ISCS1 2003 symposium ‘Solar Variability as an Input to the Earth’s Environment’, Tatransk ´a Lomnica, Slovakia, ESA SP–535, 329–338,
25
23–28 June 2003.
Graham, I., Ditchburn, R., and Barry, B.: Atmospheric deposition of 7Be and 10Be in New Zealand rain (1996–1998), Geochimica et Cosmochimica Acta, 67, 361–373, 2003.
Igarashi, Y., Hirose, K., and Otsuji-Hatori, M.: Beryllium-7 deposition and its relation to sulfate deposition, J. Atmos. Chem., 29, 217–231, 1998.
30
Jordan, C. E., Dibb, J. E., and Finkel, R. C.: 10Be/7Be tracer of atmospheric transport and stratosphere-troposphere exchange, J. Geophys. Res., 108(D8), 4234,
ACPD
7, 15341–15372, 2007 10
BE,7BE modeled in ice cores
U. Heikkil ¨a et al.
Title Page Abstract Introduction Conclusions References Tables Figures ◭ ◮ ◭ ◮ Back Close
Full Screen / Esc
Printer-friendly Version Interactive Discussion
EGU doi:10.1029/2002JD002395, 2003.
Koch, D., Jacob, D., and Graustein, W.: Vertical transport of tropospheric aerosols as indicated by7Be and210Pb in a chemical tracer model, J. Geophys. Res., 101, 18 651–18 666, 1996. Koch, D. and Rind, D.: Beryllium-10/Beryllium-7 as a tracer of stratospheric transport, J.
Geo-phys. Res., 103, 3907–3917, 1998.
5
Kolb, W.: Aktivit ¨atskonzentrationen von Radionukliden in der bodennahen Luft Norddeutsch-lands und Nordnorwegens im Zeitraum von 1963 bis 1990, Report PTB-Ra-29, Physikalisch Technische Bundesanstalt, Braunschweig, Germany, 129 pp, 1992.
Koll ´ar, D., Leya, I., Masarik, J., and Michel, R.: Calculation of cosmogenic nuclide production rates in Earth’s atmosphere and in terrestial surface rocks using improved neutron cross
10
sections, Meteoritics, 35, A90–A91, 2000.
Lal, D. and Peters, B.: Cosmic ray produced radioactivity on the Earth, Handbuch der Physik, XLVI/2, 551–612, Springer-Verlag, New York, 1967.
Lal, D.:10Be in polar ice: Data reflect changes in cosmic ray flux or polar meteorology, Geophys. Res. Lett., 14, 785–788, 1987.
15
Land, C. and Feichter, J.: Stratosphere-troposphere exchange in a changing climate simu-lated with the general circulation model MAECHAM4, J. Geophys. Res., 108(D12), 8523, doi:10.1029/2002JD002543, 2003.
Langematz, U., Claussnitzer, A., Matthes, K., and Kunze, M.: The climate during the Maunder Minimum: a simulation with the Freie Universit ¨at Berlin Climate Middle Atmosphere Model
20
(FUB–CMAM), J. Atmos. Solar-Terr. Phys., 67, 55–60, 2005.
Luterbacher, J.: Climate reconstruction and synoptic analysis of the Late Maunder Minimum (AD 1675–1715) period, PhD Thesis, University of Bern, 1999.
Masarik. J. and Beer, J.: Simulation of particle fluxes and cosmogenic nuclide production in the Earth’s atmosphere, J. Geophys. Res., 104, 12 099–12 111, 1999.
25
McCracken, K., McDonald, F., Beer, J., Raisbeck, G., and Yiou, F.: A phenomenological study of the long-term cosmic ray modulation, 850–1958 AD, J. Geophys. Res., 109, A12103, doi:1029/2005JA10685, 2004.
McNeary, D. and Baskaran, M.: Depositional charasteristics of7Be and210Pb in southeastern Michigan, J. Geophys. Res., 108(D7), 4210, doi:10.1029/2002JD00321, 2003.
30
Monaghan, M. C., Krishnaswami, S., and Turekian, K. K.: The global–average production of
10
Be, Earth Planet. Sci. Lett., 76, 279–287, 1985/1986.
ACPD
7, 15341–15372, 2007 10
BE,7BE modeled in ice cores
U. Heikkil ¨a et al.
Title Page Abstract Introduction Conclusions References Tables Figures ◭ ◮ ◭ ◮ Back Close
Full Screen / Esc
Printer-friendly Version Interactive Discussion
EGU the last 1000 yr inferred from radionuclide records, Quart. Sci. Rev., 26, 82–97, 2007.
Raisbeck, G. M., Yiou, F., Fruneau, M., Lieuvin, M., and Loiseaux, J. M.: Measurement of10Be in 1,000– and 5,000-year-old Antarctic ice, Nature, 275, 731–733, 1978.
Raisbeck, G. M., Yiou, F., Jouzel, J., and Petit, J. R.:10Be and δ2H in polar ice cores as a probe of solar variability’s influence on climate, Phil. Trans. R. Soc. Lond., A 330, 463–470, 1990.
5
Rehfeld, S. and Heimann, M.: Three dimensional atmospheric transport simulation of the ra-dioactive tracers210Pb,7Be,10Be and90Sr, J. Geophys. Res., 100, 26 141–26 161, 1995. Roeckner, E., Baeuml, G., Bonventura, L., Brokopf, R., Esch, M., Giorgetta, M., Hagemann,
S., Kirchner, I., Kornblueh, L., Manzini, E., Rhodin, A., Schlese, U., Schulzweida, U., and Tompkins, A.: The atmospheric general circulation model ECHAM5. PART I: Model
descrip-10
tion, Report 349, Max Planck Institute for Meteorology, Hamburg, Germany, available from
http://www.mpimet.mpg.de, 2003.
Stanzick, A.: R ¨aumliche und zeitliche Depositionsvariationen der Radioisotope10Be und210Pb in Eisbohrkernen Zentralgr ¨onlands, Diploma thesis, University of Heidelberg, 1996.
Stier, P., Feichter, J., Kinne, S., Kloster, S., Vignati, E., Wilson, J., Ganzeveld., L., Tegen,
15
I., Werner, M., Schulz, M., Balkanski, Y., Boucher, O., Minikin, A., and Petzold, A.: The aerosol–climate model ECHAM5-HAM, Atmos. Chem. Phys., 5, 1125–1165, 2005,
http://www.atmos-chem-phys.net/5/1125/2005/.
Stohl, A., Bonasoni, P., Cristofanelli, P., Collins, W., Feichter, J., Frank, A., Forster, C., Gera-sopoulos, E., G ¨aggeler, H., James, P., Kentarchos, T., Kromp-Kolb, H., Kr ¨uger, B., Land,
20
C., Meloen, J., Papayannis, A., Priller, A., Seibert, P., Sprenger, M., Roelofs, G. J., Scheel, H. E., Schnabel, C., Siegmund, P., Tobler, L., Trickl, T., Wernli, H., Wirth, V., Zanis, P., and Zerefos, C.: Stratosphere-troposphere exchange: A review, and what we have learnt from STACCATO, J. Geophys. Res., 108(D12), 8516, doi:10.1029/2002JD002490, 2003.
Timmreck, C., Graf, H.-F., and Feichter, J.: Simulation of Mt. Pinatubo volcanic aerosol with the
25
Hamburg Climate Model ECHAM4, Theor. Appl. Climatol., 62, 85–108, 1999.
Usoskin, I. G., Alanko–Huotari, K., Kovaltsov, G. A., and Mursula, K.: Heliospheric modula-tion of cosmic rays: Monthly reconstrucmodula-tion of 1951–2004, J. Geophys. Res., 110, A12108, doi:10.1029/2005JA011250, 2005.
Vonmoos, M., Beer, J., and Muscheler, R.: Large variations in Holocene solar activity:
Con-30
straints from10Be in the Greenland Ice Core Project ice core, J. Geophys. Res., 111, A10105, doi:10.1029/2005JA011500, 2006.
ACPD
7, 15341–15372, 2007 10
BE,7BE modeled in ice cores
U. Heikkil ¨a et al.
Title Page Abstract Introduction Conclusions References Tables Figures ◭ ◮ ◭ ◮ Back Close
Full Screen / Esc
Printer-friendly Version Interactive Discussion
EGU und jungen Spaltfragmenten an der Tropopause, Tellus, 28, 434–441, 1976.
Yang, S., Odah, H., and Shaw, J.: Variations in the geomagnetic dipole moment over the last 12 000 years, Geophys. J. Int., 140, 158–162, 2000.
Zorita, E., Gonzalez–Rouco, J. F., von Storch, H., Montavez, J. P., and Valero, F.: Natural and anthropogenic model of surface temperature variations in the last thousand years, J.
5
ACPD
7, 15341–15372, 2007 10
BE,7BE modeled in ice cores
U. Heikkil ¨a et al.
Title Page Abstract Introduction Conclusions References Tables Figures ◭ ◮ ◭ ◮ Back Close
Full Screen / Esc
Printer-friendly Version Interactive Discussion
EGU
Table 1. 10Be and7Be global averages in Maunder Minimum (MM) and in present day (PD), and change. 7 Be 1705–1709 1986–1990 Change MM–PD Production rate 0.330 g/d 0.252 g/d 31% Production stratos./tropos. 1.8 1.5 Wet deposition 0.130 g/d 0.109 g/d 20% Wet deposition/Dry deposition 92%/8% 93%/7%
Decay 0.188 g/d 0.134 g/d 40% Wet deposition/Decay 43%/57% 47%/53% Dry deposition 0.010 g/d 0.008 g/d Burden total 14.5 g 10.3 g 41% Burden stratos. 11.9 g 8.2 g 45% Burden tropos. 2.5 g 2.1 g 19%
Residence time tropospheric 18 d 18 d
Residence time total atmosphere 104 d 88 d 18%
10
Be 1705–1709 1986–1990 Change MM-PD Production rate 0.246 g/d 0.186 g/d 32% Production stratos./tropos. 1.4 1.1
Wet deposition 0.220 g/d 0.169 g/d 32% Wet deposition/Dry deposition 92%/8% 92%/8%
Dry deposition 0.019 g/d 0.014 g/d
Burden total 42.0 g 27.2 g 54%
Burden stratos. 37.4 g 23.6 g 58%
Burden tropos. 4.6 g 3.6 g 29%
Residence time tropospheric 19 d 20 d
ACPD
7, 15341–15372, 2007 10
BE,7BE modeled in ice cores
U. Heikkil ¨a et al.
Title Page Abstract Introduction Conclusions References Tables Figures ◭ ◮ ◭ ◮ Back Close
Full Screen / Esc
Printer-friendly Version Interactive Discussion
EGU
Table 2. The precipitation rates, given in mm/day Water Equivalent (W. E.), are present day
values. The10Be concentrations and fluxes are averaged over the period of 1705–1709 AD. Measured10Be fluxes are estimated from the concentrations with the modern day precipitation rate and are only approximations.
Measurement Model
Core precip. rate 10Be conc. 10Be flux precip. rate 10Be conc. 10Be flux (mm/day) (1E4 at./g) (at./m2/s) (mm/day) (1E4 at./g) (at./m2/s) Greenland: Milcent, 2410 m a.s.l. 1.4 ∼1.7 (∼270) 0.8 1.4 160 70.2◦N, 44.4◦W Dye 3, 2480 m a.s.l. 1.4 ∼1.5 (∼240) 1.4 1.2 190 65.2◦N, 48.8◦W Antarctica:
South Pole, 2800 m a.s.l. 0.1 ∼4 (∼46) 0.2 2.2 61 90◦S
Dome C, 3240 m a.s.l. <0.1 6–7 (∼77) 0.2 1.1 40 75.1◦S, 123.2◦E
ACPD
7, 15341–15372, 2007 10
BE,7BE modeled in ice cores
U. Heikkil ¨a et al.
Title Page Abstract Introduction Conclusions References Tables Figures ◭ ◮ ◭ ◮ Back Close
Full Screen / Esc
Printer-friendly Version Interactive Discussion EGU S tandar dised units -3 -2 -1 0 1 2 3 4 5 1300 1400 1500 1600 1700 1800 C-14 production Dye3 Milcent Dome Concordia South Pole year AD
Fig. 1. 10Be concentrations measured in ice at two Greenlandic stations (Dye3 (Beer et al., 1990) and Milcent (Beer et al., 1988)) and two Antarctic stations (South Pole and Dome Con-cordia (Bard et al., 1997; Raisbeck et al., 1978, 1990)) and the14C production rate derived from tree rings. The data has been standardized and filtered with a 50-year low-pass filter because of the different temporal resolution of the data.
ACPD
7, 15341–15372, 2007 10
BE,7BE modeled in ice cores
U. Heikkil ¨a et al.
Title Page Abstract Introduction Conclusions References Tables Figures ◭ ◮ ◭ ◮ Back Close
Full Screen / Esc
Printer-friendly Version Interactive Discussion EGU 0 2 4 6 8 10 0 2 4 6 8 10
Be-7 surface air concentration
mBq/m3STP Europe North America Arctic South America Antarctic Ocean Islands Observation 0 100 200 300 400 500 600 700 800 0 100 200 300 400 500 600 700 800
Be-7 deposition flux
atoms/m2/s Europe North America Japan Pacific Observation M o del M o del
Fig. 2. Scatter plot of modeled and observed7Be surface air concentrations (91 stations) and deposition fluxes (36 stations). Almost all modeled values are within the factor of 2 of the observed values (straight lines).
ACPD
7, 15341–15372, 2007 10
BE,7BE modeled in ice cores
U. Heikkil ¨a et al.
Title Page Abstract Introduction Conclusions References Tables Figures ◭ ◮ ◭ ◮ Back Close
Full Screen / Esc
Printer-friendly Version Interactive Discussion EGU 0 2 4 6 8 10 1 2 3 4 5 6 7 8 9 10 11 12 Braunschweig, Germany, 52N Observation Model 0 2 4 6 8 10 1 2 3 4 5 6 7 8 9 10 11 12 Kap Tobin, Greenland, 70N
0 2 4 6 8 10 1 2 3 4 5 6 7 8 9 10 11 12 Rexburg, US, 44N, 1500 m 0 2 4 6 8 10 1 2 3 4 5 6 7 8 9 10 11 12 Mauna Loa, Hawaii, 19N, 3400 m
0 2 4 6 8 10 1 2 3 4 5 6 7 8 9 10 11 12 Chacaltaya, Bolivia,16S, 5220 m month 0 2 4 6 8 10 1 2 3 4 5 6 7 8 9 10 11 12 Santiago, Chile, 33S month 0 2 4 6 8 10 1 2 3 4 5 6 7 8 9 10 11 12 Invercargill, New Zealand, 46S
month 0 2 4 6 8 10 1 2 3 4 5 6 7 8 9 10 11 12 South Pole, 90S month 7B e sur fac e air c onc en tr a tion (mBq/m 3STP)
Fig. 3. Seasonal cycles of7Be measured (full line) in surface air (mBq/m3STP) at selected sta-tions worldwide compared with the modeled (dashed line) concentrasta-tions. The error bars show the standard deviations of the monthly averages of the different years (8–30 years depending on the station).
ACPD
7, 15341–15372, 2007 10
BE,7BE modeled in ice cores
U. Heikkil ¨a et al.
Title Page Abstract Introduction Conclusions References Tables Figures ◭ ◮ ◭ ◮ Back Close
Full Screen / Esc
Printer-friendly Version Interactive Discussion EGU 0 200 400 600 800 1000 1200 1 2 3 4 5 6 7 8 9 10 11 12 Aachen, Germany, 50N Observation Model 0 200 400 600 800 1000 1200 1 2 3 4 5 6 7 8 9 10 11 12 Average Switzerland, 46-47N Observation Model 0 200 400 600 800 1000 1200 1 2 3 4 5 6 7 8 9 10 11 12 Tsukuba, Japan, 36N Observation Model month 7
B
e dep
osition flux (a
toms/m
2/s)
0 200 400 600 800 1000 1200 1 2 3 4 5 6 7 8 9 10 11 12 Detroit, US, 42N Observation Model monthFig. 4. 7Be seasonal deposition fluxes modeled (dashed line) and observed (full line) in Ger-many, Switzerland, U.S. and Japan. The error bars show the standard deviations of the annual averages, except at Detroit, where the measurement errors (<5%) are shown. The observa-tional data covers several years, except at Detroit (18 months).
ACPD
7, 15341–15372, 2007 10
BE,7BE modeled in ice cores
U. Heikkil ¨a et al.
Title Page Abstract Introduction Conclusions References Tables Figures ◭ ◮ ◭ ◮ Back Close
Full Screen / Esc
Printer-friendly Version Interactive Discussion EGU 10B e dep osition flux (a toms/m 2/s) 40 60 80 100 120 140 72 74 76 78 80 82 Greenland traverse Observation Model latitude
Fig. 5. Comparison of the10Be deposition flux as a function of latitude averaged over Green-land with observed fluxes during the modeled period of 1986–1990 (Stanzick, 1996).
ACPD
7, 15341–15372, 2007 10
BE,7BE modeled in ice cores
U. Heikkil ¨a et al.
Title Page Abstract Introduction Conclusions References Tables Figures ◭ ◮ ◭ ◮ Back Close
Full Screen / Esc
Printer-friendly Version Interactive Discussion EGU 0 2 4 6 8 10 12 14 0 100 200 300 400 500 Be-7 Obs 30-50 Obs 45-50 Obs 38-45 Obs 54-68 Obs 43-52 Mod 30-40 Mod 40-50 Mod 50-60 Mod 60-70
Be-7 (1E4 atoms/m3 STP)
0 100 200 300 400 500 Be-10 Obs 30-50 Obs 38-45 Obs 54-68 Obs 43-52 Mod 30-40 Mod 40-50 Mod 50-60 Mod 60-70
Be-10 (1E4 atoms/m3STP)
A
ltitude (k
m)
Fig. 6. Zonal mean modeled7Be (left) and10Be (right) concentrations in air against altitude for different latitude bands, compared with observations.
ACPD
7, 15341–15372, 2007 10
BE,7BE modeled in ice cores
U. Heikkil ¨a et al.
Title Page Abstract Introduction Conclusions References Tables Figures ◭ ◮ ◭ ◮ Back Close
Full Screen / Esc
Printer-friendly Version Interactive Discussion EGU 100 200 300 400 500 600 700 Maunder Minimum Present day Difference 10 15 20 25 30 35 40 45 -80 -60 -40 -20 0 20 40 60 80 latitude 10B e dep osition flux (a toms/m 2/s) D ep osition change (%) 8%
Fig. 7. 10Be zonal mean deposition flux during Maunder Minimum and Present Day, and the change in absolute (atoms/m2/s, upper panel) and in relative (%, lower panel) units. The zonal mean deposition change is 32±8%. Polewards of 80◦
the relative difference is higher than this because the deposition fluxes are extremely low in these areas (see upper panel).
ACPD
7, 15341–15372, 2007 10
BE,7BE modeled in ice cores
U. Heikkil ¨a et al.
Title Page Abstract Introduction Conclusions References Tables Figures ◭ ◮ ◭ ◮ Back Close
Full Screen / Esc
Printer-friendly Version Interactive Discussion
EGU
Change in 10Be deposition: Greenland
absolute difference (atoms/m2/s) relative difference (%)
200 150 100 50 25 0 -50 -70 -60 -50 -40 -30 -20 -10 -70 -60 -50 -40 -30 -20 -10 84 80 76 72 68 64 Milcent Dye3
Fig. 8. The change of modeled10Be deposition between Maunder Minimum and Present Day in Greenland in absolute (atoms/m2/s, left) and relative (%, right) units.
ACPD
7, 15341–15372, 2007 10
BE,7BE modeled in ice cores
U. Heikkil ¨a et al.
Title Page Abstract Introduction Conclusions References Tables Figures ◭ ◮ ◭ ◮ Back Close
Full Screen / Esc
Printer-friendly Version Interactive Discussion
EGU
Change in 10Be deposition: Antarctic
absolute difference (atoms/m2/s) relative difference (%)
200 150 100 50 25 0 -50 South pole Dome Concordia
Fig. 9. The change of modeled10Be deposition between Maunder Minimum and Present Day in Antarctica in absolute (left) and relative (right) units.
ACPD
7, 15341–15372, 2007 10
BE,7BE modeled in ice cores
U. Heikkil ¨a et al.
Title Page Abstract Introduction Conclusions References Tables Figures ◭ ◮ ◭ ◮ Back Close
Full Screen / Esc
Printer-friendly Version Interactive Discussion EGU 0 5 10 15 20 -80 -60 -40 -20 0 20 40 60 80 DJF MAM JJA SON latitude 10B e/ 7B e change (%) 0.9 1 1.1 1.2 1.3 1.4 1.5 0.9 1 1.1 1.2 1.3 1.4 -60 -30 0 30 60 latitude latitude -60 -30 0 30 60 10B e/ 7B e DJF MAM JJA SON
Fig. 10. The seasonal10Be/7Be ratio of the deposition fluxes (Maunder Minimum: dashed line, Present day: full line), and the difference between Maunder Minimum and Present day in %.