HAL Id: hal-03174292
https://hal.archives-ouvertes.fr/hal-03174292
Submitted on 19 Mar 2021
HAL is a multi-disciplinary open access
archive for the deposit and dissemination of
sci-entific research documents, whether they are
pub-lished or not. The documents may come from
teaching and research institutions in France or
abroad, or from public or private research centers.
L’archive ouverte pluridisciplinaire HAL, est
destinée au dépôt et à la diffusion de documents
scientifiques de niveau recherche, publiés ou non,
émanant des établissements d’enseignement et de
recherche français ou étrangers, des laboratoires
publics ou privés.
Layer Segregation
A. Farah, Evelyn Freney, F. Canonaco, A. Prévôt, J-m. Pichon, M. Abboud,
W. Farah, K. Sellegri
To cite this version:
A. Farah, Evelyn Freney, F. Canonaco, A. Prévôt, J-m. Pichon, et al.. Altitude Aerosol Measurements
in Central France: Seasonality, Sources and Free-Troposphere/Boundary Layer Segregation. Earth
and Space Science, American Geophysical Union/Wiley, 2021, 8 (3), �10.1029/2019EA001018�.
�hal-03174292�
1. Introduction
Long-term and continuous measurements of aerosol chemical composition is essential to improve our un-derstanding of the formation and transformation of aerosol particles in the atmosphere. Thanks to the recent developments of aerosol mass spectrometry, notably with the Aerosol Chemical Speciation Monitor (ACSM, Aerodyne; Fröhlich et al., 2013; Ng et al., 2011), this information can be acquired over long periods of time with minimal intervention from the user. The ACSM is a robust tool that measures aerosol chemical properties of the aerosol with time resolutions ranging from 10 to 30 min. Global long-term ACSM data sets have recently been presented in the literature, including a 6-year study near Paris (France; Petit et al., 2015; Zhang et al., 2019), a 2-year study in the megacity of Beijing (China; Sun et al., 2018), and a 5-year study from Leipzig (Germany; Poulain et al., 2020). The measurements within Europe are mostly being performed within the framework of the ACTRIS infrastructure (Aerosols, Clouds, and Trace gases Research InfraStruc-ture), and a growing database of these measurements is available via the EBAS database (http://ebas.nilu. no/). Pluri-annuel and multi seasonal studies provide an opportunity to study how aerosol particles concen-trations and chemical signature evolves over time in response to different airmass sources and atmospheric changes. This information is useful for understanding transport and aging patterns and can also be used for the validation of atmospheric models.
Similar to worldwide measurements at low altitudes (Jimenez et al., 2009; Zhang et al., 2007), organic spe-cies also dominate the PM1 mass concentrations at high altitudes (Zhou et al., 2019). Fröhlich et al. (2015) at the Jungfraujoch station (JFJ, 3,580 m a.s.l), showed that organics were the dominant species, making
Abstract
The chemical composition of nonrefractory submicron aerosol particles was measured at the Puy-de-Dôme (PUY) station (1,465 m a.s.l) during 2015 using a Time-of-Flight Aerosol Chemical Speciation Monitor (ToF-ACSM). These aerosol chemistry measurements are combined with online black carbon (BC) measurements to provide an overview of the submicron aerosol composition. Averaged over the entire year, and normalized to standard temperature and pressure, organic aerosol (OA) dominates the PM1 concentration during all seasons and within all air mass types (2.12 ± 1.73 µgm−3), and is responsiblefor summertime increases in aerosol concentration. Highest mass concentrations were measured during the summer, when air masses were arriving over mainland Europe and lowest in the winter months (when most air masses were of Atlantic origin). OA source apportionment was performed separately during each season, using the Source Finder (SoFi) interface for the multilinear engine. The PUY site, situated at 1,465 m a.s.l, although mainly sampling in the atmospheric boundary layer, it is sometimes sampling in the lower free troposphere (FT), providing the opportunity to identify the characteristics of FT aerosol. In order to accurately identify these sampling periods, the methodology described in Farah et al. (2018), during the same time period (2015/2016), was applied to the data. During this period, FT air masses are sampled approximately 20% of the time. This work provides, on one hand, a description of long-term aerosol chemical properties at a remote regional site in central Europe and, on the other hand a characteristic chemical signature of FT aerosols over this region. This data can be used to improve our understanding of the transport and aging properties of aerosols at regional observation sites.
© 2021. The Authors.
This is an open access article under the terms of the Creative Commons Attribution NonCommercial License, which permits use, distribution and reproduction in any medium, provided the original work is properly cited and is not used for commercial purposes.
Layer Segregation
A. Farah1,2 , E. Freney1,2 , F. Canonaco3 , A. S. H. Prévôt3 , J-M. Pichon1, M. Abboud4, W. Farah4, and K. Sellegri1
1Laboratoire de Météorologie Physique, UMR6016, Université Clermont Auvergne-CNRS, Aubière, France, 2Ecole
Nationale Supérieure des Mines de Douai, Département Sciences de l’Atmosphère et Génie de l’Environnement, Douai, France, 3Laboratory of Atmospheric Chemistry, Paul Scherrer Institute, Villigen, Switzerland, 4Unité de Recherche
EGFEM, Faculté des Sciences, Université Saint Joseph, Beyrouth, Liban
Key Points:
• Statistical analysis of one year of aerosol chemical data at the Puy-de-Dome research station
• Evidence of biomass burning injections into free troposphere (FT) during spring seasons
• Chemical signature of FT aerosol particles identified
Supporting Information:
• Supporting Information S1 • Supporting Information S2
Correspondence to:
A. Farah and E. Freney,
antoine.farah@imt-lille-douai.fr;
evelyn.freney@uca.fr
Citation:
Farah, A., Freney, E., Canonaco, F., Prévôt, A. S. H., Pichon, J.-M., Abboud, M., et al. (2021). Altitude aerosol measurements in central France: Seasonality, sources and free-troposphere/boundary layer segregation. Earth and Space Science,
8, e2019EA001018. https://doi. org/10.1029/2019EA001018
Received 31 JAN 2020 Accepted 24 DEC 2020
up 73%–81% of the submicron fraction over all seasons and all air mass sources. As expected, the organic fraction was mainly OOA that can partly be linked to long range transport of air masses and partly to the vertical mixing of air masses up to JFJ. Ripoll et al. (2015) at Montsec (MSC, 1,570 m a.s.l), also measured a dominance (50%) of organic species over the year 2011–2012, confirming the importance of the OOA for-mation processes at remote sites. Minguillón et al. (2015) at Montseny (MSY, 720 m a.s.l), show that the OA was the major component of submicron aerosol (53% of PM1) over the seasons, with a higher contribution in summer (58%) than in winter (45%). Also, the substantial measurements performed as part of the ATOM field campaign illustrated that the OA contributed on average 40% to the total PM1, and that this OA was largely of secondary nature (already well oxidized; Hodzic et al., 2020). During these studies the second most dominant chemical species measured in the aerosol population was sulfate aerosol. However, as stat-ed in these studies, the sources and processes involvstat-ed in the SOA formation, is still not very clear. Ciarelli et al. (2017), using the CAMx model (Comprehensive Air Quality Model with extensions), compared the simulated chemical composition of aerosols against those of Aerosol Mass Spectrometry (AMS) measure-ments performed at 11 sites in Europe. Both model and observations suggest that OA was mainly composed of SOA, but the model underestimates the SOA formation suggesting that a more detailed characterization is needed. Similar observations were reported by Hodzic et al. (2020) basing the model comparison on air-borne AMS measurements. For these reasons, OA measurements and analysis are required to better under-stand the chemical evolution in the atmosphere, and even more so at high altitudes where this difference between model and observation is important.
The Puy-de-Dôme (PUY) is located in central France, and is one of few atmospheric stations that is exposed to both clean marine and anthropogenic-influenced continental airmasses. In addition, due to its altitude and the regional geography, the site is occasionally found in the FT. Aerosol particles in the FT tend to have longer life times, are subject to long range transport, and increased interaction with atmospheric water va-por, making it important to characterize their chemical and physical properties (Laj & Sellegri, 2003). High altitude sites potentially give access to the composition of both the BL and the FT, but aerosol properties reported from these sites are usually the result of a mixture of both layers with unknown contribution from each of them. Several studies have applied numerous methodologies to successfully identify FT air mass-es at altitude sitmass-es (Farah et al., 2018; Freney et al., 2016; Frohlich et al., 2015; Rinaldi et al., 2015; Zhou et al., 2019). For the PUY site, Farah et al. (2018) describes a methodology using a combination of different in-situ variables with the ECMWF model and remote sensing techniques. This methodology was applied to segregate between BL and FT air masses at the PUY site over the year 2015, and used to provide a detailed characterization of aerosol physical properties and their variability in each of these two atmospheric layers. In the present study, we focused on a Time-of-Flight (ToF)-ACSM data set available from April 01, 2015 to February 29, 2016 collected at PUY. Combining this data together with the FT/BL segregation identified over the same period in Farah et al. (2018), we discuss aerosol mass concentration, and variability at a mountain top site in central Europe and identify specific FT aerosol chemical signatures.
This manuscript is organized in four separate sections. After describing the sampling site and different methods used to obtain our results, we discuss the aerosol chemical properties at the PUY in the results section. This discussion is separated into a number of subsections. Initially, an overview of aerosol chem-ical properties at the site is provided. This is followed by a discussion of how these properties fluctuate as a function of season and airmass type. In the last part of the discussion we specifically investigate aerosol properties during FT sampling periods.
2. Methods
2.1. Sampling Site
The atmospheric site of the PUY is located in the center of France (45°77 N; 2°96 E, 1,465 m a.s.l). Labe-led Global Atmospheric Watch (GAW) station in 2015, the PUY is part of the European program ACTRIS (Aerosol, Cloud and Trace gases Research Infrastructure Network), with a complete and continuous anal-ysis of atmospheric constituents with climatic relevance (reactive trace gases and particulate phase; Baray et al., 2020). The PUY station is located on the first mountain range encountered by a dominant west wind
and is one of the highest peaks of the Chaîne des Puy extending over 45 km north-south and only 3–4 km of width. About 11 km east of the PUY station, a second site is located at the university campus Cézeaux (CZ, 420 m) mainly consisting of remote sensing instruments. Studies have shown that the PUY station is generally representative of regional atmospheric conditions (Asmi et al., 2011; Henne et al., 2010).
In order to better analyze each of the properties defining the aerosol, numerous instruments are used at the PUY site. In this study, we focused on data collected from a ToF-ACSM for aerosol particle chemical compo-sition, Multi Angle Absorption Photometer (MAAP 5012) at a wavelength of 637 nm for Black carbon (BC) measurements and scanning mobility particle sizer (SMPS) coupled with a condensation particle counter (CPC), for size segregated aerosol number concentration. Full details of aerosol physical properties are in-cluded in Farah et al. (2018). All aerosol mass concentrations are reported in standard ambient temperature and pressure (T = 25°C and P = 101 kPa). Meteorological parameters such as wind direction, wind speed, relatively humidity (RH), pressure, and temperature are also measured continuously throughout the year on the PUY site.
2.2. Scanning Mobility Particle Sizer
The SMPS measures the particle size distribution having electrical mobility diameters ranging between 10 and 650 nm. For these measurements, the SMPS was operated with a 63Ni source, a differential mobility analyzer (DMA) (Villani et al., 2007) and a CPC (TSI, 3010). The CPC counting efficiency and the particle charge distribution (Wiedensohler, 1988) are taken into account in the inversion of the data. Uncertainties in the measurements can be assimilated to the ±10% uncertainty range between instruments and compared to the total particle number concentrations as reported by Wiedensohler et al. (2012).
2.3. MAAP 5012
BC measurements were made using a MAAP 5012 with a central wavelength at 670 nm. This instrument measures the transmitted and scattered radiation by the impacted particles on a filter (Petzold & Schön-linner, 2004). The absorption coefficient (σabs) can be calculated from the equivalent black carbon mass
concentration (mEBC) and a specific absorption coefficient (QEBC = 6.6 m2g−1; according to Equation. 4 in
Müller et al. (2011)). In addition, since the wavelength of the instrument given by the manufacturer is not exactly that emitted (637 nm instead of 670 nm), it is necessary to add a corrective factor to the measure-ments (1.05 according to Müller et al. (2011)).
The MAAP is operated behind a whole air inlet (WAI, 50% cut-off size of 30 µm), in which the aerosol is dried due to the temperature difference between external and internal conditions. This allows, even in pres-ence of a cloud, to sample the whole aerosol size distribution.
2.4. Time-of-Flight Aerosol Chemical Speciation Monitor (ToF- ACSM)
The ToF-ACSM (Aerodyne Inc., Billerica, MA, USA), used in this study is operated with the standard PM1 inlet and vaporizer, providing information of the submicron nonrefractory fraction of the aerosol popu-lation (NR-PM1). The instrument is described in detail in Fröhlich et al. (2013). Like the Q-ACSM (Ng et al., 2010), the TOF-ACSM has the same Aerodyne AMS technology but with a compact design, and rela-tively low cost. TOF-ACSM compared to the Quad-ACSM has the added advantage of a low detection limit and high mass resolution providing a m/z range up to 300 a.m.u. The resolved mass concentrations include organic (Org), nitrate (NO3), sulfate (SO4), ammonium (NH4) and chloride (Cl). At the PUY, Cl has low
con-centrations that are close to the detection limit of the instrument (max 0.06 µgm−3) and hence are omitted
in the following discussion.
The ToF-ACSM instrument was calibrated on two separate occasions over the course of this sampling cam-paign. The response factor of the NO3 varied between 186 and 200, the RIE NH4 was 3.5 and 3.12, and the
In order to correct the ToF-ACSM data for particle losses due to nonspherical particles or as a result of parti-cle bounce off the vaporizer, we applied a composition-dependent collection efficiency (CDCE) factor to all aerosol species as defined by Middlebrook et al. (2012). Similar to other aerosol mass spectrometry studies at the site (Freney et al., 2011, 2016), the ammonium nitrate mass fraction (ANMF) was always less than 0.4, and therefore a constant CE of 0.5 was applied to the data. Once this factor was applied, the ToF-ACSM mass concentrations were converted to volume concentrations using densities of 1.75 g cm−3 for inorganic
species (Lide, 1991), 1.2 g cm−3 for organic species (Turpin & Lim, 2001), and 1.77 g cm−3 for BC (Park et al.,
2004). The ToF-ACSM + BC volume concentration was compared with the volume concentration measured by the SMPS giving an agreement of: r2 = 0.87 and slope = 0.97 (Figure S1). This good agreement illustrates
that the majority of the submicron mass concentrations can be explained by the nonrefractory chemical composition measured by the ToF-ACSM.
2.5. Positive Matrix Factorization (PMF)
Positive Matrix Factorization (PMF) (Paatero, 1997; Paatero & Tapper, 1994) is a well-established receptor model used in the determination of the source apportionment of atmospheric pollutants when the source profiles are poorly known. PMF is a multivariate factor analysis algorithm that decomposes a matrix of measured data into two matrices in the bilinear case: factor contributions (Time series) and factor pro-files (Mass spectra). In this study PMF algorithm was solved using the Multilinear Engine (ME-2), and the Source Finder toolkit (SoFi v.6.395; Canonaco et al., 2013) was used to configure the PMF model and for post analysis. The SoFi was used to facilitate the testing of different rotational techniques available within the ME-2 engine by providing a priori factor profiles for some or all of the expected factors. For ME-2 solver, the entries in the time series and the factor profiles are fit using a least squares algorithm that iteratively minimizes the quantity Q, defined as the sum of the squared residuals of the model.
Q is normalized by the degree of freedom of the model solution (Qexp), then this normalization is used as an indicator for the solution reliability. In case of known factors, a reference factor profiles could be imposed, as constraints, on the factor solution as inputs using the so-called a-value approach. This approach deter-mines the extent to which the output profile can differ from the profile fed to the model. The user can apply an a-value ranging from 0 (tightly constrained) up to 1 (almost unconstrained) to those constraints. In order to characterize the organic aerosol fraction collected at PUY, and to describe how the sources vary with the season, ME-2 analysis was performed separately for all seasons. Seasonal PMF was previously performed in the literature and provides more accurate results than PMF over a full year period (Fröhlich et al., 2015; Minguillón et al., 2015; Tiitta et al., 2014). ME-2 input matrices with an m/z range of 12–100 were prepared. Higher m/z channels were removed due to low signal to noise ratios. Errors were calcu-lated using the Poisson statistics method and electronic noise was determined in accordance with Allan et al. (2003). Peaks calculated from m/z 44 were considered in the ME-2 analysis but their uncertainties were adjusted according to the recommendations of Ulbrich et al. (2009) to avoid overweighting.
ME-2 was first applied without constraints (Figure S2), with solutions for 2–4 factors being evaluated. Two factors identified as hydrocarbon-like organic aerosol (HOA) and secondary oxygenated OA (OOA) were retrieved for all datasets. When the number of factors is increased, another HOA factor appears, and re-mains in the unconstrained runs from 3 to 4 (Figure S2). Since a fraction of HOA was identified by the ME-2 without constraints at the PUY station, a high resolution mass spectra for HOA profile from Crippa et al. (2013) was used to constrain the PMF solution. The Crippa et al. (2013) profile was identified during the MEGAPOLI field campaign in Paris and is thought to represent European HOA emissions.
2.6. Air Mass Back-Trajectories
The influence of air mass history on the occurrence of aerosol particles at the PUY site was studied using four day (96 h) air mass back trajectories computed with the NOAA Hybrid Single Particle Lagrangian Trajectory (HYSPLIT) model (Draxler & Rolph, 2003) at ending (longitude, latitude) coordinates of (45.77, 2.96), as well as an ending altitude of 1,465 m above sea level (a.s.l.). Back-trajectories were calculated every
three hours from April 1, 2015 to February 29, 2016 with a 2° × 2° reso-lution. Air masses were classified according to the maximum time spent in each sector as continental (CONT), Atlantic (Atl), northerly (North), local (LOC) and Mediterranean (MED) (Figure S3). The local area rep-resents an area with a radius of 200 km around the PUY station. The occurrence of air mass types as a function of season is listed in Table 1. In addition to the HYSPLIT analysis, a three-dimensional kinematic tra-jectory code, LACYTRAJ (Clain et al., 2010) was used to determine the time air mass back trajectories spent in the FT or in the BL prior to be-ing sampled. This involved extractbe-ing the altitude of each trajectory, and comparing it with the calculated height of the BL determined from the re-analysis of ECMWF ERA-Interim. The LACYTRAJ code performed this calculation along all trajectory points in order to estimate the time spent of the sampled air mass in the FT, and the time since last contact with the BL. The details of this analysis for the same sampling period at the PUY are provided in Farah et al. (2018).
2.7. FT/BL Air Mass Segregation
For the same analysis period (2015/2016), Farah et al. (2018) described a method to segregate FT/BL air masses using a combination of different parameters measured at the PUY site. This same classification identifying FT air masses versus BL air mass periods was applied to the sampled aerosol chemistry. This classification included a combination of four different techniques to determine when the PUY station is sampling in the BL or in the FT: (1) Wavelet covariance transform (WCT; Baars et al., 2008; Brooks, 2003; Cohn & Angevine, 2000) as an algorithm from LIDAR measurements, (2) radon-222 (222Rn) concentrations
as tracer of the BL (Chevillard et al., 2002; Griffiths et al., 2014; Herrmann et al., 2015), (3) the ratio NOx/ CO as a tracer of the age of air masses (Herrmann et al., 2015; Pandey Deolal et al., 2013; Zanis et al., 2007; Zellweger et al., 2003) and (4) reanalysis ERA-Interim of the ECMWF model (Venzac et al., 2009; von Engeln & Teixeira, 2013).
The WCT technique assumes that the BL contains more aerosol particles than the FT so that a strong de-crease of the backscatter signal is observable at the top of the BL. As a result of the difficulty in treating the WCT data during cloudy periods, only measurements during clear sky periods are included here.
222Rn is naturally emitted from the land surface (Szegvary et al., 2007; K. Zhang et al., 2011) and has also
been used for the estimation of local to regional surface emissions of trace gases (van der Laan et al., 2014). Hence, the lower the value of 222Rn, the less significant the BL influence. A threshold 222Rn value of 0.5
Bqm−3 (as proposed by Farah et al. (2018)) was chosen, and measurements lower than this concentration
were categorized as those belonging to FT air masses. The 222Rn was measured through the alpha
radioac-tive decay of aerosol particles deposited on a cellulose detector. The method is based on the measurement of
222Rn short-lived daughters (218Po, 214Bi, 214Po) (Polian et al., 1986) which are quickly absorbed onto aerosol
particles. The uncertainties associated with these measurements are between 10% and 20%.
The NOy/CO ratio is a common indicator of the “photochemical age” of an air mass, with ratios of 0.1 to 0.16 close to anthropogenic sources, ratios of <0.01 after a few days of transport (Jaegle et al., 1998; Stohl et al., 2002) and ratios of 0.002 to 0.005 for free tropospheric conditions (Zellweger et al., 2003). NOy is defined as the sum of NOx and its atmospheric oxidation products, abbreviated NOz. During the period of this study we did not have sufficient coverage of NOy measurements and we therefore chose to use NOx measurements that span a larger time period. A threshold NOx/CO ratio of 0.005 (as proposed by Farah et al. (2018)) was chosen, above which the PUY station is considered to be sampling FT air masses. The CO is measured using the Thermo Scientific™ Model 48i-TLE CO analyzer, calculating the absorption of CO at a wavelength of 4.6 microns. The NOx was measured using the ozone chemiluminescence technology with the Thermo Scientific™ Model 42i-TL TRACE Level NOx Analyzer.
Contribution (%)
Spring
(2015) Summer (2015) Autumn (2015) Winter (2016)
728 736 736 480 Mediterranean 27% (198) 27% (197) 50% (370) 24% (117) Atlantic 39% (287) 43% (317) 23% (172) 55% (263) Continental 17% (121) 10% (70) 15% (110) 11% (53) Local 6% (45) 6% (42) 8% (55) 5% (25) Northerly 11% (77) 15% (110) 4% (29) 5% (22)
Note. The number of corresponding points is included in parenthesis.
Table 1
Total Contribution of Each Air Mass Type Frequency of Occurrence During Each Season
The reanalysis ERA-Interim is based on the influence of mixing generated by wind shear and surface heat-ing (Troen & Mahrt, 1986). BLH was extracted for the latitude and longitude of the PUY with a resolution of 0.25° × 0.25°.
As all four parameters may have their own bias, a combined classification of these four parameters is pro-posed in order to determine if the PUY site is in the FT/BL. Using this method, the PUY site is observed to sample in the FT on average 20% of the time throughout the year; with highest FT measurement periods identified during the winter (over 25%), and lowest during the summer (below 17%). The diurnal variations of FT periods show that the PUY is in the FT mostly during the early hours of the morning. These variations are illustrated in Figure 6 of Farah et al., (2018).
3. Results
3.1. Time Series and Average Mass Concentrations
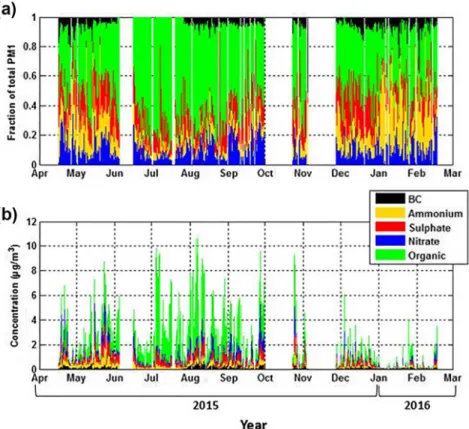
Averaged over the entire year, the most abundant aerosol chemical component was organic 57% (2 µg m−3),
followed by sulfate 16% (0.4 µg m−3), nitrate 12% (0.3 µg m−3), ammonium 10% (0.24 µg m−3), and then BC
5% (0.13 µg m−3) (Figure 1).
In order to verify that the measured SO4 and NO3 mass concentrations were from (NH4)2SO4 or (NH4NO3),
the measured NH4 concentrations (NH4 meas) are compared with the NH4 concentrations predicted (NH4 pred) if neutralization of sulfate and nitrate anions was complete. When plotting NH4meas versus NH4pred, we
obtained a slope of 0.91 (Figure S5), illustrating that the majority of the inorganic species measured at the PUY site are in the form of (NH4)2SO4 or (NH4NO3).
Figure 1. (a) Time series of relative organic (green), sulfate (red), nitrate (blue), and ammonium (orange) contributions to the total PM1 aerosol measured by the ToF-ACSM and the BC (black) concentration time series measured by the MAAP from April 2015 to February 2016. (b) Same as (a) in absolute concentrations (μgm−3). MAAP,
3.2. Seasonal Variations
Averaged absolute concentrations of all species were 4.0 µg m−3 ± (1σ) 2.5 µg m−3 during summer. In
spring, autumn, and winter mass concentrations were 2.1 µg m−3 ± (1σ) 1.3 µg m−3, 1.1 µg m−3 ± (1σ)
0.8 µg m−3 and 0.5 µg m−3 ± (1σ) 0.4 µg m−3, respectively. Shorter term studies have highlighted the high
mass concentrations at the PUY during the summer months. During this time air masses arrived 50% of the time from the Atlantic sector and 15% of the time from the northerly sector (higher than during other seasons) (Table 1). These high summertime mass concentrations can, in part, be a result of an advection of anthropogenically influenced air masses, but also from the formation of secondary aerosol resulting from the increased photochemistry during summer months. Compared with previous short term measurements made at the site using a C-ToF-AMS (Summer 27 µg m−3, Autumn, 7.5 µg m−3, Winter 5.38 µg m−3; Freney
et al., 2011), these concentrations were an almost an order of magnitude lower but are slightly higher than studies performed at the JFJ station which reported average nonrefractory submicron aerosols (NR-PM1) concentrations of 2.5 μgm−3 in summer (Cozic et al., 2008; Fröhlich et al., 2015), 1.6 μgm−3 in spring (Lanz
et al., 2010), and 0.4 μgm−3 in Winter (Fröhlich et al., 2015). It is important to note that measurements made
during previous studies at the site represent a short 2-week sampling period during each season and are less representative of the average seasonal concentrations than this long-term study. The large differences in concentrations at the PUY site during the summer months can be explained by the variability in air masses advecting the site. During summer 2010, air masses were transported across continental Europe, having spent long periods over land, compared to this current work, where summer time air masses had spent the majority of time over the Atlantic sector, resulting in lower aerosol mass concentrations.
Although the organic aerosol (OA) dominated the PM1 chemical components, its contribution varied with season, ranging from 42% in spring up to 74% in summer (Figure 2). The dominance of organic species in the total PM1 mass is widely reported in the literature (Q. Zhang et al., 2007), especially during warm months (Fröhlich et al., 2015; Lanz et al., 2010). We will discuss these sources and variations of the OA in detail in Section 3.2.1. The second most dominant aerosol type at the PUY site is sulfate particles contrib-uting 22% (0.42 μgm−3), 10% (0.45 μgm−3), 25% (0.27 μgm−3) and 8% (0.02 μgm−3) to the total mass
concen-trations for spring, summer, autumn and winter, respectively. The sources of sulfate are varied, with the majority being formed from anthropogenic emissions of SO2 that is neutralized by NH4. However, other
known sources of sulfate are from marine emissions but the ability to identify tracers for these species is difficult (Chen et al., 2019). Given that the aerosol measured at the PUY is fully neutralized (Figure S5) when assuming that all the SO4 is (NH4)2SO4, and that it is unlikely to have strong marine signatures
(e.g. methanesulfonic acid) or organosulfates, and we therefore did not explore this any further. Nitrate contributed 10% (0.2 μgm−3), 6% (0.3 μgm−3), 8% (0.02 μgm−3) and 8% (0.02 μgm−3) for spring, summer,
autumn and winter. Nitrate over Europe is principally NH4NO3, but organonitrates have also been
identi-fied to contribute to the measured nitrate at European sites (Kiendler-Scharr et al., 2016). Kiendler-Scharr et al. (2016) illustrated that at the PUY site, using a C-ToF-AMS, that the contribution of organonitrates to be approximately 10% of the total organic aerosol. Currently, there is no methodology to accurately deter-mine the presence of organonitrates in the ACSM instrument. Ammonium contributed 18% (0.3 μgm−3),
5% (0.2 μgm−3), 11% (0.11 μgm−3) and 24% (0.07 μgm−3) during spring, summer, autumn and winter,
respectively. The last contributor to the PM1 aerosol mass was BC, having similar contributions during all seasons (8% (0.12 μgm−3), 4% (0.19 μgm−3), 7% (0.08 μgm−3) and 6% (0.02 μgm−3) for spring, summer,
autumn and winter respectively).
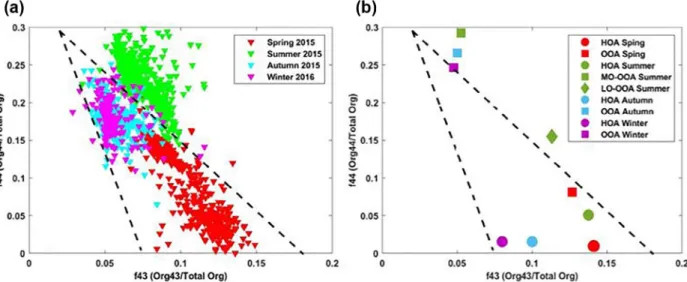
In order to extract additional information from the organic aerosol, we initially investigated the two most prominent peaks used to identify the level of oxidation of the organic aerosol, m/z 44 (CO2+) and m/z 43
(mostly C2H3O+). The commonly used triangular space (Ng et al., 2010) in which organic aerosol particles
are progressively more aged when one moves toward the highest point of the triangle is a useful means to visual the entire organic aerosol over the year (Figure 3a). Several studies have suggested that certain SOA types are located in different regions of this triangular space. The most oxidized and aged OA is often lo-cated at the top of this triangle with highest f44 and lowest f43, whereas primary OA is located to the bottom right of the triangle with high f43 and low f44. Some studies also suggest that biogenic OA may be located to the right of this graph with high f43 and f44 (Asmi et al., 2010; Freney et al, 2010; Jimenez et al., 2009), where-as those from biomwhere-ass burning emissions are more likely to be situated on the upper left side of the triangle
Figure 2. Pie charts and boxplots (in μgm−3; line: median; box: interquartile range; whiskers: 10–90th percentile
range) separated by seasons: (a) spring (2015), (b) summer (2015), (c) autumn (2015) and (d) winter (2016), for species measured with the ACSM (ammonium: orange; sulfate: red; nitrate: blue; HOA: gray; MO-OOA: dark green; and LO-OOA: light green) and BC: black derived from MAAP. ACSM, Aerosol Chemical Speciation Monitor; HOA, Hydrocarbon-like organic aerosol; LO-OOA, less oxidized OOA; MAAP, Multi Angle Absorption Photometer.
Figure 3. Plot of the fraction of Org44 to total Organics (f44) against the fraction of Org43 to the total organics (f43) for (a) each season, and (b) for the different
OOA factors. Each triangular point represents data averaged over a 180-min period. The black dotted lines show the boundaries set by Ng et al. (2010). OOA, oxidized organic aerosol.
(Heringa et al., 2011). The comparison of this m/z between instruments is difficult since the variability of the m/z 44 signal in the ACSM instruments can be high (Crenn et al., 2015), and this m/z 44 is subject to artifacts which can result in an overestimation in the total m/z 44 (Freney et al., 2019; Pieber et al., 2016). For information, the ToF-ACSM instrument used in this study had an m/z 44 artifact that represented <5% of the NO3. (Freney et al., 2019; Pieber et al., 2016). In our study, summer OA occupied the different space
compared to those biogenically influenced OOAs in Ng et al. (2010); here summer OA had much higher f44 (∼0.22) and slightly lower f43 (0.07). This possibly indicates more oxidized and processed OA due to higher photochemical aging in summer, rather than a biogenic origin.
Only OA sampled during the spring months lie to the bottom right of the triangle. This less aged OA is related to the seasonal rise of biomass burning (BB) combined with stagnant meteorological conditions resulting in a significant increase in anthropogenic emissions from the nearby city of Clermont-Ferrand and its surroundings. During this season, it is suspected that BB aerosol can be transported to high altitudes through thermal convection. OA sampled during autumn and winter are situated on the left and middle side of the dotted lines (bounds set by Ng et al., 2010) and appear to have a similar degree of aging during autumn and winter. However, Frohlich et al. (2015) illustrated that despite the variability of the m/z 44 among instruments, this did not influence the final PMF segregation.
A PMF/ME-2 analysis of the total organic aerosol mass spectra matrix resulted in a two or three factor solu-tion depending on the season. During all seasons, a primary and secondary organic aerosol was identified, having mass spectral profiles similar to reference mass spectra of Hydrocarbon-like organic aerosol (HOA) and oxidized organic aerosol (OOA) respectively (Table S3). During the summer an additional oxidized OA factor was identified (OOA was separated into a more oxidized oxygenated organic aerosol particle (MO-OOA) and a less oxidized OOA (LO-(MO-OOA)) (Figures S6 and S7). A biomass-burning-related OA (BBOA) was identified in spring when the fractional signal of its most specific fragment peak at m/z 60 was above the threshold level of 0.3% (Cubison et al., 2011) (Figure S8). Increasing the number of factors from a two to a three-factor solution for autumn and winter, and from three to four factor solution for spring, summer, did not result in improvements in residuals or in the correlations with external species (Figure S9). Once the principal factors, (HOA, BBOA, OOA) were identified without constraining the analysis, a subsequent analysis was performed where reference HOA mass spectra (ambient HOA from Paris; Crippa et al., 2013) were used to constrain the PMF solution. These mass spectra were constrained with “a values” ranging from 0 to 0.6 (with ∆a step of 0.1). Solutions containing an a-value of 0.3 were selected for all seasons, which was a compromise between a higher r2 correlation coefficient between HOA and BC and the physically
meaningful profiles of the whole solution (i.e. resulting from an assessment of the profiles of the MO-OOA and LO-OOA factors). Hence, for an “a value” below 0.3, HOA and BC were not well correlated and for an “a value” above 0.3, HOA and OOA factors were mixed and OOA factors were not well resolved. No other constraints were applied to this data set.
In the summer season, the first identified factor of organic aerosol had a similar mass spectral signature to the OOA averaged profile reported by Ng et al. (2011). The mass spectral properties of this OOA are defined by having a dominant peak at m/z 18, 28 and 44, which underlined the low volatility and high level of oxidation characteristic of aged particles. They are therefore termed MO-OOA. The second type of organic aerosol closely resembled a less oxidized organic aerosol (lower f44). The less oxidized organic aerosol par-ticle measured had dominant mass spectral peaks at m/z 43 and 44, and was similar to the mass spectra of LO-OOA (Ng et al., 2011) (Table S2).
The degree of oxidation of the MO-OOA increased from winter to summer, and similarly the summer time LO-OOA had higher f44 signals than those on the spring (Figure 3b). The differences between the LO-OOA
is likely only associated with air mass aging, as the sources of the air masses during the spring and summer seasons remained constant with highest contributions arriving from Atlantic sectors. The values of f43 for
both OOA values remained constant during each season. The seasonal variation in the identified OA factor mass spectral signatures is low (Figure S10).
The HOA contributions to OA are lower in summer and autumn (14 ± 1%) than in spring and winter (23 ± 3%). In summer, autumn, and winter, the time series of HOA showed good correlation with that
of BC (r2 = 0.49, 0.65 and 0.44, respectively), whereas the correlations are lower during spring (r2 = 0.26)
(Table S1). BBOA was only identified in spring when it contributed 24% to the total OA and when the f60
contribution is above the background threshold limit of 0.3% (Cubison et al., 2011) (Figure S9). This factor also showed weak correlation with BC (r2 of 0.24). However, the correlation of BC versus the sum of HOA
and BBOA (two distinct combustion sources), is r2 of 0.45, which suggests that the measured BC is mixed
with HOA and BBOA sources. Unfortunately, using the MAAP it is not possible to segregate BC regarding those two sources.
These results are in agreement with those at other mid-altitude European stations (Minguillón et al., 2015; Ripoll et al., 2015) who reported HOA contribution of 12 ± 2% during the warmer seasons. However, the HOA contributions at the PUY are higher than those measured at the JFJ (3% in the summer to 9% in win-ter; Fröhlich et al., 2015), which is expected considering the higher altitude of the JFJ station.
MO-OOA contributed 45% to the total OA in summer and 80 ± 5% in both autumn and winter. In summer and autumn, the time series of MO-OOA showed strongest correlations with that of BC (r2 = 0.6 and 0.57,
respectively) (Table S1), suggesting that a significant fraction of the BC arriving at the station is well-mixed with other aerosol particles. However, weak correlations between the organic (both MO-OOA and LO-OOA) and inorganic species (r2 < 0.2) throughout the summer and autumn are suggesting different
sources or sinks of the organics compared to the inorganic species. Fröhlich et al. (2015) at JFJ, identified a background MO-OOA factor in summer; that correlated well with sulfate. Ripoll et al. (2015) at Montsec and Minguillón et al. (2015) at the Montseny, identified a MO-OOA factor in summer which also repre-sents the background of OOA. During winter the MO-OOA component showed good correlations with sulfate, ammonium, and nitrate suggesting similar sources or source regions (r2 = 0.45, 0.52 and 0.56,
respectively).
LO-OOA was only identified in spring and summer, contributing 54% and 41%, respectively to the total OA. The time series of LO-OOA showed relatively good correlations with BC (r2 = 0.5) and sulfate (r2 = 0.46)
in spring, and with BC (r2 = 0.52) and nitrate (r2 = 0.36) in summer. Ripoll et al. (2015) and Minguillón
et al. (2015) also identified an LO-OOA factor during the summer months. They show that this factor is mostly attributed to fresher SOA formation and shows a low correlation with nitrate (r2 = 0.16). A full list of
all correlations of the resolved PMF solutions as a function of season is provided in Table S1.
3.3. Diurnal Variations
For both autumn and winter, strongest diurnal variabilities are observed (Figures 4e–4h) with increases in the mass concentration of all species during the day and decreases at night. This can be explained by the geography of the PUY site. As a result of its altitude, the site is either sampling in the BL or in the FT. Higher numbers of FT sampling periods occur during the nighttime of the winter and autumn seasons. As the boundary layer develops during the day time hours, aerosol concentrations, including biomass burning and other anthropogenic activities from the nearby cities, are transported to the site. This results in diurnal variations with maximum concentrations during the day. During winter months, biomass burning and oth-er atmosphoth-eric conditions results in highoth-er concentrations of anthropogenic species such as the NO3 and
HOA, however in the autumn months the contribution of these species is lower compared to that of SO4.
More details of these variations of concentrations are explained in Farah et al. (2018).
For spring and summer however, the diurnal variations are weak and concentrations of nitrate even decrease during the day compared to night (Figures 4a and 4c). A particulate nitrate formation during nighttime and depletion during daytime is principally a result of temperature effects on nitrate phase partitioning. Am-monium, sulfate, HOA and BBOA also show no diurnal variability during spring and summer. While OOA showed daytime increases during spring (Figure 4b) and both for MO-OOA and LO-OOA during summer (Figure 4d). During spring and summer, the boundary layer height diurnal variation is less pronounced than during winter and autumn, which explains the low diurnal variability of most compounds. Given that secondary organic species, especially LO-OOA increase during the daytime and that all other species (NO3,
SO4, NH4) remain constant, it is likely that the photochemical formation of secondary organic aerosol is
3.4. Air Mass Speciation
Its central location in France makes the PUY station a good receptor site for atmospheric compounds from different source regions. The NR-PM1 and BC aerosol particles composition is shown as a function of sea-son and backward trajectory calculation of air mass origin into five sectors in Figure 5. Total contributions and mean concentrations for each sector are listed in Table 1 and Table S3, respectively. The sector type segregation analysis shows that air mass types contributed differently for each season. During autumn, air masses arrived mainly from the Mediterranean sector (50%) while during the other seasons, air masses ar-rived predominantly from the Atlantic sector (39%, 43%, and 55%, in spring, summer, and winter, respective-ly). In comparison, the continental and local air masses occur less than 10% of the time (Table 1). It is noted, that this uneven distribution of air masses types among the seasons influences the seasonal variations of the different components observed in the above section.
The highest yearly mean total concentrations were measured during the summer months (5.22 ± 1.3 μgm−3)
and lowest in the winter (2.24 ± 0.50 μgm−3). Average air mass contributions throughout the year, showed
little variation (3.20 ± 0.14 μgm−3). These observations are in agreement with seasonal variations of
aer-Figure 4. Diurnal variation of mass concentration of inorganic and organic particles for Spring (a) and (b), Summer (c) and (d), Autumn (e) and (f), and Winter (g) and (h).
osol composition reported in Bourcier et al. (2012) and in Freney et al. (2011). In terms of absolute yearly concentrations of different species (Table S3), organic concentrations are highest in continental and local air masses (6.20 μgm−3 and 5.98 μgm−3, respectively) and lowest in the northerly sector (3.81 μgm−3).
Sul-fate concentrations are high in all air masses (2.00 ± 0.10 μgm−3). This could indicate a possible marine
source of sulfate in these air masses. Nitrate and ammonium are highest in the continental air masses (2.10 and 1.80 μgm−3 respectively), and lowest in the local air masses (1.10 and 1.31 μgm−3 respectively).
The highest HOA contributions were from the local sector (25% and 24%) in autumn and winter, respec-tively. These HOA contributions are likely emissions arriving from the nearby city of Clermont-Ferrand. BBOA was only identified in spring, with no significant variability across all air mass types. LO-OOA was identified in spring and summer, with highest contribution from the local sector (26%) and lowest from continental and northerly sectors (21% ± 2%). Organizing data as both a function of season and airmass type (Figure 5) suggests that the latter plays a vital role in determining aerosol composition. For example during summer, the contribution of OA to the total mass is highest in the local sector (79%), and lowest for the northerly sector (64%), but for the northerly sector during the autumn months, the OA mass fraction only contributes 34%.
Hence, even though the aerosol composition is dependent on the air mass type for a given season, for all air mass types, the same strong seasonal variation is observed with a sharp increase of organic matter and per-centage during summer compared to the other seasons. At the PUY site, these variations in season and with air mass source are highly influenced by the boundary layer dynamics. In the next section, we will segregate between BL and FT conditions, in order to better assess the seasonal variability of the aerosol composition in a given layer of the atmosphere.
3.5. FT/BL Conditions
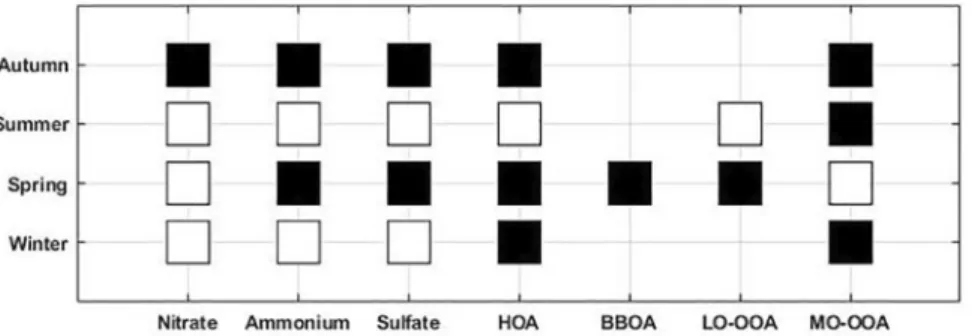
In this section, we apply the method described in Farah et al. (2018) for the classification air masses as being FT or BL using a combination of the four indicators. The Wilcoxon–Mann–Whitney test (DePuy et al., 2014) was applied to medians of each aerosol chemical component (Ammonium, nitrate and sulfate) and organic
Figure 5. Particle composition averaged over season and airmass type. Corresponding mass concentrations for each season and airmass type are listed in Table S4.
sources (HOA, LO-OOA and MO-OOA), in order to assess whether concentrations are statistically signifi-cantly different between their BL or FT conditions (Figure 6).
Figure 6 shows that the chemical composition of the nonrefractory PM1 aerosol in the FT differs from the one of the BL during autumn and spring for most compounds (except for nitrate concentrations in spring which are the same in the BL and in the FT). As expected, for inorganic species this difference between BL and FT always favor higher concentrations in the BL (Figure 7), and has been noted during previous studies (Frohlich et al., 2015; Hodzic et al., 2020).
For organic species, we also observe that concentrations are higher in the BL than in the FT for HOA and MO-OOA during winter and autumn. However during spring, the median concentrations of HOA, BBOA and LO-OOA are higher in the FT (0.41, 0.35, and 0.86 µgm−3, respectively) than in the BL (0.22, 0.16, and
0.48 µgm−3, respectively). These observations have also been observed by Crumeyrolle et al. (2013) during
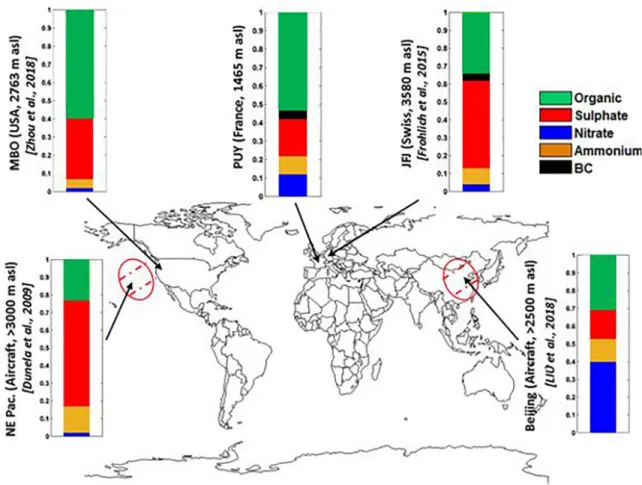
airborne measurements over central Europe and the north sea in May 2008. The latter study showed an en-hancement of the total mass concentration (mainly organic) in the altitude range between 1 and 3 km in air masses originating from south and east Europe. Farah et al. (2018) reported that at the same site, higher BC, Aitken and accumulation mode particle concentrations were observed in the FT compared to the BL dur-ing sprdur-ing, while for the other seasons concentrations were higher than or equal to the FT concentrations. These high concentrations in the FT during spring were attributed to the active transport by heat convection of particles from BL to the FT originating from open biomass burning events occurring during this season. The higher concentration of HOA in the FT compared to BL during this season agrees with this hypothesis. In order to identify a true signature for FT air masses, Farah et al. (2018) also investigated the air mass back trajectory relative to the last contact with the BL over a period of 204 h. They show that during spring and summer, around 60% of air masses sampled in the FT were in the BL 15 h before sampling which indicates that aerosol properties measured in the FT during these seasons are recently influenced by the BL than during the other seasons. In contrast, for autumn and winter, over 80% of the FT air masses did not have any contact with the BL for at least 75 h before being sampled at PUY. In this study, the NR-PM1 chemical properties during these FT periods need to be treated with caution due to the limited statistics. However, we consider that these observations provide us with a good means of identifying the chemical character-istics of true FT air masses. Similar to BL airmasses, the OA aerosols were most abundant in the FT air masses (53%, split in 10% and 43% respectively for HOA and OOA), followed by sulfate 20%, nitrate 11.5%, ammonium 10.5% and BC 5% (Figure 8). These features are similar to previous long-term ACSM studies performed worldwide in the FT at fixed sites (Dunlea et al., 2009; Fröhlich et al., 2015; Liu et al., 2018; Zhou et al., 2019), and on airborne plateformes (Hodzic et al., 2020; Figure 8). As illustrated in Zhou et al., 2019, the fractional contribution of the different chemical components is similar to that of other mid altitude stations in Europe. However, as illustrated here (Figure 8), subtle differences in the contribution of sulfate and nitrate particles are observed depending on the air mass history.
Figure 6. Wilcoxon–Mann–Whitney test applied to nitrate, ammonium, sulfate and organic (HOA, BBOA, LO-OOA and MO-OOA) concentrations measured for each season. The squares are black when the medians are significantly different from the null hypothesis with a p value of 5%. If white the medians are considered similar. BBOA, burning-related OA; HOA, Hydrocarbon-like organic aerosol; LO-OOA, less oxidized OOA; MO-OOA, more oxidized oxygenated organic aerosol; OOA, oxidized organic aerosol.
4. Conclusions
The PUY site is unique in its geographic and spatial location. It is seldom advected by local emissions and is one of few atmospheric stations that is exposed to both clean marine and anthropogenic-influenced conti-nental airmasses. Long-term observations of aerosol chemistry at this site will provide a useful database for model validation and improvement. The present study investigates one year of aerosol chemical properties using a ToF-ACSM from April 2015 to February 2016 at the PUY site. Similar to many other studies, OA represents a substantial part of the PM1 concentration during all seasons and within all air mass types. The high contribution of OA during the summer months is considered to be to be the result of a larger second-ary organic formation, as well as a higher contribution of air masses from the northerly air mass sectors.
Figure 7. FT/BL concentrations of: (a) Nitrate, (b) Ammonium, (c) Sulfate and (d) HOA, (e) MO-OOA, (f) LO-OOA, for the four seasons at the PUY site. Red line represents the median value, bottom and top sides of the boxes symbolize the 25th and 75th percentile respectively and the extremities of the black lines are the 10th and 90th percentile. BBOA, burning-related OA; HOA, Hydrocarbon-like organic aerosol; LO-OOA, less oxidized OOA; MO-OOA, more oxidized oxygenated organic aerosol; OOA, oxidized organic aerosol; PUY, Puy-de-Dôme.
Highest mean total concentrations were measured within continental air masses, while lowest concentra-tions are measured in Northerly air masses.
In addition, the PUY site is occasionally sampling FT airmasses (approximately 20%), and therefore capable of providing chemical signatures of FT aerosols over long periods of time. For the majority of the time, aer-osol mass concentrations were highest in the BL than in the FT. However, during the spring period (MAM), higher organic particle concentrations (HOA and MO-OOA) were observed in the FT compared to the BL, these increases in mass concentrations are associated with higher concentrations of Aitken and accumula-tion mode particle concentraaccumula-tions and is thought to be linked to intrusions from local biomass burning from the BL, as described in Farah et al. (2018).
This combination of in-situ measurements, back trajectory analysis and segregation between FT and BL air-masses contribute to better understanding of aerosol particles sources, properties and their dynamics in the atmosphere. In particular, we illustrated that the aerosol chemical properties at lower atmospheric layers (i.e. BL, FT) are similar to what have been found using the in-situ measurements at other European ground sites, despite variable sources, and can therefore be thought of as typical of European background aerosol.
Data Availability Statement
Data are available on EBAS through the following link http://ebas.nilu.no/Pages/DataSetList. aspx?key=F8293DBC1AAE48C3888BC7E355181187.
Figure 8. Location of selected high-altitude mountain sites of regional background aerosols in Europe and the chemical composition of NR-PM1. Bar charts show the average chemical composition of NR-PM1 in the FT. FT, free troposphere.
References
Allan, J. D., Jimenez, J. L., Williams, P. I., Alfarra, M. R., Bower, K. N., Jayne, J. T., et al. (2003). Quantitative sampling using an Aerodyne aerosol mass spectrometer—1. Techniques of data interpretation and error analysis. J. Geophys. Res.-Atmos., 108, 4090. https://doi. org/10.1029/2002JD002358
Asmi, A., Wiedensohler, A., Laj, P., Fjaeraa, A.-M., Sellegri, K., Birmili, W., et al. (2011). Number size distributions and seasonality of submi-cron particles in Europe 2008–2009. Atmospheric Chemistry and Physics, 11(11), 5505–5538. https://doi.org/10.5194/acp-11-5505-2011
Baars, H., Ansmann, A., Engelmann, R., & Althausen, D. (2008). Continuous monitoring of the boundary-layer top with lidar. Atmospheric
Chemistry and Physics, 8(23), 7281–7296. https://doi.org/10.5194/ACP-8-7281-2008
Baray, J.-L., Deguillaume, L., Colomb, A., Sellegri, K., Freney, E., Rose, C., et al. (2020). Cézeaux-Aulnat-Opme-Puy De Dôme: a multi-site for the long-term survey of the tropospheric composition and climate change. Atmospheric Measurement Techniques, 13, 3413–3445.
https://doi.org/10.5194/amt-13-3413-2020
Bourcier, L., Sellegri, K., Chausse, P., Pichon, J. M., & Laj, P. (2012). Seasonal variation of water-soluble inorganic components in aer-osol size-segregated at the puy de Dôme station (1,465 m a.s.l.), France. Journal of Atmospheric Chemistry, 69(1), 47–66. https://doi. org/10.1007/s10874-012-9229-2
Brooks, I. M. (2003). Finding boundary layer top: Application of a wavelet covariance transform to lidar backscatter profiles. Journal
of Atmospheric and Atlantic Technology, 20(8), 1092–1105. https://doi.org/10.1175/1520-0426(2003)020%3C1092:FBLTAO%3E2.0.CO;2
Canonaco, F., Crippa, M., Slowik, J. G., Baltensperger, U., & Prévôt, A. S. H. (2013). SoFi, an IGOR-based interface for the efficient use of the generalized multilinear engine (ME-2) for the source apportionment: ME-2 application to aerosol mass spectrometer data.
Atmos-pheric Measurement Techniques, 6(12), 3649–3661. https://doi.org/10.5194/amt-6-3649-2013
Chen, Y., Xu, L., Humphry, T., Hettiyadura, A. P. S., Ovadnevaite, J., Huang, S., et al. (2019). Response of the Aerodyne Aerosol Mass Spectrometer to Inorganic Sulfates and Organosulfur Compounds: Applications in Field and Laboratory Measurements. Environmental
Science & Technology, 53(9), 5176–5186. https://doi.org/10.1021/acs.est.9b00884
Chevillard, A., Ciais, P., Karstens, U., Heimann, M., Schmidt, M., Levin, I., et al. (2002). Transport of 222Rn using the regional model REMO: a detailed comparison with measurements over Europe. Tellus B: Chemical and Physical Meteorology, 54(5), 850–871. https:// doi.org/10.1034/j.1600-0889.2002.01339.x
Ciarelli, G., Aksoyoglu, S., Haddad, I., El, Bruns, E. A., Crippa, M., Poulain, L., et al. (2017). Modelling winter organic aerosol at the Euro-pean scale with CAMx: evaluation and source apportionment with a VBS parameterization based on novel wood burning smog chamber experiments. Atmospheric Chemistry and Physics, 17, 7653–7669. https://doi.org/10.5194/acp-17-7653-2017
Clain, G., Baray, J. L., Delmas, R., Keckhut, P., & Cammas, J. P. (2010). A lagrangian approach to analyse the tropospheric ozone clima-tology in the tropics: Climaclima-tology of stratosphere-troposphere exchange at Reunion Island. Atmospheric Environment, 44(7), 968–975.
https://doi.org/10.1016/j.atmosenv.2009.08.048
Cohn, S. A., & Angevine, W. M. (2000). Boundary Layer Height and Entrainment Zone Thickness Measured by Lidars and Wind-Profiling Radars. Journal of Applied Meteorology, 39(8), 1233–1247. https://doi.org/10.1175/1520-0450(2000)039<1233:BLHAEZ>2.0.CO;2
Cozic, J., Verheggen, B., Weingartner, E., Crosier, J., Bower, K. N., Flynn, M., et al. (2008). Chemical composition of free tropospheric aerosol for PM1 and coarse mode at the high alpine site Jungfraujoch. Atmospheric Chemistry and Physics, 8(2), 407–423. https://doi. org/10.5194/acp-8-407-2008
Crenn, V., Sciare, J., Croteau, P. L., Verlhac, S., Fröhlich, R., Belis, C. A., et al. (2015). ACTRIS ACSM intercomparison - Part 1: Reproduci-bility of concentration and fragment results from 13 individual Quadrupole Aerosol Chemical Speciation Monitors (Q-ACSM) and con-sistency with co-located instruments. Atmospheric Measurement Techniques, 8(12), 5063–5087. https://doi.org/10.5194/amt-8-5063-2015
Crippa, M., DeCarlo, P. F., Slowik, J. G., Mohr, C., Heringa, M. F., Chirico, R., et al. (2013a). Wintertime aerosol chemical composition and source apportionment of the organic fraction in the metropolitan area of Paris. Atmospheric Chemistry and Physics, 13(2), 961–981.
https://doi.org/10.5194/acp-13-961-2013
Crippa, M., El Haddad, I., Slowik, J. G., DeCarlo, P. F., Mohr, C., Heringa, M. F., et al. (2013b). Identification of marine and continental aer-osol sources in Paris using high resolution aeraer-osol mass spectrometry. Journal of Geophysical Research: Atmospheres, 118(4), 1950–1963.
https://doi.org/10.1002/jgrd.50151
Crumeyrolle, S., Schwarzenboeck, A., Roger, J. C., Sellegri, K., Burkhart, J. F., Stohl, A., et al. (2013). Overview of aerosol properties associ-ated with air masses sampled by the ATR-42 during the EUCAARI campaign (2008). Atmospheric Chemistry and Physics, 13, 4877–4893.
https://doi.org/10.5194/acp-13-4877-2013
Cubison, M. J., Ortega, A. M., Hayes, P. L., Farmer, D. K., Day, D., Lechner, M. J., et al. (2011). Effects of aging on organic aerosol from open biomass burning smoke in aircraft and laboratory studies. Atmospheric Chemistry and Physics, 11, 12049–12064. https://doi. org/10.5194/acp-11-12049-2011
DePuy, V., Berger, V. W., & Zhou, Y. (2014). Wilcoxon-Mann-Whitney test: Overview, Wiley StatsRef. https://doi.org/10.1002/9781118445112. stat06547
Draxler, R. R., & Rolph, G. D. (2003). HYSPLIT (HYbrid Single-Particle Lagrangian Integrated Trajectory) model access via NOAA ARL
READY website. MD: NOAA Air Resources Laboratory, Silver Spring. Retreived from http://www.arl.noaa.gov/ready/hysplit4.html
Dunlea, E. J., Decarlo, P. F., Aiken, A. C., Kimmel, J. R., Peltier, R. E., Weber, R. J., et al. (2009). Evolution of Asian aerosols during transpa-cific transport in INTEX-B. Atmospheric Chemistry and Physics, 9, 7257–7287. https://doi.org/10.5194/acp-9-7257-2009
Farah, A., Freney, E., Chauvigné, A., Baray, J.-L., Rose, C., Picard, D., et al. (2018). Seasonal Variation of Aerosol Size Distribution Data at the Puy de Dôme Station with Emphasis on the Boundary Layer/Free Troposphere Segregation. Atmosphere , 9(7), 244. https://doi. org/10.3390/ATMOS9070244
Freney, E., Sellegri, K., Asmi, E., Rose, C., Chauvigne, A., Baray, J. L., et al. (2016). Experimental evidence of the feeding of the free troposphere with aerosol particles from the mixing layer. Aerosol and Air Quality Research, 16, 702–716. https://doi.org/10.4209/ aaqr.2015.03.0164
Freney, E. J., Sellegri, K., Canonaco, F., Boulon, J., Hervo, M., Weigel, R., et al. (2011). Seasonal variations in aerosol particle composi-tion at the Puy-de-Dôme research stacomposi-tion in France. Atmospheric Chemistry and Physics, 11(24), 13047–13059. https://doi.org/10.5194/ ACP-11-13047-2011
Freney, E., Zhang, Y., Croteau, P., Amodeo, T., Williams, L., Truong, F., et al. (2019). The second ACTRIS inter-comparison (2016) for Aerosol Chemical Speciation Monitors (ACSM): Calibration protocols and instrument performance evaluations. Aerosol Science and
Technology, 53(7), 830–842. https://doi.org/10.1080/02786826.2019.1608901
Acknowledgments
The authors would like to acknowledge the staff of OPGC and LaMP for their work on the instrumentation. IN-SU-CNRS and the University Clermont Auvergne are also acknowledged for their support to the PUY station. The authors would also like to acknowledge the contribution of the COST Action CA16109 (COLOSSAL). This project has received funding from the European Union’s Horizon 2020 research and innovation program under grant agree-ment No 654109 (ACTRIS-2), and from the French program SNO-CLAP and the research council of the Saint Joseph University.
Fröhlich, R., Cubison, M. J., Slowik, J. G., Bukowiecki, N., Canonaco, F., Croteau, P. L., et al. (2015). Fourteen months of on-line measure-ments of the non-refractory submicron aerosol at the Jungfraujoch (3580 m a.s.l.)—chemical composition, origins and organic aerosol sources. Atmospheric Chemistry and Physics, 15(19), 11373–11398. https://doi.org/10.5194/acp-15-11373-2015
Fröhlich, R., Cubison, M. J., Slowik, J. G., Bukowiecki, N., Prévôt, A. S. H., Baltensperger, U., et al. (2013). The ToF-ACSM: a porta-ble aerosol chemical speciation monitor with TOFMS detection. Atmospheric Measurement Techniques, 6(11), 3225–3241. https://doi. org/10.5194/amt-6-3225-2013
Griffiths, A. D., Conen, F., Weingartner, E., Zimmermann, L., Chambers, S. D., Williams, A. G., & Steinbacher, M. (2014). Surface-to-moun-taintop transport characterized by radon observations at the Jungfraujoch. Atmospheric Chemistry and Physics, 14(23), 12763–12779.
https://doi.org/10.5194/acp-14-12763-2014
Henne, S., Brunner, D., Folini, D., Solberg, S., Klausen, J., & Buchmann, B. (2010). Assessment of parameters describing representativeness of air quality in-situ measurement sites. Atmospheric Chemistry and Physics, 10(8), 3561–3581. https://doi.org/10.5194/acp-10-3561-2010
Heringa, M. F., Decarlo, P. F., Chirico, R., Tritscher, T., Dommen, J., Weingartner, E., et al. (2011). Investigations of primary and secondary particulate matter of different wood combustion appliances with a high-resolution time-of-flight aerosol mass spectrometer.
Atmospher-ic Chemistry and PhysAtmospher-ics, 11, 5945–5957. https://doi.org/10.5194/acp-11-5945-2011
Herrmann, E., Weingartner, E., Henne, S., Vuilleumier, L., Bukowiecki, N., Steinbacher, M., et al. (2015). Analysis of long-term aerosol size distribution data from Jungfraujoch with emphasis on free tropospheric conditions, cloud influence, and air mass transport. Journal of
Geophysical Research: Atmospheres, 120(18), 2015JD023660. https://doi.org/10.1002/2015JD023660
Hodzic, A., Campuzano-Jost, P., Bian, H., Chin, M., Colarco, P. R., Day, D. A., et al. (2020). Characterization of organic aerosol across the global remote troposphere: a comparison of ATom measurements and global chemistry models. Atmospheric Chemistry and Physics, 20, 4607–4635. https://doi.org/10.5194/acp-20-4607-2020
Jaegle, L., Jacob, D. J., Wang, Y., Weinheimer, A. J., Ridley, B. A., Campos, T. L., et al. (1998). Sources and chemistry of NOx in the upper troposphere over the United States. Geophysical Research Letters, 25(10), 1705–1708.
Jimenez, J. L., Canagaratna, M. R., Donahue, N. M., Prevot, A. S. H., Zhang, Q., Kroll, J. H., et al. (2009). Evolution of organic aerosols in the atmosphere. Science, 326(5959) 1525–1529. https://doi.org/10.1126/science.1180353
Kiendler-Scharr, A., Mensah, A. A., Friese, E., Topping, D., Nemitz, E., Prevot, A. S. H., et al. (2016). Ubiquity of organic nitrates from nighttime chemistry in the European submicron aerosol. Geophysical Research Letters, 43(14), 7735–7744. https://doi. org/10.1002/2016GL069239
Laj, P., & Sellegri, K. (2003). Les aérosols atmosphéeriques: Impacts locaux, effete g lobaux. Revue Française des Laboratoires, 2003(349), 23–34. https://doi.org/10.1016/S0338-9898(03)80466-3
Lanz, V. A., Prévôt, A. S. H., Alfarra, M. R., Weimer, S., Mohr, C., DeCarlo, P. F., et al. (2010). Characterization of aerosol chemical composi-tion with aerosol mass spectrometry in Central Europe: An overview. Atmospheric Chemistry and Physics, 10(21), 10453–10471. https:// doi.org/10.5194/acp-10-10453-2010
Lide, D. R. (1991). CRC handbook of chemistry and physics. USA: CRC Press Inc.
Liu, Q., Ding, D., Huang, M., Tian, P., Zhao, D., Wang, F., et al. (2018). A study of elevated pollution layer over the North China Plain using aircraft measurements. Atmospheric Environment, 190, 188–194. https://doi.org/10.1016/j.atmosenv.2018.07.024
Middlebrook, A. M., Bahreini, R., Jimenez, J. L., & Canagaratna, M. R. (2012). Evaluation of composition-dependent collection efficiencies for the aerodyne aerosol mass spectrometer using field data. Aerosol Science and Technology, 46(3), 258–271. https://doi.org/10.1080/0 2786826.2011.620041
Minguillón, M. C., Ripoll, A., Pérez, N., Prévôt, A. S. H., Canonaco, F., Querol, X., & Alastuey, A. (2015). Chemical characterization of submicron regional background aerosols in the western Mediterranean using an aerosol chemical speciation monitor. Atmospheric
Chemistry and Physics, 15(11), 6379–6391. https://doi.org/10.5194/acp-15-6379-2015
Müller, T., Henzing, J. S., de Leeuw, G., Wiedensohler, A., Alastuey, A., Angelov, H., et al. (2011). Characterization and intercomparison of aerosol absorption photometers: result of two intercomparison workshops. Atmospheric Measurement Techniques, 4(2), 245–268.
https://doi.org/10.5194/amt-4-245-2011
Ng, N., Canagaratna, M., Jimenez, J., Zhang, Q., Ulbrich, I., & Worsnop, D. (2011). Real-time methods for estimating organic compo-nent mass concentrations from aerosol mass spectrometer data. Environmental Science & Technology, 45(3), 910–916. https://doi. org/10.1021/es102951k
Ng, N. L., Canagaratna, M. R., Zhang, Q., Jimenez, J. L., Tian, J., Ulbrich, I. M., et al. (2010). Organic aerosol components observed in Northern Hemispheric datasets from Aerosol Mass Spectrometry. Atmospheric Chemistry and Physics, 10, 4625–4641. https://doi. org/10.5194/acp-10-4625-2010
Paatero, P. (1997). Least squares formulation of robust non-negative factor analysis. Chemometrics and Intelligent Laboratory Systems,
37(1), 23–35. https://doi.org/10.1016/S0169-7439(96)00044-5
Paatero, P., & Tapper, U. (1994). Positive matrix factorization: A non-negative factor model with optimal utilization of error estimates of data values. Environmetrics, 5(2), 111–126. https://doi.org/10.1002/env.3170050203
Pandey Deolal, S., Staehelin, J., Brunner, D., Cui, J., Steinbacher, M., Zellweger, C., et al. (2013). Transport of PAN and NOy from dif-ferent source regions to the Swiss high alpine site Jungfraujoch. Atmospheric Environment, 64, 103–115. https://doi.org/10.1016/j. atmosenv.2012.08.021
Park, K., Kittel son, D. B., Zachariah, M. R., & McMurry, P. H. (2004). Measurement of inherent material density of nanoparticle agglom-erates. Nanoparticle Research, 6(2-3), 267–272.
Petit, J.-E., Favez, O., Sciare, J., Crenn, V., Sarda-Estève, R., Bonnaire, N., et al. (2015). Two years of near real-time chemical composition of submicron aerosols in the region of Paris using an Aerosol Chemical Speciation Monitor (ACSM) and a multi-wavelength Aethalometer.
Atmospheric Chemistry and Physics, 15(6), 2985–3005. https://doi.org/10.5194/acp-15-2985-2015
Petzold, A., & Schönlinner, M. (2004). Multi-angle absorption photometry—a new method for the measurement of aerosol light absorption and atmospheric black carbon. Journal of Aerosol Science, 35(4), 421–441. https://doi.org/10.1016/j.jaerosci.2003.09.005
Pieber, S. M., El Haddad, I., Slowik, J. G., Canagaratna, M. R., Jayne, J. T., Platt, S. M., et al. (2016). Inorganic Salt Interference on CO2+ in
Aerodyne AMS and ACSM Organic Aerosol Composition Studies. Environmental Science & Technology, 50(19), 10494–10503. https:// doi.org/10.1021/acs.est.6b01035
Polian, G., Lambert, G., Ardouin, B., & Jegou, A. (1986). Long-range transport of continental radon in subantarctic and Antarctic areas.