HAL Id: tel-01012081
https://tel.archives-ouvertes.fr/tel-01012081
Submitted on 25 Jun 2014
HAL is a multi-disciplinary open access
archive for the deposit and dissemination of
sci-entific research documents, whether they are
pub-lished or not. The documents may come from
teaching and research institutions in France or
abroad, or from public or private research centers.
L’archive ouverte pluridisciplinaire HAL, est
destinée au dépôt et à la diffusion de documents
scientifiques de niveau recherche, publiés ou non,
émanant des établissements d’enseignement et de
recherche français ou étrangers, des laboratoires
publics ou privés.
Anthony Rhys Conn
To cite this version:
Anthony Rhys Conn. Structure of the M31 satellite system : bayesian distances from the tip of the
red giant branch. Other. Université de Strasbourg; Macquarie university (Sydney, Australie), 2013.
English. �NNT : 2013STRAH002�. �tel-01012081�
UNIVERSITÉ DE STRASBOURG
A thesis presented to
Observatoire astronomique de Strasbourg
by:
Anthony Rhys CONN
defended on : 7 February 2013
for the degree of :
Docteur de l’université de Strasbourg
Discipline
: Astrophysics
Structure of the M31 Satellite
System:
Bayesian
Distances from the
Tip of the
Red
Giant
Branch
Thesis Supervisors :
Dr. Rodrigo A. Ibata
Université de Strasbourg
Prof. Quentin A. Parker Macquarie University
Prof. Geraint F. Lewis University of Sydney
A/Prof. Daniel B. Zucker Macquarie University
Members of the Jury :
Prof. Christian M. Boily
Université de Strasbourg
Dr. Michele Bellazzini
INAF—Osservatorio Astronomico di Bologna
Dr. Annie C. Robin Observatoire de Besançon
External Examiner :
Dr. Andreas Koch
University of Heidelberg
Completed under a cotutelle
agreement with Macquarie
University in Sydney Australia
c
!
Anthony Rhys Conn, 2013.
iii
Except where acknowledged in the customary manner, the
material presented in this thesis is, to the best of my
knowl-edge, original and has not been submitted in whole or part
for a degree in any university.
Acknowledgements
I have been very fortunate throughout my PhD candidature to work with some very dedicated
and talented astronomers and astrophysicists who have had a huge impact on the course
my research has taken. I have worked most closely with my supervisors Dr Rodrigo Ibata
(Universit´e de Strasbourg) and Prof. Geraint Lewis (University of Sydney) who I would
like to thank for the large amount of their time and resources they have invested in my
project. Rodrigo is a renowned figure in the field of Galactic Archaeology and I have greatly
benefited from his expertise. He has also been a great host on my many visits to Strasbourg
and always available to discuss the problem at hand. Likewise Geraint has had a prolific
impact on the field and is a veritable source of programming knowhow. He devotes an
enormous amount of energy to the various projects of his many students and his input has
been invaluable to my research. In addition, I would also like to thank my supervisors Prof.
Quentin Parker and A/Prof. Dan Zucker (both from Macquarie University) for their constant
support and encouragement. In particular I am indebted to Quentin for the great lengths he
went to in securing a funded position for me at Macquarie and for his efforts in establishing
and maintaining the cotutelle agreement with the Universit´e de Strasbourg. Whilst my PhD
project was somewhat external to the fields of expertise of both Quentin and Dan, they have
always made themselves available to discuss my work at length and advise on all matters of
administration.
In addition to the contributions of my 4 supervisors, there are a number of other people
who have played an important role in my progress toward completion. I would especially
like to thank all the members of the Pan Andromeda Archaeological Survey (PAndAS)
col-laboration for providing a wonderful repository of data to work with and particularly those
members included as coauthors on my papers for their detailed reviews of my drafts. I would
also like to add that I had many meetings with Dr Nicolas Martin (Universit´e de Strasbourg)
whilst in Strasbourg which had a large impact on the work presented in Paper II. In addition
I must thank Neil Ibata for his French translation of my thesis summary (R´esum´e de Th`ese).
I also received much support from my fellow PhD student Dr Anjali Varghese on my many
trips to Strasbourg and relied on her superior French more than once.
There are also a number of institutions that I must acknowledge for the support they have
provided. Firstly, I would like to thank Macquarie University for their financial support via
the Macquarie University Research Excellence Scholarship (MQRES) and also for paying
all my airfares and providing assistance with other expenses incurred during my candidature.
I would also like to thank the Observatoire Astronomique of the Universit´e de Strasbourg for
providing me with accommodation on each visit to Strasbourg and I would like to thank both
the aforementioned universities as well as the University of Sydney for use of computational
and all other facilities.
Finally I would like to thank all of my family for their ceaseless support and
encour-agement. Without my family it is inconceivable that I could ever have made it this far. I
would therefore like to dedicate this work to all of them: Mum, Dad, Nanna, Pa, Mardi, Pop,
Andrew, Crysta, Sophie, Kristin, Remo, Alex, Chris, Matthew, Trixie and all my extended
family.
A Note on Paper Co-Author Contributions
As a thesis by publication, much of the work contained in the main body of this thesis has
been (or will be) published in the form of three separate papers submitted to the
Astrophys-ical Journal. Each of these publications acknowledges contributions from a relatively large
group of co-authors. This is an inevitable consequence of the use of data that is the property
of a large collaboration (i.e. the Pan-Andromeda Archaeological Survey - PAndAS), and it
has in no way diminished the amount of work that I have put into each of these papers. In
fact, rather the opposite is true, due to the enormous amount of code adjustments and paper
editing that has had to take place to accommodate the suggestions of a large group of people.
The work contained in these papers has been carried out principally with the direction of the
second and third co-authors, my supervisors Prof. Geraint Lewis and Dr Rodrigo Ibata, with
all other contributions being in the form of written critiques of the paper drafts. This does
not detract from the aid I have received from my other two supervisors Prof. Quentin Parker
and A/Prof. Dan Zucker, who as well as providing similar critiques of my drafts, have been
a great help with all administrational matters that I have contended with during the course of
my PhD candidature. I should also note that I had many in-person discussions with Dr
Nico-las Martin whilst in Strasbourg, which further influenced the way I carried out the analysis
contained in the second paper.
All of this said, all three papers have been written entirely by me, and all figures they
contain have been generated by me using the PGPLOT plotting package (
Pearson
,
2011
),
with the sole exception of the pole-density plots in Paper III; Ch.
5
(Figs. 2, 4, 8, 10
(right-hand column of plots), 11 and 14), which were produced using a Gaussian-smoothing
program by Geraint Lewis from the pole count analysis data that I sent him. All of the
analysis contained in the papers has been undertaken using Fortran code that I have written
from scratch, with examples of most of the principal versions of the code provided in the
appendix. These programs do make occasional use of subroutines written by others, as now
stated:
I The “PolyS elect” subroutine is built around code written by Rodrigo Ibata, which uses
the functions “in poly” and “ f imag” written by him. Given a series of points
defin-ing the corners of a polygon, it determines whether or not a given point is inside this
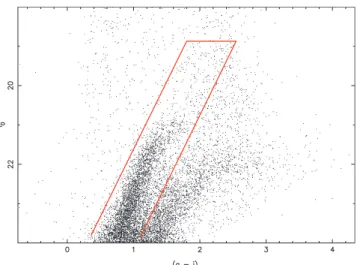
polygon. I use this routine to make colour-cuts on the Colour-Magnitude Diagram (see
calls of this subroutine in MF T RGB. f 95; Appendix
C
for example) and also to
re-ject random satellites drawn outside of the PAndAS survey area in my “RandomPoints”
subroutine, used in the analysis of Paper III.
II Part of the SVDFitter subroutine called in MF T RGB. f 95 (and earlier versions of this
program) has been modified by Geraint Lewis.
III The “ f unc i” function called in MF T RGB. f 95 (and earlier versions of this program)
gives the photometric error as a function of magnitude in CFHT i-band for the PAndAS
data and was provided by Rodrigo Ibata.
IV The “k verse alpha” subroutine called in S atDensity S ampCont. f 95 (Appendix
C
)
makes use of data generated by Geraint Lewis (k vs alpha.dat), which accounts for
the volume of space covered by the PAndAS survey area as a function of distance from
M31.
V Several subroutines from Numerical Recipes (
Press et al.
,
1992
) have been used to
per-form standard functions by various programs I have written, in particular MF T RGB. f 95.
In the programs listed in the appendices, use of these algorithms are generally noted at
the end of the program with commented double lines and the words ‘Libpress
Algo-rithms’ embedded. The Numerical Recipes subroutines themselves are not shown for
the sake of brevity, but any subroutine or function that is called from the code as printed
ix
in the appendices and yet is apparently absent from this printed code can be assumed to
be from Numerical Recipes.
VI The SLALIB Positional Astronomy Library (
Wallace
,
1994
) has been used to convert
object RA and Dec into tangent plane coordinates in MF T RGB. f 95 and earlier TRGB
programs so that the user can access various parts of the PAndAS Survey directly by
entering the objects Celestial coordinates. This library is also made use of in many
of the programs written for Paper III to convert back and forth between tangent plane
angles and real angles, and also to measure the angle between two given objects on the
sky.
I believe this to be a complete disclosure of all coding aspects that I make use of that
I have not written personally. They are few in number compared to the number I have
written and in general, their function has been to perform tasks secondary to the principal
operation of the programs that use them. Their inclusion is however, nevertheless vital to the
correct functioning of the programs. In summary, whilst many have contributed to the work
presented in these three papers, my contribution to each of them is exactly the same as any
dedicated student would make to the work contained in a major chapter of their thesis were
it not a journal publication.
Other General Comments
This thesis has been typeset in L
ATEX using a template developed by Paul Cochrane, Alexei
Gilchrist and Johann-Heinrich Sch¨onfeldt. The template has been modified slightly to better
suit the particular form of this thesis. Note that the digital version contains clickable
hyper-text providing links to relevant figures, sections and references. As a thesis by publication,
the included papers have been generated independently and hence adhere to a different
for-mat. Whilst they are integrated in terms of the page numbering and access from the table of
contents, their internal hyperlinks are inactive in the digital version of the thesis. Note also
that whilst the references contained in the papers appear again in the the thesis ‘References’
section, the pages on which they are cited will only be available for citations external to the
papers.
List of Publications
•
Conn, A. R.; Lewis, G. F.; Ibata, R. A.; Parker, Q. A.; Zucker, D. B.; McConnachie,
A. W.; Martin, N. F.; Irwin, M. J.; Tanvir, N.; Fardal, M. A.; Ferguson, A. M. N.
A Bayesian Approach to Locating the Red Giant Branch Tip Magnitude. I.
The Astrophysical Journal, Volume 740, Issue 2, article id. 69 (2011)
•
Conn, A. R.; Ibata, R. A.; Lewis, G. F.; Parker, Q. A.; Zucker, D. B.; Martin, N. F.;
McConnachie, A. W.; Irwin, M. J.; Tanvir, N.; Fardal, M. A.; Ferguson, A. M. N.;
Chapman, S. C.; Valls-Gabaud, D.
A Bayesian Approach to Locating the Red Giant Branch Tip Magnitude. II.
Distances to the Satellites of M31
The Astrophysical Journal, Volume 758, Issue 1, article id. 11 (2012)
•
Conn, A. R.; Lewis, G. F.; Ibata, R. A.; Parker, Q. A.; Zucker, D. B.; McConnachie,
A. W.; Martin, N. F.; Valls-Gabaud, D.; Tanvir, N.; Irwin, M. J.; Ferguson, A. M. N.;
Chapman, S. C.
The Three-Dimensional Structure of the M31 Satellite System;
Strong Evidence for an Inhomogeneous Distribution of Satellites
Submitted to the Astrophysical Journal on 9 November 2012
Abstract
The satellite system of a large galaxy represents the ideal laboratory for the study of galactic
evolution. Whether that evolution has been dominated by past mergers or in situ formation,
clues abound within the structure of the satellite system. This study utilizes recent
photomet-ric data obtained for the halo of M31 via the Pan-Andromeda Archaeological Survey
(PAn-dAS), to undertake an analysis of the spatial distribution of the M31 satellite system. To do
this, a new Bayesian algorithm is developed for measuring the distances to the satellites from
the tip of their Red Giant Branch. The distances are obtained in the form of posterior
prob-ability distributions, which give the probprob-ability of the satellite lying at any given distance
after accounting for the various spatial and photometric characteristics of the component
stars. Thus robust distances are obtained for M31 and 27 of its satellite galaxies which are
then transformed into three-dimensional, M31-centric positions yielding a homogenous
sam-ple of unprecedented size in any galaxy halo. A rigorous analysis of the resulting distribution
is then undertaken, with the homogeneity of the sample fully exploited in characterizing the
effects of data incompleteness. This analysis reveals a satellite distribution which as a whole,
is roughly isothermal and no more planar than one would expect from a random distribution
of equal size. A subset of 15 satellites is however found to be remarkably planar, with a
root-mean-square thickness of just 12.34
+0.75−0.43
kpc. Of these satellites, 13 have subsequently
been identified as co-rotating. This highly significant plane is all the more striking for its
orientation. From the Earth we view it perfectly edge on and it is almost perpendicular to the
Milky Way’s disk. Furthermore, it is roughly orthogonal to the disk-like structure commonly
reported for the Milky Way’s satellite galaxies. The distribution is also found to be highly
asymmetric, with the majority of satellites lying on the near side of M31. These findings
point to a complex evolutionary history with possible links to that of our own galaxy.
R´esum´e de Th`ese
´Etude de la structure tridimensionnelle du syst`eme de satellites de M31 au moyen d’une
m´ethode Bayesienne de localisation de la pointe de la branche des G´eantes Rouges
Les ´etoiles de basse masse pauvres en m´etaux qui ont consomm´e tout l’hydrog`ene pr´esent
dans leur noyau et dont celui-ci n’a plus une densit´e suffisante pour fusionner de l’h´elium,
entrent dans la phase de la branche des g´eantes rouges (RGB). Apr`es un certain temps,
l’´etoile devient plus lumineuse et les cendres dh´elium produites par cette r´eaction retombent
sur le noyau, accroissant sa densit´e jusqu’`a celle-ci soit suffisante pour remettre en marche
la fusion de l’h´elium. L’´etoile, qui n’appartiendra bientˆot plus `a la branche d’´etoiles RGB
est dite du tip of the Red Giant Branch (TRGB) . Du fait des propri´et´es similaires du noyau
de toutes les ´etoiles qui arrivent `a ce state de leur ´evolution dans une gamme sp´ecifique de
masse et de m´etallicit´e (voir
Iben and Renzini 1983
), leur radiation ´energ´etique et donc leur
luminosit´e est constante. Le TRGB pour de telles populations stellaires donne donc une
mesure de la distance `a cette population.
Avant le d´eveloppement de la m´ethode de la d´etection d’un bord de
Lee et al.
(
1993
),
la TRGB ´etait d´etermin´ee par des Diagrammes Couleur-Magnitude (CMD) `a l’oeil nu et les
distances d´eriv´ees manquaient donc de pr´ecision et d’uniformit´e requis pour une utilisation
fiable pour de nombreux objets. On a d´evelopp´e de nombreuses m´ethodes depuis celle-ci
mais elles se basent toutes sur l’id´ee de convoluer la fonction de luminosit´e (LF) du RGB
avec un kernel de d´etection de bord, afin de cr´eer un maximum `a la magnitude correspondant
`a la plus grande discontinuit´e dans la LF, qui devrait correspondre `a la magnitude du TRGB.
Malheureusement, de telles m´ethodes donnent de mauvais r´esultats dans la pr´esence de bruits
– notamment lorsque le RGB est noy´e par des ´etoiles contaminantes. Pour cette raison,
plusieurs alternatives d’ajustement de mod`eles qui utilisent toute la LF ont ´et´e propos´ees
(par exemple
M´endez et al. 2002
). Malgr´e cela, pour ces m´ethodes, les incertitudes de
mesures sont souvent tr`es grandes et mal d´efinies et n’ont pas la possibilit´e d’incorporer nos
informations `a priori sur le syst`eme ´etudi´e. C’est pour cela que la premi`ere grande partie
de cette th`ese aura pour but de cr´eer un algorithme robuste et versatile pour mesurer des
distances en utilisant la magnitude du TRGB.
Les premiers chapitres d´ecrivent le d´eveloppement d’un algorithme Bayesien qui utilise
une approche de maximum de vraisemblance. Les param`etres du mod`ele (magnitude du
TRGB, pente de la LF, propri´et´es de contamination) sont ajust´es par l’algorithme suivant une
simulation Markov Chain Monte Carlo (MCMC). Cela donne acc`es aussi aux incertitudes sur
ces param`etres. Malgr´e sa simplicit´e, cette m´ethode est robuste, et donne des sorties
intu-itives et visuelles des probabilit´es de param`etres et il reste facile d’ajouter de l’information
`a priori. La premi`ere version de cet algorithme a ´et´e publi´ee dans le Astrophysical Journal
(Paper I), et est `a la base du chapitre
3
. Cette publication pr´esente ´egalement des tests qui
caract´erisent la performance de cette m´ethode pour des LFs de diff´erentes qualit´es, ainsi que
son application `a trois galaxies naines sph´ero¨ıdales, satellites de M31, et donne les meilleures
incertitudes de toutes les m´ethodes bas´ees sur le TRGB publi´ees jusqu’`a ce jour.
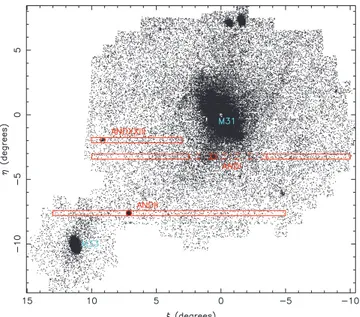
Les donn´ees physiques analys´ees dans cette th`ese viennent du Pan-Andromeda
Archae-ological Survey (PAndAS –
McConnachie et al. 2009
), un relev´e ambitieux qui couvre plus
de 300 degr´es carr´es autour de la galaxie d’Androm`edre, la galaxie g´eante la plus proche
de la Voie Lact´ee. Ce relev´e donne acc`es `a la photom´etrie profonde en bande g’ (centr´e sur
487 nm) et la bande i’ (centr´e sur 770 nm), et qui couvre plus de 25 satellites galactiques
qui sont id´eaux pour des mesures de distance par la m´ethode TRGB. L’algorithme pr´esent´e
en chapitre
3
a ´et´e am´elior´e pour utiliser ces donnes sp´ecifiques. La contamination du fond
´etant la plus grande source du d´etriment de la qualit´e des distances TRGB, j’ai mis au point
une routine << matched filter >> (voir
Rockosi et al. 2002
) pour donner des poids `a chaque
´etoile en fonction de sa position spatiale dans le profil de densit´e du satellite. L’effet de
l’application de cet algorithme sur la LF est de r´eduire la contamination du fond et ainsi
d’augmenter le contraste de la troncature du RGB au TRGB. Visuellement, le changement
du LF est souvent suffisant pour r´ev´eler de fac¸on tr`es claire la position du TRGB qui ´etait
avant `a peine plus que du bruit Poissonnien.
xix
Cette m´ethode am´elior´ee, appliqu´ee `a tous les satellites (27 en total) d´etect´es dans le
relev´e PAndAS est pr´esent´ee dans un deuxi`eme article soumis `a l’Astrophysical Journal et
constitue l’essentiel du chapitre
4
(Paper II). Cet article apporte les premi`eres mesures de
dis-tances pour une grande partie de ces satellites et se r´ev`ele ˆetre l’analyse la plus compr´ehensive
des distances du syst`eme de satellites de M31. Cette investigation contient ´egalement une
analyse br`eve du profil de la densit´e du halo en utilisant ces nouvelles distances, que nous
avons compar´ees aux valeurs trouv´ees avec l’aide d’autres m´ethodes.
Le grand nombre de satellites autour de M31 pour lesquels j’ai obtenu de bonnes mesures
de distances donne ainsi une excellente occasion d’analyser le degr´e de planarit´e et d’asym´etrie
du syst`eme de satellites. Cela a des fortes r´epercussions sur la distribution de matire dans le
halo de la galaxie hˆote ainsi que sur l’histoire de formation des satellites mˆemes. Plusieurs
´etudes du syst`eme satellitaire de la Voie Lact´ee (par exemple
Lynden-Bell 1982
;
Zentner
et al. 2005
;
Pawlowski et al. 2012b
), trouvent des plans fortement significatifs, souvent
in-clin´es par rapport au disque Galactique. Des r´esultats similaires ont ´et´e publi´es pour le
syst`eme de M31 (par exemple
Koch and Grebel 2006
). Les ´etudes du syst`eme de M31 ont
´et´e faits avec de petits ´echantillons de satellites et les mesures de distances proviennent donc
de plusieurs auteurs (et m´ethodes) diff´erentes. C’est ainsi que le chapitre
5
et une troisi`eme
publication donnent `a voir une analyse d´etaill´ee du syst`eme de satellites de M31 en se basant
sur les donn´ees du chapitre
4
. La planarit´e du syst`eme de satellites est explor´ee par le biais
du plan de meilleur ajustement en utilisant plusieurs m´ethodes (moindre rms, moindre
dis-tance, ajustement `a un modele Gaussien). La vraisemblance de ces alignements est analys´ee
`a l’aide de simulations o`u chaque satellite est tir´e au hasard a partir de sa distribution de
dis-tance. L’analyse de l’asym´etrie est effectu´ee de fac¸on similaire, en utilisant des statistiques
d’asym´etrie, notamment le nombre de satellites qui se trouvent sur un h´emisph`ere du halo.
Les positions 3-D pr´esent´ees au chapitre
4
montrent que le pˆole du plan d’asym´etrie
maxi-mal se trouve tr`es pr`es du vecteur Terre-M31 ; la probabilit´e d’un tel alignement est ´etudi´ee
dans cette th`ese.
Contents
Acknowledgements
v
A Note on Paper Co-Author Contributions
vii
Other General Comments
xi
List of Publications
xiii
Abstract
xv
R´esum´e de Th`ese
xvii
1
An Introduction to Galactic Archaeology
1
1.1 Overview . . . .
1
1.2 A portrait of a Galaxy . . . .
2
1.3 Galactic Archaeology - The Means and the Motives . . . .
4
1.4 Completed and Future Surveys - What can they tell us? . . . .
8
1.4.1
Photometric . . . .
8
1.4.2
Astrometric . . . .
10
1.4.3
Kinematic . . . .
12
1.5 Dark Matter and the Predictions of ΛCDM Cosmology . . . .
15
1.6 Resolving the Matter - Methods for Measuring the Dark Matter Distribution
19
1.7 The Pan-Andromeda Archaeological Survey . . . .
23
1.8 The Importance of Position . . . .
26
2
Building the Framework for a new TRGB Algorithm
31
2.1 The RGB Tip Finding Problem . . . .
31
2.2 Early Trials of TRGB Finding Algorithms . . . .
33
2.3 A Simple Maximum Likelihood Test . . . .
36
2.4 The Markov Chain Monte Carlo Method . . . .
42
2.5 The Bayesian and the Frequentist . . . .
45
2.6 Prior Information . . . .
48
3
Paper I: A Bayesian Approach to Locating the Red Giant Branch Tip
Magni-tude. I.
51
Paper I Preface . . . .
52
Abstract . . . .
53
1. Introduction . . . .
53
2. Method . . . .
54
2.1 The MCMC Method . . . .
54
2.2 A Note on Distance Errors . . . .
58
2.3 Initial Tests . . . .
59
2.4 Algorithm Behavior for Composite Luminosity Functions . . . .
59
3. Distances to Two More Satellites . . . .
60
3.1 Andromeda II . . . .
61
3.2 Andromeda XXIII . . . .
61
4. Conclusions . . . .
62
Acknowledgements . . . .
62
References . . . .
63
4
Paper II: A Bayesian Approach to Locating the Red Giant Branch Tip
Magni-tude. II. Distances to the Satellites of M31
65
Paper II Preface . . . .
66
Abstract . . . .
70
Contents
xxiii
1. Introduction . . . .
70
2. A Recap of the Base Method . . . .
71
3. Addition of a Matched Filter . . . .
72
3.1 Matched Filtering using Radial Density Profiles . . . .
72
3.2 A Test for the Refined Algorithm . . . .
73
3.3 An Additional Prior . . . .
74
4. A New Perspective on the Companions of M31 . . . .
77
4.1 Galaxy Distances . . . .
77
4.2 Determining the Distances from M31 . . . .
80
4.3 A First Approximation of the Satellite Density Profile within the Halo .
82
5. Conclusions . . . .
88
References . . . .
88
5
Paper III: The Three Dimensional Structure of the M31 Satellite System;
Strong Evidence for an Inhomogeneous Distribution of Satellites
89
Paper III Preface . . . .
90
Abstract . . . .
97
1. Introduction . . . .
97
2. Method . . . .
99
2.1 Plane Fitting . . . .
99
2.2 Generating Random Satellite Samples . . . .
99
2.3 A note on Satellite Detection Bias . . . .
100
3. Results . . . .
101
3.1 Best Fit Plane to the Entire Satellite Sample . . . .
101
3.2 The Plane of Maximum Asymmetry . . . .
102
3.3 Subsets of Satellites . . . .
102
3.4 A Great Plane of Satellites . . . .
109
4. Discussion . . . .
109
5. Conclusions . . . .
111
References . . . .
111
6
Conclusions
113
An Introduction to the Appendices
117
A Chapter Two Programs
119
B Chapter Three Programs
141
C Chapter Four Programs
169
D Chapter Five Programs
243
List of Abbreviations
295
“I do not feel obliged to believe that the same God who has endowed us with sense, reason, and intellect has intended us to forgo their use.”
Galileo Galilei (1564-1642)
1
An Introduction to Galactic Archaeology
1.1
Overview
Large galaxies like the Milky Way and it’s neighbor the Andromeda Galaxy (M31) are
com-plex, evolved structures when studied on any scale. They are a plethora of countless billions
of stars and the condensing clouds of gas and dust from which they form, all in motion, all
evolving since time immemorial. But far removed though their origins may be, their very
structure preserves their past. However, even the structure of the Milky Way, our own galaxy,
is not obvious from our vantage point deep within it and while the general structure of its
basic components have been constrained, there is an underlying labyrinth of substructure
remaining to be identified and interpreted with respect to its bearing on Galactic Evolution.
Hence we must begin our study with an overview of the large scale structure of our own
galaxy a structure which, as might be expected, is shared by many of our galactic
neigh-bours and indeed by nearly all those galaxies near and far of a similar type.
1.2
A portrait of a Galaxy
The Milky Way (henceforth ‘the Galaxy’) is a late-type barred spiral galaxy. It is known to
consist of both a thin and a thick disk component, a central bulge and an enormous halo,
encompassing the whole system (
Freeman and Bland-Hawthorn
,
2002
). The thin disk has
been determined to have a scale length of 2600 pc and a scale height of 300 pc (
Juri´c et al.
,
2008
) with an overall radius of 15 ± 2 kpc (
Ruphy et al.
,
1996
). It is within the thin disk that
both the solar neighbourhood and the spiral arms reside. The spiral arms have been traced
by various methods, notably by
Georgelin and Georgelin
(
1976
), who used HII regions to
trace their extent. They found two symmetrical pairs of arms with a pitch angle of 12
◦.
The four arms in total were identified as the Sagittarius-Carina Arm, the Scutum-Crux Arm,
the Norma Arm and the Perseus Arm, with the Sun residing in a spur between the inner
Sagittarius-Carina Arm and the outer Perseus Arm. This is represented schematically in
Figure
1.1
. Based on their findings they suggest a morphological type for the Galaxy closest
to Sc.
Enveloping the thin disk is a somewhat more diffuse, ancient haze of stars termed the
Galactic ‘thick disk’ (
Gilmore and Reid
,
1983
). It has been calculated from the Sloan Digital
Sky Survey I (SDSS I) to have a scale length of 3600 pc and a scale height of 900 pc (
Juri´c
et al.
,
2008
).
Freeman and Bland-Hawthorn
(
2002
) describe it as a ‘snap frozen relic of the
heated early disk’ and allocate some 10% of the Galaxy’s baryonic matter to its confines. A
metallicity of -2.2 < [Fe/ H] < -0.5 is quoted for the thick disk stars in contrast to the -0.5
<
[Fe/ H] < 0.3 determined for the younger thin disk, and its luminosity is specified as 10%
that of the thin disk.
In the inner regions of the Galaxy is a denser conglomeration of what are generally
con-sidered to be older, metal poor stars termed ‘the bulge.’
Freeman and Bland-Hawthorn
(
2002
)
caution however that a study of bulge red giant stars (
McWilliam and Rich
,
1994
) suggests
1.2 A portrait of a Galaxy
3
Figure 1.1: A Schematic of the observable portion of the Milky Way’s spiral arms. (
Vall´ee
,
2005
)
a metallicity much closer to the older stars of the thin disk than to the truly ancient stars in
the Galactic halo. They further describe the Milky Way’s bulge as appearing significantly
smaller than that of M31 and somewhat ‘boxy,’ typical of an Sb to Sc spiral. Also of
partic-ular note, the Galaxy has long been suspected of containing a bar at its centre which has, as
of 2005, been proven.
Benjamin et al.
(
2005
) find the bar to have a length of 8.8 ± 1.0 kpc
with orientation such that it is rotated 44 ± 10
ofrom a line connecting the Sun and Galactic
Centre.
Finally, the halo of the Milky Way is easily its largest and arguably its oldest major
constituent. It is an enormous, roughly spherical (
Ibata et al.
,
2001b
) cocoon of ancient
field stars, and approximately 150 similarly ancient globular clusters (
Freeman and
Bland-Hawthorn
,
2002
). It is also known to extend out well beyond the Small Magellanic Cloud to
a distance of 100 kpc from Galactic centre and it contains at least 10 known satellite galaxies
(
van den Bergh
,
2006
). Perhaps most remarkable is that it contains 1.0
+0.3−0.2
×
10
12
M
⊙
(
Xue
(
Freeman and Bland-Hawthorn
,
2002
). The substructure within this dark matter halo is of
great interest as it lies at the heart of our current understanding of galaxy formation.
Our current knowledge of the Galaxy as presented in the above paragraphs represents
some of the fruits of Galactic Archaeology. This knowledge is however fairly coarse in
scope and Galactic Archaeology may still be regarded as a burgeoning field. Nevertheless, it
is our means to unravel the Galaxy’s past and our best hope for predicting its future.
1.3
Galactic Archaeology - The Means and the Motives
The field of Galactic Archaeology is in a sense a toolkit providing the necessary tools to wind
back the cosmic clock and provide us with a high resolution view of our Galaxy and its
im-mediate neighbours in a way that might otherwise have been restricted to the poorly resolved
galaxies of the high-redshift universe. It is not a single method but rather a collection of
techniques making use of large sky photometric, astrometric and kinematic surveys to study
the positions, motions and chemical compositions of groups of stars in an effort to link them
to ancient progenitor structures and then simulate the evolution of these structures through
time to the present and beyond. In other words, if stars are found to be grouped together
in 6D phase space (i.e. 3 dimensions in position and 3 dimensions of velocity) they may
be members of a present day cluster whereas stars grouped together only in velocity space
may be termed a moving group and be members of a since-dispersed cluster. Stars grouped
together in chemical space might similarly be ‘tagged’ to an ancient progenitor structure.
Some of these possibilities are further investigated in the following paragraphs.
With the advent of Galactic Archaeology, the discovery of moving groups has become
common. In an early example,
Eggen and Sandage
(
1959
) identified the nearby moving
group Groombridge 1830 and associated it with the Galaxy’s globular clusters, providing
an early detection of nearby halo stars. In the intervening decades, numerous further
exam-ples have been discovered associated with the halo alone, but
Freeman and Bland-Hawthorn
(
2002
) caution that the validity of some of these groups is questionable.
The tagging of stars to progenitor groups based on their chemical composition is
per-haps an even more powerful technique. It relies on the assumption that the progenitor cloud
1.3 Galactic Archaeology - The Means and the Motives
5
be uniformly well mixed before the formation of the surviving stars (
Freeman and
Bland-Hawthorn
,
2002
) which is conceivable if
McKee and Tan
(
2002
)’s model of cluster
forma-tion is accepted whereby all stars form at a similar time. Such a method has interesting
implications not only for the origins of structure formation in the Galaxy at large, but also at
a more local level, as it presents the real possibility of identifying Solar siblings – those stars
that formed out of the same cloud as our Sun. Indeed
Reipurth
(
2005
) lists possible evidence
supporting the idea that the Sun did in fact form in a cluster and
Portegies Zwart
(
2009
) goes
so far as to provide mass and radius constraints for the cluster of 500 – 3000 M
⊙and 1 –
3 pc respectively. They further concur that with accurate chemical abundances and phase
space information, the identity of the cluster members may be recovered. A direct test of the
feasibility of chemical abundance tagging is seen in
De Silva et al.
(
2007
) where of the 18
supposed members of the commoving group HR1614, 14 were found to have very little
scat-ter in chemical abundances across a wide range of elements with the non-conforming stars
conceivably ‘pollution’ from the non-cluster background. Thus it seems that, at least in some
cases, this powerful technique proposed for Galactic Archaeology should be applicable.
So far we have encountered the means to re-construct ancient Galactic components but
the question remains – how ancient? A time frame is needed to accurately model the Galaxy’s
evolution, as evolution is after all time dependent. There are various methods proposed to
fulfill this function, all relating to the determination of stellar age, of which
Freeman and
Bland-Hawthorn
(
2002
) gives a concise summary. Since we are generally concerned with
stars long since removed from their parent clusters, determining age from the main sequence
turnoff is obviously not an option. Instead, such methods as nucleo-cosmochronology,
astero-seismology and age-metallicity relations are suggested. Nucleo-cosmochronology is
concerned with ageing the elements in a star based on their remaining radioactive isotope
strengths, given a certain radioactive decay rate. Since the original elemental abundances
are not known, the method compares the radioactive isotope strengths to stable r-process
el-ements. Some studies based on this technique have already been highly successful.
Astero-seismology takes advantage of the evolving mean molecular weight in the cores of stars to
ascertain age and has been used to provide an age for the Sun of 4.57 Gyr ± 0.12 Gyr (
Gough
,
Figure 1.2: An example of the Age-Luminosity Relation. Here, the ages of the oldest globular
clusters have been plotted as a function of the absolute visual magnitude of component RR Lyrae
stars. The best fit median is represented by the solid line while the dashed lines represent 1σ limits.
(
Chaboyer et al.
,
1998
)
2001
), which matches well with the ages determined for the oldest meteorites by more
di-rect means. An age-metallicity relationship would provide a more didi-rect measure of stellar
age, if indeed one could be established but alas, such a relationship only applies to a small
subset of stars.
Freeman and Bland-Hawthorn
(
2002
) find such a relationship to exist only
for a small range of young, hot, metal-rich stars. More useful however is the age-luminosity
relationship (Figure
1.2
) found to apply to the much older RR Lyrae stars, provided their
dis-tances may be accurately determined. This principle has been applied to constrain the ages
of the Galaxy’s globular clusters (
Chaboyer et al.
,
1996
). Still, there is a large age interval
over which the latter two methods are not applicable, thus emphasizing the importance of
the former two methods.
Having discussed the tools of Galactic Archaeology, what are its goals and to what extent
have these goals already been met? The ultimate goal of Galactic Archaeology is to be able to
1.3 Galactic Archaeology - The Means and the Motives
7
trace the current structures of the Galaxy back to their progenitor structures in the protocloud
from which it formed. In so doing, the histories of the various components of the Galaxy are
uncovered, spanning from the epoch of formation to the present day. As outlined in section 1,
the basic structure of the Galaxy has already been established and based on the stellar ages
and metallicities/ elemental abundances across the various components an hypothesis for
galaxy formation has been formulated, again summarized in
Freeman and Bland-Hawthorn
(
2002
). It is suggested that the Galactic Protocloud began to form at a similar time to the
epoch of reionization. At this time the Galaxy, like those around it, appeared in the form of a
dark matter halo, with its central black hole and possibly its stellar bulge forming first. The
prominent disk structure where most of the baryons reside did not develop until the beginning
of the main epoch of baryon dissipation at a redshift of z ∼ 1 − 5. This also coincides with
the ages of the thick disk and the globular clusters. The populating of the halo with globulars
and field stars is thought to have also begun very early in the formation process, the result
of tidal interactions with small neighbouring dwarf galaxies. The thin disk comprises the
youngest stars of the Galaxy while the thick disk is likely the dynamically heated remnant
of an ancient thin disk – in fact, Galactic Archaeology may provide some clue as to the
particular interaction responsible. One popular theory is that the globular cluster ω Cen is
the remnant core of a small galaxy, stripped of its outer stars in an interaction precipitating
the heating of the original thin disk (
Bekki and Freeman
,
2003
). It is also believed that the
current galactic bulge is not of the ancient origin of more pronounced bulges such as that
found in M31, but rather a later formation in the established inner disk. This is consistent
with the relatively high metallicities in the galactic core, although it must be stressed that
metallicity is a better measure of the number of supernova events rather than of actual age
and the density of the galactic core is bound to influence this number profoundly.
The formation sequence presented above owes little to observations of high-redshift
galaxies or even to computer simulations based on Cold Dark Matter (CDM) Cosmology,
but rather it is a construction based on observations of our own galaxy and those nearby. Our
focus has so far been centered on the Milky Way, but it must be stressed that any galaxies
close enough to have their individual stars mapped into phase space or chemical space are
within the reach of Galactic Archaeology. It should also be stressed that the methods
as-sociated with Galactic Archaeology described above form the basis for such study but such
methods provide for mere data acquisition – the possible applications for the data are
enor-mous, and hence so to is the scope of Galactic Archaeology. These points should be kept
in mind as some of the various sky surveys available to the ‘Galactic Archaeologist’ are
discussed in the next section.
1.4
Completed and Future Surveys - What can they tell us?
Modern Galactic Archaeology draws heavily on a small number of ambitious, wide field
surveys focused, at least in part, on the acquisition of either photometric, astrometric or
kinematic data for large numbers of stars. While there are many smaller data sets such as
Hubble Space Telescope (HST) pointings and those from major ground telescopes which are
also utilized, our focus here shall be limited to these major surveys.
1.4.1
Photometric
Among those surveys with the broadest scope are the photometric surveys, although the data
they include is often more restrictive for Galactic Archaeology than that from the astrometric
and kinematic surveys. Photometry is of particular usefulness in determining the distance to
large numbers of objects. The two most recent major photometric catalogues are those from
the Sloan Digital Sky Survey (SDSS) and the Two Micron All Sky Survey (2MASS). SDSS
is an ongoing survey, begun in 2000, using the dedicated 2.5 m wide-field, modified
Ritchey-Chr´etien telescope at Apache Point Observatory and an array of 30 × 4 megapixel CCDs.
The survey provides photometry in the u, g, r, i and z bands (see
York et al. 2000
for a
technical summary) as well as spectroscopy of select targets. As of the ninth data release
(
SDSS-III Collaboration et al.
,
2012
), the survey had covered some 14555 square degrees
of sky or more than
13