HAL Id: tel-02493929
https://tel.archives-ouvertes.fr/tel-02493929
Submitted on 28 Feb 2020HAL is a multi-disciplinary open access archive for the deposit and dissemination of sci-entific research documents, whether they are pub-lished or not. The documents may come from teaching and research institutions in France or abroad, or from public or private research centers.
L’archive ouverte pluridisciplinaire HAL, est destinée au dépôt et à la diffusion de documents scientifiques de niveau recherche, publiés ou non, émanant des établissements d’enseignement et de recherche français ou étrangers, des laboratoires publics ou privés.
Urban growth simulations in order to represent the
impacts of constructions and environmental constraints
on urban sprawl
Mojtaba Eslahi
To cite this version:
Mojtaba Eslahi. Urban growth simulations in order to represent the impacts of constructions and environmental constraints on urban sprawl. Modeling and Simulation. Université Paris-Est, 2019. English. �NNT : 2019PESC2063�. �tel-02493929�
THÈSE
Université PARIS-EST
Ecole Doctorale MSTIC
Discipline : Sciences et Technologies de l’Information Géographique Mojtaba ESLAHI
Simulations de croissance urbaine pour représenter les impacts
possibles des constructions et des contraintes environnementales
sur l’étalement urbain - Constructibilité et application à
l'étalement urbain
Urban growth simulations in order to represent the impacts of
constructions and environmental constraints on urban sprawl -
Constructibility and application to urban sprawl
École Spéciale des Travaux Publics (ESTP-Paris) Institut de Recherche en Constructibilité (IRC)
Novembre 2019
Président du jury: Monsieur Gilles GESQUIERE
Professeur, Université de Lyon
Rapporteur : Madame Myriam SERVIÈRES
Maître de conférences, HDR, Ecole Centrale de Nantes
Rapporteur : Monsieur Dominique BADARIOTTI
Professeur, Université de Strasbourg
Examinateur : Monsieur Rani EL MEOUCHE
Enseignant chercheur, IRC, ESTP-Paris
Examinateur : Monsieur Youssef DIAB
Professeur, Université Paris-Est Marne-la- Vallée
Examinateur : Monsieur Matteo CAGLIONI
Maître de conférences, Université Nice Sophia Antipolis
Directeur : Madame Anne RUAS
i
Acknowledgements
I cordially thank Professor Dominique BADARIOTTI and Doctor Myriam SERVIÈRES for accepting to review this work from technical point of view. Many thanks to Professor Gilles GESQUIERE, Professor Youssef DIAB and Doctor Matteo CAGLIONI for being part of my thesis jury. I would like to thank my thesis director, Professor Anne RUAS, and my thesis co-director, Doctor Rani EL MEOUCHE, for all their supports and advices throughout this journey.
I would greatly thank the foundation of ESTP to finance this research. I wish to thank ESTP Paris and IRC for the opportunity they gave me. I would like to thank all my directors, colleagues and friends, for their companionship and supports.
My pure thanks to my lovely parents, and my beloved sisters, without the supports of whom I could not continue. Last but not least, I owe appreciation and sincere thanks to my incredible and lovely wife who has stood by me through all these years.
iii This thesis is developed under the concept of constructibility in urban systems. Constructibility Research Institute (IRC), ESTP Paris has proposed the new concept of constructibility, in order to integrate performance-based approaches and process management methods. IRC develops its entire research themes based on constructability.
IRC defines the term of constructibility as an approach that aims to provide a reasoned insurance, from the beginning as to the achievement of the objectives of any construction project throughout its life cycle (Gobin, 2010). Constructibility is a new discipline that offers several methods and approaches in order to control the risks of a change in performance and provides a concrete response to the construction industry as well as their complexities. This concept originates from two terms of buildability and constructability which aims to reach and guarantee performance level of constructions and the process of modeling (Contrada, 2019). Buildability is described as the practice to be adopted by the designer for the purpose of facilitating the building construction (CIRIA, 1983). The term constructability enhance buildability extending the practice of sharing knowledge to the whole construction lifecycle (CII, 1986).
Cities are complex dynamic systems and several factors can affect the successful progress of the process of urban modeling. In the process of urban modeling, the model should respect several constraints and rules which may result in increasing its complexity. It is worth noting that this complexity of the cities can influence the performance of the modeling. Our proposed method in constructibility framework aims to improve our understanding of the urban growth simulations by representing the impacts of constructions and environmental constraints on urban sprawl. The purpose of this research is to give different images of the city of tomorrow for applying it to urban management and help the public policies decision making and constructibility can increase the performance level of the modeling in this process.
v
Table of Contents
Acknowledgements ... i Résumé ... 1 Abstract ... 3 Introduction ... 5Chapter 1 : Urbanization and Urban Modeling ... 11
1.1. Urbanization ... 12
1.1.1. The Impacts of Urbanization ... 14
1.1.1.1. The Impacts of Urbanization on Environment ... 15
1.1.1.2. The Impacts of Urbanization on Agricultural Lands ... 16
1.1.1.3. Policies to Limit Agricultural Land Changes ... 16
1.1.2. Urbanization in France ... 16
1.1.2.1. Urbanization Measurements ... 18
1.1.2.2. Avoid or Reducing the Effects of Urbanization ... 20
1.2. Urban Modeling ... 21
1.2.1. Land Use Patterns ... 22
1.2.1.1. Concentric Zone Model ... 23
1.2.1.2. Sector Model ... 24
1.2.1.3. Multiple Nuclei Model ... 24
1.2.2. Sustainable Urban Modeling: An Overview on Different Techniques of Simulating Urban Growth and Land Use / Land Cover Change ... 25
1.2.2.1. Fractal Modeling ... 26
1.2.2.2. Artificial Neural Networks Modeling ... 27
1.2.2.3. Agent Based Modeling ... 29
1.2.2.4. Cellular Automata (CA) Modeling ... 31
1.2.2.4.1. SLEUTH CA Model ... 35
1.2.2.4.2. Advantages of SLEUTH ... 36
1.2.2.4.3. Limitation of SLEUTH ... 36
1.2.2.4.4. Some Evolutions and Applications of SLEUTH ... 37
1.3. Chapter Conclusion ... 38
Chapter 2 : Methodology and Fundamentals for Model Construction ... 41
2.1. Simulation Methodology to Investigate the Effects of Environmental Constraints and Constructions on Urban Sprawl ... 42
2.2. SLEUTH Urban Growth Model Structure ... 44
2.2.1. Growth Cycle ... 45
vi
2.2.3. Growth Rules ... 46
2.2.3.1. Spontaneous Growth ... 47
2.2.3.2. New Spreading Center Growth ... 47
2.2.3.3. Edge Growth ... 48
2.2.3.4. Road Influenced Growth ... 48
2.2.4. Self-Modification ... 49
2.3. Urban Growth Modeling Considering Environmental Constraints Scenarios ... 50
2.3.1. SLEUTH-3r Modifications to the SLEUTH ... 50
2.3.2. Calibration of the SLEUTH-3r Model and Determining the Goodness of Fit ... 52
2.3.3. Defining our Environmental-based Scenarios ... 56
2.3.3.1. Scenario Protection Level 0 (Nearly No Environmental Protection - NEP) ... 57
2.3.3.2. Scenario Protection Level 1 (Limited Environmental Protection - LEP) ... 57
2.3.3.3. Scenario Protection Level 2 (Moderate Environmental Protection - MEP) ... 57
2.3.3.4. Scenario Protection Level 3 (Extreme Environmental Protection - EEP) ... 58
2.3.3.5. Attraction-based Scenario Protection Level 1 (Attraction-based Limited Environmental Protection - ALEP) ... 58
2.3.4. Model Forecasting ... 59
2.3.5. Model Evaluation and Investigation the Impacts of Urbanization Determinants on Model ... 60
2.4. Integrate the Type of Buildings and Demography on Urban Sprawl Simulation ... 60
2.4.1. Determinants and Impacts of Building Types on Urban Sprawl ... 61
2.4.1.1. Building Type Classification ... 61
2.4.1.2. Classifying the Existing Buildings ... 63
2.4.1.3. Creating Building Type Matrix (Active Land Use Model) ... 64
2.4.2. Determinants and Impacts of Population Growth on Urban Sprawl ... 66
2.4.2.1. Demographic Data ... 66
2.4.2.2. Population Growth Estimation ... 67
2.5. Urban Fabric Scenarios and Urban Configuration ... 67
2.6. 3D Representation of Prospective Urban Growth Simulations ... 69
2.7. Chapter Conclusion ... 69
Chapter 3 : Application of the Model to Diversify the Simulations of Urban Sprawl ... 71
3.1. General Presentation of Study Areas ... 72
3.2. Developing Different Simulation Scenarios to Illustrate the Impacts of Environmental Constraints, Construction and Population on the Growth of a Metropolis - Toulouse Metropolis ... 73
3.2.1. Data and Materials - Toulouse ... 76
3.2.2. Environmental Constraints Scenarios - Toulouse ... 79
3.2.2.1. Scenario Protection Level 0 (Nearly No Environmental Protection - NEP) ... 81
3.2.2.2. Scenario Protection Level 1 (Limited Environmental Protection - LEP) ... 83
3.2.2.3. Scenario Protection Level 2 (Moderate Environmental Protection - MEP) ... 85
3.2.2.4. Scenario Protection Level 3 (Extreme Environmental Protection - EEP) ... 86
3.2.2.5. Attraction-based Scenario Protection Level 1 (Attraction-based Limited Environmental Protection - ALEP) ... 89
3.2.3. 2D Urban Growth Simulations - Toulouse ... 91
3.2.4. Urban Fabric Scenarios - Toulouse ... 100
3.2.4.1. Building Type Classification ... 100
3.2.4.2. Creating Building Type Matrix and Urban Weighting the Patches ... 103
3.2.4.3. Demography and Population Management ... 103
vii 3.3. Developing Different Simulation Scenarios to Illustrate the Impacts of Environmental
Constraints, Construction and Population on the Growth of a town - Saint Sulpice la
Pointe peri-urban ... 109
3.3.1. Data and Materials - Saint Sulpice la Pointe ... 110
3.3.2. Environmental Constraints Scenarios - Saint Sulpice la Pointe ... 110
3.3.3. 2D Urban Growth Simulations - Saint Sulpice la Pointe ... 117
3.3.4. Urban Fabric Scenarios - Saint Sulpice la Pointe... 122
3.4. Developing Different Simulation Scenarios to Illustrate the Impacts of Environmental Constraints, Construction and Population on the Growth of a small community - Rieucros rural area ... 125
3.4.1. Data and Materials - Rieucros ... 126
3.4.2. Environmental Constraints Scenarios - Rieucros ... 126
3.4.3. 2D Urban Growth Simulations - Rieucros ... 133
3.4.4. Urban Fabric Scenarios - Rieucros ... 138
3.5. The Impacts of Pixel Size and Calibration on Sustainability of Model ... 140
3.6. Chapter Conclusion ... 143
Chapter 4 : Creation of Fictive 3D Buildings to Facilitate the Interpretation of Simulation Results and Differentiate Scenarios ... 145
4.1. 3D Urban Generating Applications and Procedure ... 146
4.2. From Pixel to 3D Building Representation ... 149
4.2.1. From Pixel to Polygon ... 151
4.2.2. Positioning the Building footprints ... 153
4.2.3. Configuration the Building footprints ... 156
4.2.4. Building Footprints Generation ... 159
4.2.5. Positioning Building Representations according to Urban Fabric Scenarios ... 161
4.3. 3D Visualization of the City of Tomorrow ... 165
4.4. Chapter Conclusion ... 167
Chapter 5 : Conclusion and Perspectives ... 169
Annex A: Classified List of Researches and Applications of Simulating Urban Growth and Land Use / Land Cover Change ... 175
Annex B: SLEUTH Urban Growth Model Process Flow and the Scenario File Description ... 183
B.1. Data Set Preparation ... 183
B.2. Scenario File ... 184
B.3. Model Execution ... 195
Annex C: Coefficients and Calibration ... 197
C.1. Dispersion Coefficient Multiplier ... 197
C.2. Best-Fit Coefficients ... 203
Annex D: Weighting Urban Patches Using Predefined Urban Land Use Models ... 209
D.1. Toulouse Concentric Zone Model ... 209
D.2. Toulouse Sector Model ... 210
D.3. Toulouse Multiple Nuclei Model ... 211
viii
Annex E: INSEE Data Documentations ... 215
E.1. Number of Inhabited ... 215
E.2. List and Description of Variables - Table of Tiles ... 215
E.3. List and Description of Variables - Table of Rectangles ... 216
Publications ... 217
ix
List of figures
Figure I. Structure of the thesis process flow………...8
Figure 1. 1. Proportions of urban and rural world population, from 1950 to 2050; (United Nations, 2018) ... 12
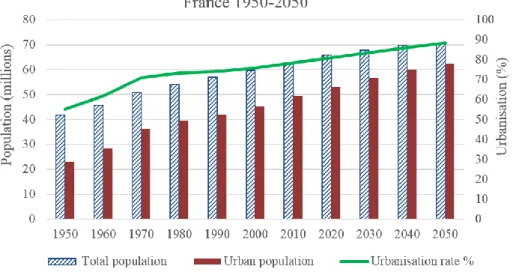
Figure 1. 2. Total population, urban population and urbanization rates from 1950 to 2050; (United Nations, 2018) ... 13
Figure 1. 3. Urban sprawl physical patterns; (Galster et al., 2001) ... 22
Figure 1. 4. Concentric zone model (R. E. Park et al., 1925) ... 23
Figure 1. 5. Sector model (H. Hoyt, 1939) ... 24
Figure 1. 6. Multiple nuclei model; (Harris & Ullman,, 1945) ... 25
Figure 1. 7. a: Sierpinski carpet construction, b: Design of fractal urban growth model development in the touristic village of Pogonia Etoloakarnanias, western Greece; (Triantakonstantis, 2012) ... 27
Figure 1. 8. a: hexagonal ANN, b: ANN neighborhood; (Weisner and Cowen, 1997) ... 28
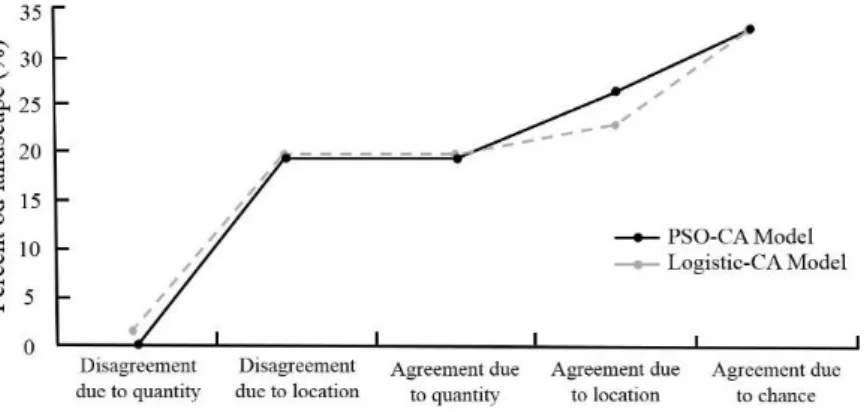
Figure 1. 9. A comparison of the PSO-CA and the logistic-CA model; (Feng et al., 2011) ... 33
Figure 1. 10. The simulation accuracies of the PSO-CA model at different spatial scales using overall accuracy and kappa coefficient; (Feng et al., 2011) ... 33
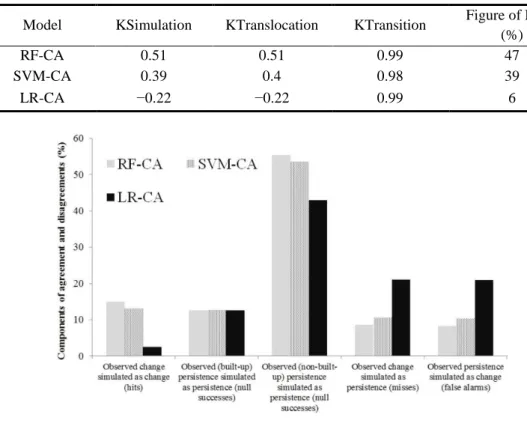
Figure 1. 11. Components of agreement and disagreement for RF-CA using bootstrap aggregate, SVM-CA simulated land use map; and LR-CA simulated land use map (Kamusoko and Gamba, 2015) ... 34
Figure 1. 12. SLEUTH inputs data; (Clarke, K.C., 2008) ... 35
Figure 1. 13. State of cells according to four growth rules of SLEUTH; (Clarke, K.C., 2008) ... 36
Figure 2. 1. The proposed method procedure ... 43
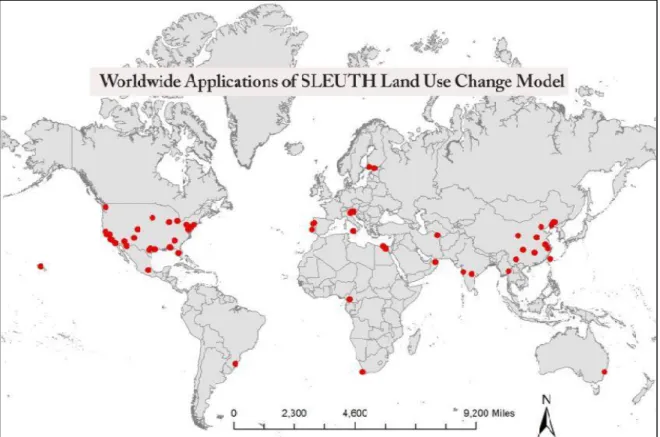
Figure 2. 2. Worldwide Application of SLEUTH Land Use Change Model extracted from the published applications of SLEUTH until 2012 (Chaudhuri et al., 2013) ... 44
Figure 2. 3. Structure of the SLEUTH model (Chaudhuri et al., 2013) ... 45
Figure 2. 4. SLEUTH growth cycle ... 46
Figure 2. 5. Spontaneous growth example (Project Gigalopolis, 2018) ... 47
Figure 2. 6. New spreading center growth example (Project Gigalopolis, 2018) ... 47
Figure 2. 7. Edge growth example (Project Gigalopolis, 2018) ... 48
Figure 2. 8. Road influenced example (Project Gigalopolis, 2018) ... 49
Figure 2. 9. Self-modification (Project Gigalopolis, 2018) ... 50
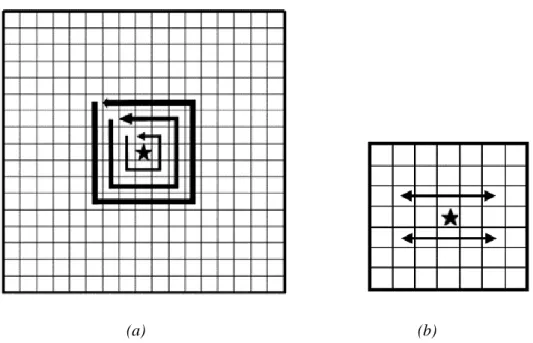
Figure 2. 10. a: Illustration of the search algorithm in the original SLEUTH (Jantz et al., 2010); b: Illustration of the search algorithm in the original SLETH-3r ... 52
x
Figure 2. 12. Process of creating the urban fabric scenarios ... 60
Figure 2. 13. Single dwellings (NSW Government, Australia, 2017) ... 61
Figure 2. 14. Low-rise housing (NSW Government, Australia, 2017) ... 61
Figure 2. 15. Shop top housing (NSW Government, Australia, 2017) ... 62
Figure 2. 16. Medium-rise housing and medium/high-rise housing (NSW Government, Australia, 2017) ... 62
Figure 2. 17. High-rise housing (NSW Government, Australia, 2017) ... 63
Figure 2. 18. Meaning of height attribute, content description (Content description of BD TOPO version 2.1, IGN) ... 63
Figure 2. 19. Building type matrix that is used in active land use pattern. The 3D matrix includes 9 maps. Each map corresponds to one type of building with specific height. The value of each layer is the average heights of the buildings with regards to the building type classification. ... 64
Figure 2. 20. Urban map of 2017, prospective urban growth map of 2050 and the simulated growth area during the 33 years growth cycle for Toulouse. ... 65
Figure 2. 21. Checking the first loop of neighbors around the new urban pixels in building type matrix ... 65
Figure 2. 22. Calculating the likelihood of each value for each pixel in the building type matrix ... 66
Figure 3. 1. France population profile, 1950 - 2050 (United Nations, 2018) ... 74
Figure 3. 2. Location and extent of the urban area of Toulouse ... 75
Figure 3. 3. Population map (INSEE, 2011) ... 77
Figure 3. 4. Toulouse urban map contains the undifferentiated and industrial buildings, 2017, IGN ... 78
Figure 3. 5. Slope, hillshade, transportation, urban and exclusion maps of Toulouse ... 79
Figure 3. 6. NEP exclusion map generated for Toulouse, 2017. In all excluded maps, the common areas between urbanized and excluded areas are considered as urbanized areas. ... 82
Figure 3. 7. LEP exclusion map generated for Toulouse, 2017. In all excluded maps, the common areas between urbanized and excluded areas are considered as urbanized areas. ... 84
Figure 3. 8. MEP exclusion map generated for Toulouse, 2017. In all excluded maps, the common areas between urbanized and excluded areas are considered as urbanized areas. ... 86
Figure 3. 9. EEP exclusion map generated for Toulouse, 2017. In all excluded maps, the common areas between urbanized and excluded areas are considered as urbanized areas. ... 88
Figure 3. 10. ALEP exclusion/attraction map generated for Toulouse, 2017. In all excluded maps, the common areas between urbanized and excluded areas are considered as urbanized areas. ... 90
Figure 3. 11. Historical urban maps of 2000 and 2017 and prospective urban maps that are simulated by different environmental protection scenarios for 2017, Toulouse ... 93
Figure 3. 12. Comparison of urban patches simulated by different environmental protection scenarios, 2017, Toulouse ... 94
Figure 3. 13. Comparison of the historical urban patch and corresponding prospective patch that is simulated by SLEUTH-3r through environmental protection scenario level 3 (EEP), Toulouse ... 95
Figure 3. 14. Urban map of 2050 and prospective urban maps for 2050, Toulouse ... 97
Figure 3. 15. Comparison of urban patches simulated by different environmental protection scenarios, 2050, Toulouse ... 98
xi
Figure 3. 16. Illustration of the average heights and the average surfaces of undifferentiated buildings classified
according to building types, Toulouse ... 102
Figure 3. 17. Simulated urban growth that are used in urban fabric scenarios, Toulouse ... 107
Figure 3. 18. Urban sprawl via the urban fabric scenarios to locate 55% urban population growth, Toulouse 108 Figure 3. 19. Location and extent of the urban area of Saint Sulpice la Pointe study area... 109
Figure 3. 20. Slope, hillshade, transportation, urban and exclusion maps of Saint Sulpice la Pointe ... 111
Figure 3. 21. NEP exclusion map generated for Saint Sulpice la Pointe, 2017. The excluded areas include the remarkable buildings, cemeteries, airfields, sport grounds; railways stations, triage areas; activity areas (administrative, culture and leisure, education, water management, industrial or commercial, health, sports and transport) and national parks; that are shown in red and the water surfaces that are represented in blue. They take the value of 100 and the others take the value of 50... 112
Figure 3. 22. LEP exclusion map generated for Saint Sulpice la Pointe, 2017. The excluded areas indicate the remarkable buildings, cemeteries, airfields, sport grounds; railways stations, triage areas; activity areas (administrative, culture and leisure, education, water management, industrial or commercial, health, sports and transport) and national parks that are shown in red, the water surfaces represented in blue and the closed forests areas (wood land, closed coniferous forest, closed deciduous forest, mixed closed forest and tree area) in dark green. They take the value of 100 and the others take the value of 50. ... 113
Figure 3. 23. MEP exclusion map generated for Saint Sulpice la Pointe, 2017. The excluded map contains all parks, protected areas and water bodies have made from the database of the IGN for 2017 including the remarkable buildings, cemeteries, airfields, sport grounds; railways stations, triage areas; activity areas (administrative, culture and leisure, education, water management, industrial or commercial, health, sports and transport) and national parks that are shown in red, the water surfaces represented in blue, the close forest areas (wood land, closed coniferous forest, closed deciduous forest, mixed closed forest and tree area) in dark green (value 100) and the open forest, hedge, woody heath, peupleraie, orchard, vine in light green (value 75). ... 114
Figure 3. 24. EEP exclusion map generated for Saint Sulpice la Pointe, 2017. The excluded map contains the remarkable buildings, cemeteries, airfields, sport grounds; railways stations, triage areas; activity areas (administrative, culture and leisure, education, water management, industrial or commercial, health, sports and transport) and national parks that are shown in red, the water surfaces represented in blue, the close forest areas (wood land, closed coniferous forest, closed deciduous forest, mixed closed forest and tree area) in dark green and the open forest, hedge, woody heath, peupleraie, orchard, vine in light green. All excluded areas take the value of 100 and the others take the value of 50. ... 115
Figure 3. 25. ALEP exclusion/attraction map generated for Saint Sulpice la Pointe, 2017. Four concentric zones with different attraction rates, make attraction force to the center. The areas in distances of seven pixels (~ 210m) around water surfaces are considered as attraction areas for dwelling as well. The LEP exclusion map is used for the excluded areas. ... 116
Figure 3. 26. Historical urban maps of 2000 and 2017 and prospective urban maps that are simulated by different environmental protection scenarios for 2017, Saint Sulpice la Pointe ... 118
Figure 3. 27. Comparison of the historical urban patch and corresponding prospective patch that is simulated by SLEUTH-3r through environmental protection scenario level 3 (EEP), Saint Sulpice la Pointe ... 119
Figure 3. 28. Urban map of 2050 and prospective urban maps for 2050, Saint Sulpice la Pointe ... 121
Figure 3. 29. Location and extent of the urban area of Rieucros study area ... 125
xii
Figure 3. 31. NEP exclusion map generated for Rieucros, 2017. The excluded areas include the remarkable buildings, cemeteries, airfields, sport grounds; activity areas (administrative, culture and leisure, education, water management, industrial or commercial, health, sports and transport) and national parks; that are shown in red and the water surfaces that are represented in blue. They take the value of 100 and the others take the
value of 50. ... 128
Figure 3. 32. LEP exclusion map generated for Rieucros, 2017. The excluded areas indicate the remarkable buildings, cemeteries, airfields, sport grounds; activity areas (administrative, culture and leisure, education, water management, industrial or commercial, health, sports and transport) and national parks that are shown in red, the water surfaces represented in blue and the closed forests areas (wood land, closed coniferous forest, closed deciduous forest, mixed closed forest and tree area) in dark green. They take the value of 100 and the others take the value of 50. ... 129
Figure 3. 33. MEP exclusion map generated for Rieucros, 2017. The excluded map contains all parks, protected areas and water bodies have made from the database of the IGN for 2017 including the remarkable buildings, cemeteries, airfields, sport grounds; activity areas (administrative, culture and leisure, education, water management, industrial or commercial, health, sports and transport) and national parks that are shown in red, the water surfaces represented in blue, the close forest areas (wood land, closed coniferous forest, closed deciduous forest, mixed closed forest and tree area) in dark green (value 100) and the open forest, hedge, woody heath, peupleraie, orchard, vine in light green (value 75). ... 130
Figure 3. 34. EEP exclusion map generated for Rieucros, 2017. The excluded map contains the remarkable buildings, cemeteries, airfields, sport grounds; activity areas (administrative, culture and leisure, education, water management, industrial or commercial, health, sports and transport) and national parks that are shown in red, the water surfaces represented in blue, the close forest areas (wood land, closed coniferous forest, closed deciduous forest, mixed closed forest and tree area) in dark green and the open forest, hedge, woody heath, peupleraie, orchard, vine in light green. All excluded areas take the value of 100 and the others take the value of 50. ... 131
Figure 3. 35. ALEP exclusion/attraction map generated for Rieucros, 2017. Four concentric zones with different attraction rates, make attraction force to the center. The areas in distances of seven pixels (~140m) around water surfaces are considered as attraction areas for dwelling as well. The LEP exclusion map is used for the excluded areas. ... 132
Figure 3. 36. Historical urban maps of 2000 and 2017 and prospective urban maps that are simulated by different environmental protection scenarios for 2017, Rieucros ... 134
Figure 3. 37. Comparison of the historical urban patch and corresponding prospective patch that is simulated by SLEUTH-3r through environmental protection scenario level 3 (EEP), Rieucros ... 135
Figure 3. 38. Urban map of 2050 and prospective urban maps for 2050, Rieucros ... 137
Figure 3. 39. Urban growth simulation of Saint Sulpice la Pointe study area according to two different pixels size ... 142
Figure 4. 1. The five LoDs of the OGC CityGML (source: KIT Karlsruhe, K.-H. Häfele, Gröger et al., 2012) 147 Figure 4. 2. The 3D building representation procedure ... 150
Figure 4. 3. An example of geo-referencing the SLEUTH output map Saint Sulpice la Pointe (EEP simulation scenario, 2050) ... 152
Figure 4. 4. A schema of eliminating the null pixels ... 153
Figure 4. 5. Orientation of a polygon, R1 and R2 are the local and overall references respectively ... 154
Figure 4. 6. Python code used for orientation ... 155
Figure 4. 7. An example of subdividing a polygon to smaller squares ... 156
xiii
Figure 4. 9. Definition of river proximity constraint ... 157
Figure 4. 10. Removed overlap areas of the polygons ... 158
Figure 4. 11. An example of the polygons and the squares identifiers, case study of Toulouse ... 159
Figure 4. 12. Assembling sub pixels respecting the roads ... 161
Figure 4. 13. Create the building footprints by making different erosion to each polygon according to the scenarios, Rieucros ... 162
Figure 4. 14. Create the building footprints by making different erosion to each polygon according to the scenarios, Saint Sulpice la Pointe ... 162
Figure 4. 15. Create the building footprints by making different erosion to each polygon according to the scenarios, Toulouse ... 163
Figure 4. 16. Searching for the nearest neighbor ... 164
Figure 4. 17. The algorithm of calculating the probability of the height for each building according to the building types and urban fabric scenario ... 165
Figure 4. 18. 2D and 3D views, medium/high dense fabric scenario (13 growth cycle), Rieucros ... 166
Figure 4. 19. 2D and 3D views, medium dense urban fabric scenario (18 growth cycle), Rieucros ... 166
Figure 4. 20. 2D and 3D views, low dense urban fabric scenario (23 growth cycle), Rieucros ... 167
Figure D. 1. Giving weight to the urban area using concentric zone model, Toulouse ... 210
Figure D. 2. Giving weight to the urban area using sector model, Toulouse ... 211
Figure D. 3. Giving weight to the urban area using multiple nuclei model, Toulouse ... 212
Figure D. 4. The urban maps with different height that used to create particular complex pattern ... 213
xv
List of tables
Table 1. 1. Distribution of the area of mainland France by nature of occupancy according to Corine Land Cover 2006 (corrected data) and 2012. (ESCo, 2017, section 1, p. 20; Source: SOeS, MTES) ... 19
Table 1.2. Distribution of the area of mainland France by nature of occupancy according to Teruti-Lucas surveys 2006 and 2014. (ESCo, 2017, section 1, p. 22; Source: SSP (Service de la Statistique et de la
Prospective) – MAA (Ministère de l'Agriculture et de l'Alimentation)) ... 19
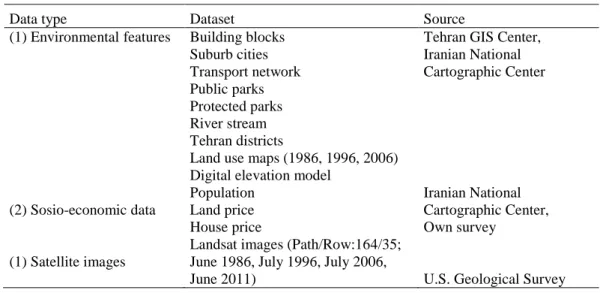
Table 1. 3. Description of the collected geospatial and socio-economic data; (Arsanjani et al., 2013) ... 30
Table 1. 4. Compare the validity of simulation models; (Kamusoko and Gamba, 2015) ... 34
Table 2. 1. Metrics that can be used to evaluate the goodness of fit of the basic SLEUTH model (Dietzel and Clarke, 2007) ... 54
Table 2. 2. New fit metrics available in SLEUTH-3r (Jantz et al., 2010) ... 55
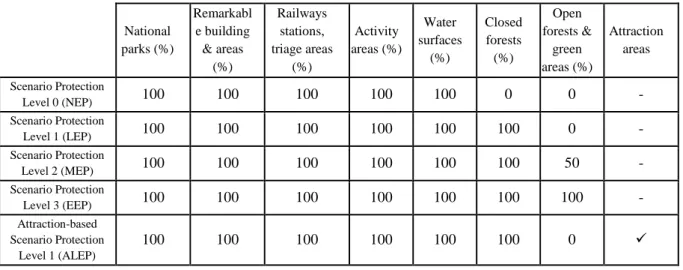
Table 2. 3. The percentage of the environment protection for excluded areas and the attractive areas considered in the environmental protection scenarios ... 59
Table 2. 4. Primary urban fabric scenarios for Toulouse study area. ... 68
Table 3. 1. Percentage of the urban population residing in Toulouse, (United Nations, 2018) ... 76
Table 3. 2. Changes in physical occupation between 2006 and 2014 in Midi-Pyrénées region (309080 points), Teruti-Lucas ... 81
Table 3. 3. Dispersion coefficient (DM) multiplier per environmental protection scenario, Toulouse... 91
Table 3. 4. Best-fit coefficient values driven from calibration process of SLEUTH-3r, Toulouse ... 92
Table 3. 5. Urban growth simulated results obtained from different environmental protection scenarios and the comparison of the results to the observed map of 2017, Toulouse... 96
Table 3. 6. Urban growth simulated results obtained from different environmental protection scenarios for 2050, Toulouse. ... 99
Table 3. 7. Number, area and height of undifferentiated buildings according to our building classification, Toulouse ... 101
Table 3. 8. Number, area and height of industrial buildings, Toulouse ... 101
Table 3. 9. Estimation of the average number of inhabitant for each type of buildings, Toulouse ... 104
Table 3. 10. Comparing the population growth of four different primary urban fabric scenarios, Toulouse .... 105
Table 3. 11. Urban fabric scenarios comparison according to the growth cycle to have similar rate of increased population. The gray column represents the population increasing of low dense urban fabric scenario during 33-growth cycle that is closer to the existing urban fabric, Toulouse ... 106
Table 3. 12. Dispersion coefficient (DM) multiplier per environmental protection scenario, Saint Sulpice la
xvi
Table 3. 13. Best-fit coefficient values driven from calibration process of SLEUTH-3r, Saint Sulpice la Pointe
... 117
Table 3. 14. Urban growth simulated results obtained from different environmental protection scenarios and the comparison of the results to the observed map of 2017, Saint Sulpice la Pointe ... 120
Table 3. 15. Urban growth simulated results obtained from different environmental protection scenarios for 2050, Saint Sulpice la Pointe. ... 122
Table 3. 16. Number, area and height of undifferentiated buildings according to our building classification, Saint Sulpice la Pointe. ... 122
Table 3. 17. Estimation of the average number of inhabitants for each type of buildings, Saint Sulpice la Pointe. ... 123
Table 3. 18. Comparing the population growth of four different primary urban fabric scenarios, Saint Sulpice la Pointe. ... 123
Table 3. 19. Urban fabric scenarios comparison according to the growth cycle to have similar rate of increased population. The gray column represents the population increasing of low dense urban fabric scenario during 33-growth cycle that is closer to the existing urban fabric, Saint Sulpice la Pointe. ... 124
Table 3. 20. Dispersion coefficient (DM) multiplier per environmental protection scenario, Rieucros ... 133
Table 3. 21. Best-fit coefficient values driven from calibration process of SLEUTH-3r, Rieucros ... 133
Table 3. 22. Urban growth simulated results obtained from different environmental protection scenarios and the comparison of the results to the observed map of 2017, Rieucros ... 136
Table 3. 23. Urban growth simulated results obtained from different environmental protection scenarios for 2050, Rieucros. ... 138
Table 3. 24. Number, area and height of undifferentiated buildings according to our building classification, Rieucros. ... 138
Table 3. 25. Estimation of the average number of inhabitant for each type of buildings, Rieucros. ... 139
Table 3. 26. Comparing the population growth of five different primary urban fabric scenarios, Rieucros. ... 139
Table 3. 27. Urban fabric scenarios comparison according to the growth cycle to have similar rate of increased population. The gray column represents the population increasing of low dense urban fabric scenario during 33-growth cycle that is closer to the existing urban fabric, Rieucros. ... 140
Table 4. 1. Number and the area of the current buildings classified based on the building types ... 155
Table 4. 2. Pixel identifiers description ... 159
Table 4. 3. Area of the new building foot prints buildings classified based on the building types ... 160
Table A. 1. Examples of the applications of urban growth and LUCC models, divided into four groups including fractal modeling, artificial neural network modeling, agent-based modeling and cellular automata modeling. 175 Table C. 1. Dispersion coefficient multiplier, scenario protection level 0 (Nearly No Environmental Protection - NEP), Toulouse ... 198
Table C. 2. Dispersion coefficient multiplier, scenario protection level 1 (Limited Environmental Protection - LEP), Toulouse ... 198
Table C. 3. Dispersion coefficient multiplier, scenario protection level 2 (Moderate Environmental Protection - MEP), Toulouse ... 198
xvii
Table C. 4. Dispersion coefficient multiplier, scenario protection level 3 (Extreme Environmental Protection - EEP), Toulouse ... 199
Table C. 5. Dispersion coefficient multiplier, attraction-based scenario protection level 1 (Attraction-based Limited Environmental Protection - ALEP), Toulouse ... 199
Table C. 6. Dispersion coefficient multiplier, scenario protection level 0 (Nearly No Environmental Protection - NEP), Saint Sulpice la Point ... 199
Table C. 7. Dispersion coefficient multiplier, scenario protection level 1 (Limited Environmental Protection - LEP), Saint Sulpice la Point... 200
Table C. 8. Dispersion coefficient multiplier, scenario protection level 2 (Moderate Environmental Protection - MEP), Saint Sulpice la Point ... 200
Table C. 9. Dispersion coefficient multiplier, scenario protection level 3 (Extreme Environmental Protection - EEP), Saint Sulpice la Point ... 200
Table C. 10. Dispersion coefficient multiplier, attraction-based scenario protection level 1 (Attraction-based Limited Environmental Protection - ALEP), Saint Sulpice la Point ... 201
Table C. 11. Dispersion coefficient multiplier, scenario protection level 0 (Nearly No Environmental Protection - NEP), Rieucros ... 201
Table C. 12. Dispersion coefficient multiplier, scenario protection level 1 (Limited Environmental Protection - LEP), Rieucros ... 201
Table C. 13. Dispersion coefficient multiplier, scenario protection level 2 (Moderate Environmental Protection - MEP), Rieucros ... 202
Table C. 14. Dispersion coefficient multiplier, scenario protection level 3 (Extreme Environmental Protection - EEP), Rieucros ... 202
Table C. 15. Dispersion coefficient multiplier, attraction-based scenario protection level 1 (Attraction-based Limited Environmental Protection - ALEP), Rieucros ... 202
Table C. 16. Calibration coefficients, scenario protection level 0 (Nearly No Environmental Protection - NEP), Toulouse ... 203
Table C. 17. Calibration coefficients, scenario protection level 1 (Limited Environmental Protection - LEP), Toulouse ... 203
Table C. 18. Calibration coefficients, scenario protection level 2 (Moderate Environmental Protection - MEP), Toulouse ... 204
Table C. 19. Calibration coefficients, scenario protection level 3 (Extreme Environmental Protection - EEP), Toulouse ... 204
Table C. 20. Calibration coefficients, attraction-based scenario protection level 1 (Attraction-based Limited Environmental Protection - ALEP), Toulouse ... 204
Table C. 21. Calibration coefficients, scenario protection level 0 (Nearly No Environmental Protection - NEP), Saint Sulpice la Point ... 204
Table C. 22. Calibration coefficients, scenario protection level 1 (Limited Environmental Protection - LEP), Saint Sulpice la Point ... 205
Table C. 23. Calibration coefficients, scenario protection level 2 (Moderate Environmental Protection - MEP), Saint Sulpice la Point ... 205
Table C. 24. Calibration coefficients, scenario protection level 3 (Extreme Environmental Protection - EEP), Saint Sulpice la Point ... 205
Table C. 25. Calibration coefficients, attraction-based scenario protection level 1 (Attraction-based Limited Environmental Protection - ALEP), Saint Sulpice la Point ... 205
xviii
Table C. 26. Calibration coefficients, scenario protection level 0 (Nearly No Environmental Protection - NEP), Rieucros ... 206
Table C. 27. Calibration coefficients, scenario protection level 1 (Limited Environmental Protection - LEP), Rieucros ... 206
Table C. 28. Calibration coefficients, scenario protection level 2 (Moderate Environmental Protection - MEP), Rieucros ... 206
Table C. 29. Calibration coefficients, scenario protection level 3 (Extreme Environmental Protection - EEP), Rieucros ... 206
Table C. 30. Calibration coefficients, attraction-based scenario protection level 1 (Attraction-based Limited Environmental Protection - ALEP), Rieucros ... 207
1
Résumé
L'urbanisation est principalement due à la croissance démographique, à l'exode rural vers villes et au changement de mode de vie. Ce processus augmente les terres artificielles, qui affectent la biodiversité, les écosystèmes, le climat urbain et réduit les terres pour l'agriculture et les espaces naturels.
L'objectif de cette thèse est de proposer des solutions pour simuler divers scénarios d'urbanisation afin d'améliorer la prise de décision en matière de politiques publiques. Pour ce faire, le modèle SLEUTH est utilisé afin d’évaluer l’impact des types de bâtiments et des règles environnementales sur l’étalement urbain. Dans la méthode utilisée, SLEUTH intègre davantage des données topographiques, des données sur les tissus urbains et démographiques, y compris des caractéristiques géographiques et des contraintes environnementales. Le principal défi de cette recherche est de proposer différents scénarios d'étalement urbain pour plusieurs types de règles environnementales tout en tenant compte du besoin des habitants ou du moins d'une estimation de la croissance de la population.
Le modèle SLEUTH est l’un des modèles de simulation d’automates cellulaires bien connus, qui correspond à la simulation dynamique de l’expansion urbaine et s’adapte au modèle morphologique de la configuration urbaine. SLEUTH, comme beaucoup d'autres méthodes de simulation de la croissance urbaine, ne considère que les données historiques. Bien que les impacts de la croissance démographique et du tissu urbain soient implicitement pris en compte lors de la phase d'étalonnage sur les cartes urbaines historiques, il est impossible d'inclure les changements de taux de croissance démographique ou de types de bâtiments dans les simulations. De plus, les résultats de SLEUTH se limitent à des données matricielles difficiles à interpréter pour les décideurs. Les résultats sont des pixels, sur lesquels une urbanisation est supposée se produire, ce qui a peu de sens du point de vue de l’urbanisme. Par conséquent, notre recherche vise à diversifier les possibilités de simulation en intégrant explicitement le facteur des types de bâtiments en fonction de la croissance de la population et en fournissant des modèles de visualisation des résultats de scénarios de croissance urbaine en 2D et même en 3D.
Afin d'améliorer les résultats de SLEUTH, différents scénarios de simulation de croissance urbaine en 2D ont été définis sur la base du modèle SLEUTH en ajoutant le type de bâtiment et l'estimation de la croissance démographique en tant que facteurs du tissu urbain. Chaque simulation correspond à des politiques plus ou moins restrictives en espaces considérant ce que ces territoires peuvent accueillir en tant que type de bâtiment et en tant que population globale. De plus, les simulations peuvent aider l’utilisateur à protéger les terrains souhaités, tels que les espaces environnementaux, de l’urbanisation. Ces scénarios montrent la force de la simulation du modèle et permettent d’améliorer notre compréhension de l’étalement urbain.
Trois études de cas de tailles et de populations différentes sont utilisées, Toulouse Métropole, Saint Sulpice la Pointe et Rieucros, afin de donner une idée de l'efficacité de la méthode
2 proposée à plusieurs échelles. L'évaluation des résultats indique que la méthode proposée est capable d’effectuer différentes simulations correspondant à plusieurs priorités et contraintes foncières. Il est utile de voir quels terrains peuvent être protégés (où) et quel type de bâtiment peut être utilisé pour limiter l'étalement urbain (combien). Une représentation en 3D de chaque simulation de croissance urbaine est fournie afin de faciliter l'interprétation de la simulation SLEUTH et de différencier les scénarios. Les résultats permettent d’avoir plusieurs images de la ville de demain pour l’appliquer aux politiques urbaines.
Mots-clés: urbanisation, étalement urbain, simulation, modèle de SLEUTH basé sur des scénarios, tissu urbain, constructibilité, SLEUTH-3r, systèmes d'information géographique (SIG), politique de la ville
3
Abstract
The process of urbanization occurs mainly due to population growth, rural exodus to cities and life style that often induces the nearly irreversible changes. It increases the artificial lands, which affect the biodiversity, ecosystems, urban climate, and reduces land for agriculture and natural areas.
The focus of this thesis is to simulate diverse urbanization scenarios in order to improve public policies decision making. To do this, the SLEUTH model is used in order to investigate the impacts of building types and environmental rules on urban sprawl. In the method used, the SLEUTH model integrates more topographic data, urban tissue and demographic data, including geographical features and the environmental constraints. The main challenge in this research is to propose different urban sprawl scenarios for different kind of environmental rules while taking into account the population demand or at least population growth estimation.
The SLEUTH model is one of the well-known cellular automata simulation models, which matches the dynamic simulation of urban expansion and adapts to morphological model of the urban configuration. SLEUTH, like many other urban growth simulation methods, considers only the historical data. Although, the impacts of population growth and urban tissue are implicitly considered during the calibration phase on the historical urban maps, changes in population growth rate or in building types cannot be included in its simulations. Moreover, the SLEUTH results are limited to raster data that are difficult to interpret for decision makers. The results are some pixels on which urbanization is supposed to occur, which do not make much sense from urbanism point of view. Therefore, our research aims to diversify the simulation possibilities integrating explicitly factors of building types according to population growth and providing visual methods to view urban growth scenario results in 2D and even 3D.
In order to improve the SLEUTH results, different 2D urban growth simulation scenarios have been defined based on the SLEUTH model by adding buildings type and the estimation of the population growth as urban fabric factors. Each simulation corresponds to policies that are more or less restrictive of spaces considering what these territories can accommodate as a type of building and as a global population. In addition, the simulations can help the user to protect the desired lands such as the environmental spaces from urbanization. These scenarios show the simulation capabilities of the model and make it possible to improve our understanding of an urban sprawl simulation.
Three different case studies with various sizes and populations are used including Toulouse metropolitan, Saint Sulpice la Pointe and Rieucros to provide a view of the effectiveness of the proposed method on several scales. The results evaluation indicates that the proposed method makes different simulations that correspond to different land priorities and constraints. It helps to see which land can be protected (where) and how building type can be used to constrain
4 urban sprawl (how much). A 3D representation for each prospective urban growth simulations is provided in order to facilitate the interpretation of the SLEUTH simulation and differentiate the scenarios. The findings allow having different images of the city of tomorrow for applying it to urban policies.
Keywords: Urbanization, urban sprawl, simulation, scenario-based SLEUTH model, urban fabric, Constructability, SLEUTH-3r, Geographical Information Systems (GIS), Urban policy
5
Introduction
The process of urbanization occurs mainly due to population growth, rural exodus to cities and life-style which often induces the nearly irreversible changes because of the land take phenomena and increases the artificial lands. It affects the biodiversity, ecosystems, urban climate, and agriculture and natural areas. The balance between land protection and urbanization is an environmental and social concerns of the public authorities. This can be achieved by providing security, welfare and social services to residents, as well as respecting the environment and biodiversity. Although, the latter played a significant role in reducing pollution and physical and mental needs of the inhabitants as well. The main challenge in this research is to propose different urban sprawl scenarios for different kind of environmental rules while consider population demand or at least population growth estimation.
The compact cities preserve the soil, reduce some environmental impacts of urbanization and decrease greenhouse gas emissions by reducing travel as well as often decrease the construction cost. These objectives can be achieved by densification which increases the height of buildings. Land use densification is a specific target of many land use policies in most OECD countries (the Organization for Economic Co-operation and Development, 2017), however for many reasons it may effects on the urban environment and the population welfare e.g. decreasing the residential area, reducing sunlight, runoff problems, creating of heat islands, and reducing the amenities associated with open spaces as well as reducing the people privacy (ESCo, Expertise Scientifique Collective, 2017, sections 5, p.78).
The objective of this thesis is to generate diverse urbanization scenarios in order to improve public policies decision making. To do this, SLEUTH modeling improvement is proposed that integrates more topographic data, urban tissue and demographic data while respects geographical features and the environmental constraints. SLEUTH’s acronym is derived from its data input requirements: Slope, Land use, Exclusion, Urban, Transportation and Hillshade. This model is used in order to investigate the impacts of building types and environmental rules on urban sprawl.
Many studies, using various modeling approaches and simulation tools have been made in the field of urban growth. Among all dynamic and spatially explicit models, those based on Cellular Automata (CA) are common for their applications in urban areas. This can be explained by the spatially explicit character and dynamic behavior of cellular automata models. Simplicity, flexibility, intuitiveness, transparency, the ability to incorporate the spatial, temporal dimensions of the processes and capability of modeling complex dynamic systems such as urban systems, are some features of CA modeling. CA can be easily integrated with Geographical Information Systems (GIS) to have a high spatial resolution model with
6 computational efficiency. In addition, nonlinearity of the iterative process of CA leads to regular fractal patterns, i.e. to regular and ordered spatial patterns that generate similar geometries at different scales. The SLEUTH model is one of the cellular automata models that can simulate the dynamic nature of urban expansion and can be compatible with urban environment modeling.
From geographical point of view, a city appears as an agglomeration of buildings and people, essentially different from agricultural lands. A city is composed of the agglomeration of geographical and social environment that is formed by structures and residents, and can be defined by the occupied space and the social relationships it creates. The constructions as spatial objects represent the coalescence and the social environment demonstrate the coherence of the city. These spatial and social agglomerations make an interesting indicator to understand the scale and the evolution of the cities (Antoni, 2003).
SLEUTH, like many other urban growth simulation methods, uses the historical data in order to calibrate the model. Although the impacts of population growth and urban tissue are implicitly considered during the calibration phase of SLEUTH, the changes in population growth rate or in building types cannot be included in its simulations. Moreover, the SLEUTH results are limited to some raster data that is difficult to interpret for decision makers. The results are some pixels on which urbanization is supposed to occur, which do not make much sense from urbanism point of view. The research presented in this thesis aims to challenge the results of the classical urban growth methods that are often independent from the factors of building types and population, and gives an improvement to provide a more reliable method. In SLEUTH model, a simulation is made up of a series of growth cycles where each cycle represents a year of growth. The rhythm of growth is calibrated by means of historical data and the model is based on learning and therefore it will reproduce the same tendency as today (same type of building). Therefore, it seems interesting to integrate some new effective factors such as estimated population, building types and more topographic data in order to improve the number and location of simulated pixels per growth cycle. In order to integrate the demography and building types, the buildings are classified to different residential categories considering their height and configuration to study the Human Settlement Capacity (HSC). The results of the proposed method lead to different simulations that are related to different land priorities and constraints.
In this research, common data (such as topographic, buildings and demography data) are used in order to create different types of scenarios according to urban policies, while remaining realistic. Integrating the additional data leads hopefully to better parameterization of the model. Given that we know the prediction of urban growth is an indeterminate proposition, several prospective scenarios based on the new model parametrizations are defined related to different urban area (the Toulouse metropolitan, Saint Sulpice la Pointe that is a town around Toulouse, and Rieucros as a small community in a rural area), in order to query the simulation ability in different scale. These scenarios show the simulation capabilities of the model and make it possible to improve our understanding of an urban sprawl simulation. The simulation results of
7 the three different case studies with various sizes and populations provide a good view of the scalability of the proposed method and the findings allow having different images of the city of tomorrow to choose and reflect on urban policies. In urban modeling, proposing different simulation of urban sprawl is fundamental because it shows the possible impact of urban sprawl but also the capacity of urban settlement according to different scenario.
In this thesis, the prospective urban growth simulations are compared while keeping the same population growth rate for the desired forecasting date. Moreover, the demographic capacity in each scenario in both dense and sprawl cities are calculated and compared. The purpose of the thesis is to provide a way to simulate urban growth, with less semantic information loss, and to show the differences of sprawl and dense growth, by integrating topographic data, demographic, and building types with the CA model.
Least, a 3D representation for each prospective urban growth simulations is provided to facilitate the interpretation of the SLEUTH simulation, to better understand the SLEUTH simulation results and to differentiate the scenarios, in order to support the scientists and authorities in charge of urban planner and management.
In this research, we use SLEUTH model that sounds good, but from our perspective it's not good enough. SLEUTH produces square areas (raster files) on which urbanization is supposed to occur. There is no further information from these new urban areas, and their purposes and uses are unclear. In addition, we do not know their meaning in terms of urban fabric. We have faced many challenges in this research, though the most critical issue is how to propose different urban sprawl scenarios for different kind of environmental rules. In addition, considering population demand (or at least population growth estimates) is another important challenge. With the objectives mentioned above, the thesis starts with raising the following questions about the evolutionary trajectory of urbanization as well as densification:
What are the urbanization and densification?
Why doing urban sprawl simulation, while we know that all simulations are fictions and they are based on some assumptions?
Achievements
Urban sprawl phenomena is a big challenge for the authorities and urban planners. We have proposed a way to improve simulated urban sprawl using topographic data and
population density for results analysis.
The results demonstrate that the urban growth is widely dependent to building type (urban fabric) and population growth. Classification of the building types and the estimation of the population growth try to provide required amount of urban growth, and the protection rules attempt to regulate the location of growth areas.
In fact, urban growth simulations can be used to see what can happen in the future; how will be the housing, population growth and land cover changes and where can occur. These simulations
8 can help us find and protect some areas against artificialization and urbanization. Moreover, they can be used to think about future urbanization and make choices on urban policies.
Thesis Structure
This thesis consists of 5 chapters intended to explore the optimization of SLEUTH as an urban growth cellular automata. The work aims to obtain a better parameterization of urban growth in order to demonstrate the impacts of constructions and environmental constraints on urban sprawl by integrating more topographic data, urban fabric and demographic data. Major themes are developed in this work and an original contribution is proposed. A brief introduction is presented at the beginning of each chapter to guide the reader before tackling the main subject. In the same spirit, each chapter ends with a discussion of the content. The structure of the thesis process flow is illustrated in the figure I. Below, the structure of the thesis is presented with an overview of each subsequent chapter.
Figure I. Structure of the thesis process flow
Chapter 1 gives a brief overview of urbanization and land artificialization in order to understand the strengths and tendencies of the urbanization process. In this chapter, determinants and the impacts of urbanization are discussed. In addition, a brief review of the state-of-the-art in some academic research and urban planning practices is presented, to explore land use pattern and urban simulation techniques.
Chapter 2 describes the thesis methodology and fundamentals for model construction including the reason to choose the model, the scenarios considered, the factors used to optimize the model and the implementation of the proposed model.
Chapter 3 dedicates to the case studies and applications including the implementation of our model on three different study areas, providing the results, evaluating them and make a discussion of the obtained results.
Chapter 4 explores the 3D illustration of the urban growth scenarios in order to better understand the simulation results, to facilitate the interpretation of the SLEUTH simulation and to differentiate the scenarios. In this chapter, first the different 3D modeling tools and applications are reviewed. Next, a 3D proposal is represented in order to analyze the simulation model regarding to 3D.
Chapter 5 concludes the thesis by summarizing the results of the preceding research and discussing future work required in developing these methods.
9 Annex A represents, a list of methods in the domain of urban growth and land use and land cover changes (LUCC) modeling including their use cases, their applications and some of their capabilities and limitations.
Annex B describes the SLEUTH urban growth model process flow. One scenario file is represented in detail in this Annex.
Annex C illustrates the examples of the SLEUTH calibration files that are used to achieve dispersion coefficient multiplier and calibration best-fit coefficient.
Annex D represents the examples of weighting urban patches using predefined urban land use models. In this Annex, the examples of four predefined urban land use pattern contain concentric zone model, sector model, multiple nuclei model and particular complex model, for the study area of Toulouse are provided.
Annex E describes documentation of the National Institute of Statistics and Economic Studies (INSEE) data including the source, the generated information and the list and description of variables that are used in the population estimations and the urban fabric scenarios.
11
Chapter 1 : Urbanization and Urban Modeling
Contents
1.1. Urbanization 1.2. Urban Modeling 1.3. Chapter Conclusion
Urbanization is a process that leads to increase the size of cities. It occurs mainly due to population growth, rural exodus to cities and life style. The urbanization process often induces the nearly irreversible changes and increases the artificial lands. It affects the biodiversity, ecosystems, urban climate, and agriculture and natural areas. The balance between housing and land protection is one of the environmental and social concerns of the public authorities. This should be achieved by providing security, welfare and social services to residents as well as respecting the environment and biodiversity. The latter played a significant role in reducing pollution and physical and mental needs of the inhabitants as well.
Cities are shaped by urban expansion, migration, succession according to their geography and natural environments. In general, urban growth and mostly urban sprawl generates land artificialization and it changes the natural agricultural lands to residential housings. Urbanization is one of the most effective factors in expanding the artificialization the territories. This is why the tracking and controlling the artificial territories represent an important challenge for local authorities facing with objectives of sustainable development.
Many studies have been done in the field of urban growth, using various modeling approaches and simulation tools in order to spatially reconstruct the occupation and changes in land use. In this chapter, some different urban land use patterns are overviewed which can be considered as predefined patterns. Predefined patterns are static models that describe patterns of urban land use in a generic city. These patterns should be created manually for each study area according to the land use observations for that area.
In the last decades, various techniques have been predominantly used to simulate the urban growth and land use / land cover changes (LUCC). These techniques, their use cases and their applications are widespread. Therefore, choosing a well-fit method among them for a new case study is always a challenge for the urban planners and stakeholders. In the researches of this
12 thesis, an overview on some different techniques of urban growth and LUCC modeling is presented, which seeks to understand and document the state of the art of different simulation techniques and investigate their applications. From all various techniques, the fractal modeling, artificial neural network modeling, agent-based modeling and cellular automata modeling have been categorized and their use cases, their applications; and their capability and limitations are discussed. The classified list of different researches in this field is proposed in Annex A that could be used to provide an appropriate view for urban planners in the field of urban planning development. Some more used techniques and applications are reviewed in detail in this chapter.
In this chapter, first, a brief overview on urbanization is provided in section 1.1. The urban sprawl and artificialized lands, their characteristics and their impacts on environment and the human life are reviewed in this section. Then in section 1.2, some land use patterns and different techniques of urban growth and LUCC modeling are represented. The chapter is concluded in section 1.3.
1.1. Urbanization
The size of cities increased all over the world. The process, named urbanization is mainly due to population growth, rural exodus to cities and to life style. World urbanization prospects of department of economic and social affairs of United Nations (2018) demonstrate that in 2018, 55 % of the world’s population lived in urban areas and the coming decades the both global population growth and urbanization will continue in urban areas. Moreover, those projections show that urbanization and the population growth will cause to increase the urbanization to more than 66% in 2050 (see figure 1.1).
Figure 1. 1. Proportions of urban and rural world population, from 1950 to 2050; (United Nations, 2018)
13 Migrating population from rural to urban area has proceeded rapidly during last six decades. Suburbanization refers to shifting the residential area to outward. Suburban sprawl demonstrates a balance between the forces that are pushing people together in cities and those pushing them out. Some researches show that suburbanization has gone so far to form new points of concentration outside the downtown (Sridhar, 2007).
Regarding to definition provided from INSEE (the National Institute of Statistics and Economic Studies collects, produces, analyzes and disseminates information on the French economy and society), since 1954 in France, an urban unit is generally defined as a municipality or a group of municipalities that combines the continuity of buildings where the distance of two buildings are less than 200 meters and it has at least 2000 inhabitants. The surrounding commune of an urban unit is considered as urban and the other communes are considered as the rural communes. Later in 2010, other words are defined called urban centers (Pôles urbains in French). The urban centers are the subset of urban units that presents 10 000 jobs and are not the crown of other urban centers. Since October 2011, the zoning in urban areas (ZAU) provides a vision of the influence areas of cities, in the sense of urban units, on the territory. It divides the territory into four major types of spaces. One of them demonstrates mainly the rural spaces (e.g. small urban units and rural municipalities) and others represent urban spaces including the urban centers, the suburban peripheries and the multi-centric municipalities (INSEE).
Almost half of the European population lives in urban areas of less than 500,000 inhabitants. In fact, according to the provided definitions, Europe is an area of small towns with the distance of fifteen kilometers from each other (ESCo, 2017, introduction, p. 9). Nowadays, most of the countries cannot avoid the urban population growth and their rate of urbanization is increasing rapidly. In France, nearly 55% of urban residents in 1950 lived in one unit while this rate was increased to around 80% in 2018 and it will continued to 88% in 2050 that is comparable to other industrialized countries (United Nations, 2018) (see figure 1.2).
Figure 1. 2. Total population, urban population and urbanization rates from 1950 to 2050; (United Nations, 2018)