HAL Id: hal-02090969
https://hal.sorbonne-universite.fr/hal-02090969
Submitted on 5 Apr 2019
HAL is a multi-disciplinary open access
archive for the deposit and dissemination of
sci-entific research documents, whether they are
pub-lished or not. The documents may come from
teaching and research institutions in France or
abroad, or from public or private research centers.
L’archive ouverte pluridisciplinaire HAL, est
destinée au dépôt et à la diffusion de documents
scientifiques de niveau recherche, publiés ou non,
émanant des établissements d’enseignement et de
recherche français ou étrangers, des laboratoires
publics ou privés.
The spinal and cerebral profile of adult spinal-muscular
atrophy: A multimodal imaging study
Giorgia Querin, Mohamed-Mounir El Mendili, Timothee Lenglet, Anthony
Behin, Tanya Stojkovic, François Salachas, David Devos, Nadine Le Forestier,
Maria del Mar Amador, Rabab Debs, et al.
To cite this version:
Giorgia Querin, Mohamed-Mounir El Mendili, Timothee Lenglet, Anthony Behin, Tanya Stojkovic,
et al.. The spinal and cerebral profile of adult spinal-muscular atrophy: A multimodal imaging study.
Neuroimage-Clinical, Elsevier, 2019, 21, pp.101618. �10.1016/j.nicl.2018.101618�. �hal-02090969�
Contents lists available atScienceDirect
NeuroImage: Clinical
journal homepage:www.elsevier.com/locate/ynicl
The spinal and cerebral profile of adult spinal-muscular atrophy: A
multimodal imaging study
Giorgia Querin
a,1, Mohamed-Mounir El Mendili
a,b,1, Timothée Lenglet
c,d, Anthony Behin
e,
Tanya Stojkovic
e, François Salachas
c, David Devos
f,g, Nadine Le Forestier
c,h,
Maria del Mar Amador
c, Rabab Debs
c, Lucette Lacomblez
a,c, Vincent Meninger
i,
Gaëlle Bruneteau
c, Julien Cohen-Adad
j,k, Stéphane Lehéricy
l,m, Pascal Laforêt
n,u,
Sophie Blancho
o, Habib Benali
a,p, Martin Catala
c,q, Menghan Li
a, Véronique Marchand-Pauvert
a,
Jean-Yves Hogrel
r, Peter Bede
a,c,s,2, Pierre-François Pradat
a,c,t,⁎,2aSorbonne Université, CNRS, INSERM, Laboratoire d'Imagerie Biomédicale, Paris, France bIcahn School of Medicine at Mount Sinai, Department of Neurology, New York, USA cAPHP, Département de Neurologie, Hôpital Pitié-Salpêtrière, Centre référent SLA, Paris, France dAPHP, Hôpital Pitié-Salpêtriere, Service d'Explorations Fonctionnelles, Paris, France
eAPHP, Centre de Référence Maladies Neuromusculaires Paris-Est, Institut de Myologie, Hôpital Pitié-Salpêtrière, Paris, France
fDepartment of Neurology, ALS Centre, Lille University, INSERM UMRS_1171, University Hospital Centre, LICEND COEN Centre, Lille, France gDepartment of Medical Pharmacology, Lille University, INSERM UMRS_1171, University Hospital Centre, LICEND COEN Centre, Lille, France hDépartement de recherche en éthique, EA 1610: Etudes des sciences et techniques, Université Paris Sud/Paris Saclay, Paris, France iHôpital des Peupliers, Ramsay Générale de Santé, F-75013 Paris, France
jNeuroPoly Lab, Institute of Biomedical Engineering, Polytechnique Montreal, Montreal, QC, Canada kFunctional Neuroimaging Unit, CRIUGM, Université de Montréal, Montreal, QC, Canada lAPHP, Hôpital Pitié-Salpêtriere, Service de Neuroradiologie, Paris, France
mSorbonne Université, UMR-S975, Inserm U975, CNRS UMR7225, Centre de recherche de l'Institut du Cerveau et de la Moelle épinière – CRICM, Centre de Neuroimagerie
de Recherche – CENIR, Paris, France
nNeurology Department, Nord/Est/Ile de France neuromuscular center, Raymond-Poincaré Hospital, Garches, France oInstitut pour la Recherche sur la Moelle Epinière et l'Encéphale (IRME), Paris, France
pConcordia University, PERFORM Centre, Electrical & Computer Engineering Division, Canada qSorbonne Université, CNRS UMR7622, INSERM ERL 1156, IBPS, Paris, France
rInstitute of Myology, Neuromuscular Investigation Center, Paris, France
sComputational Neuroimaging Group, Academic Unit of Neurology, Trinity College Dublin, Ireland
tNorthern Ireland Centre for Stratified Medicine, Biomedical Sciences Research Institute Ulster University, C-TRIC, Altnagelvin Hospital, Derry, Londonderry, United
Kingdom
uINSERM U1179, END-ICAP, Versailles Saint-Quentin-en-Yvelines University, Montigny-le-Bretonneux
A R T I C L E I N F O
Keywords:
Spinal muscular atrophy SMA
Multimodal MRI Spinal cord MRI
Grey matter and white matter degeneration
A B S T R A C T
Spinal muscular atrophy (SMA) type III and IV are autosomal recessive, slowly progressive lower motor neuron syndromes. Nevertheless, wider cerebral involvement has been consistently reported in mouse models. The objective of this study is the characterisation of spinal and cerebral pathology in adult forms of SMA using multimodal quantitative imaging.
Methods: Twenty-five type III and IV adult SMA patients and 25 age-matched healthy controls were enrolled in a
spinal cord and brain imaging study. Structural measures of grey and white matter involvement and diffusion
https://doi.org/10.1016/j.nicl.2018.101618
Received 8 September 2018; Received in revised form 17 November 2018; Accepted 26 November 2018
Abbreviation: 6MWT, Six-minute walk test; AD, Axial diffusivity; ALS, Amyotrophic lateral sclerosis; CSA, cross-sectional area; CST, Corticospinal tract; DTI,
diffusion tensor imaging; EPI, Echo-planar imaging; FA, Fractional anisotropy; FDR, False discovery rate; FOV, Field-of-view; FWE, Familywise error; GM, Grey matter; HC, Healthy control; LL, Lower limb; LMN, Lower motor neuron; MD, mean diffusivity; MND, Motor neuron disease; MNI, Montreal Neurological Institute; MRC, Medical Research Council; RD, Radial diffusivity; ROI, Region-of-interest; SC, Spinal cord; SMA, Spinal muscular atrophy; SMAFRS, SMA functional rating scale; SMN1, Survival-motor-neuron 1 gene; TBSS, Tract-based spatial statistics; TE, Echo time; TFCE, Threshold-free cluster enhancement; TR, repetition time; UL, Upper limb; UMN, Upper motor neuron; VBM, Voxel-based morphometry; WM, White matter
⁎Corresponding author at: Département de Neurologie, 47 Boulevard de l'Hôpital, F-75634, Cedex 13, France.
E-mail address:pierre-francois.pradat@aphp.fr(P.-F. Pradat).
1Contributed equally as first co-authors. 2Contributed equally as senior co-authors.
Available online 28 November 2018
2213-1582/ © 2018 The Authors. Published by Elsevier Inc. This is an open access article under the CC BY-NC-ND license (http://creativecommons.org/licenses/BY-NC-ND/4.0/).
parameters of white matter integrity were evaluated at each cervical spinal level. Whole-brain and region-of-interest analyses were also conducted in the brain to explore cortical thickness, grey matter density and tract-based white matter alterations.
Results: In the spinal cord, considerable grey matter atrophy was detected between C2-C6 vertebral levels. In the
brain, increased grey matter density was detected in motor and extra-motor regions of SMA patients. No white matter pathology was identified neither at brain and spinal level.
Conclusions: Adult forms of SMA are associated with selective grey matter degeneration in the spinal cord with
preserved white matter integrity. The observed increased grey matter density in the motor cortex may represent adaptive reorganisation.
1. Introduction
Spinal muscular atrophy (SMA) is an autosomal recessive motor neuron disease (MND) characterised by lower motor neuron (LMN) degeneration (Faravelli et al., 2015) due to loss of function of the sur-vival-motor-neuron 1 (SMN1) gene (Lefebvre et al., 1995). SMA ex-hibits considerable clinical heterogeneity with four main phenotypes being distinguished based on age of onset and reaching of develop-mental milestones (Wadman et al., 2018). A key determinant of the clinical presentation is the SMN2 copy number, which is a more cen-tromeric and only partially functional copy of SMN1. Higher SMN2 copy numbers are thought to inversely correlate with disease severity (Elsheikh et al., 2009).
SMA type III is considered a relatively milder form of the disease with preserved acquisition of ambulation and is traditionally sub-divided into SMA IIIa, with onset before 3 years of age, and SMA IIIb (onset after the age of 3) (Piepers et al., 2008). SMA type IV refers to adult onset (Wadman et al., 2018;Piepers et al., 2008). Both forms have relatively slow (Bonati et al., 2017), non-linear (Wadman et al., 2018;
Deymeer et al., 2008) progression rates with tendency to plateau over time and usually present with proximal and symmetrical muscle weakness (Faravelli et al., 2015; Wadman et al., 2018). The patho-physiological mechanisms behind this distinct clinical phenotype are poorly understood, especially considering that SMN is a ubiquitously expressed protein (Zhang et al., 2008). Several explanations have been proposed for the strikingly localised effect of this protein deficiency, including the selective vulnerability of motor neuron pools (MN) in the spinal cord (SC) (Powis and Gillingwater, 2016;d'Errico et al., 2013). Despite these observations, post mortem studies of infantile SMA sug-gest that neuropathological involvement extends well beyond MN de-generation in the anterior horns, and affect the posterior columns and cerebral regions such as the thalamus (Towfighi et al., 1985;Marshall and Duchen, 1975). Central nervous system (CNS) involvement has also been demonstrated in mouse models of SMA, with reduction of hip-pocampal volumes and motor cortex degeneration (Wishart et al., 2010). Nevertheless, CNS involvement has not been comprehensively studied in adult SMA patients to date and motor cortex and cortico-spinal tract (CST) degeneration have never been specifically evaluated. In recent years, SC imaging has seen unprecedented advances and has been successfully used in MNDs to characterise grey (Paquin et al., 2018) and white (Rasoanandrianina et al., 2017) matter pathology in cross-sectional, longitudinal (De Albuquerque et al., 2017) and prog-nostic studies (Querin et al., 2017;El Mendili et al., 2014). Despite the momentous technical advances in spinal imaging, only one SMA study confirmed SC atrophy using quantitative MRI (El Mendili et al., 2016). The objective of this study is the comprehensive characterisation of spinal and cerebral pathology using state-of-the-art quantitative ima-ging tools in a cohort of type III and type IV SMA patients. Our main hypothesis is that advanced spinal imaging techniques can detect and characterise GM pathology. A secondary hypothesis is that limited WM pathology will be captured. Finally, based on evidence from animal studies and other MNDs, cerebral pathology is also suspected.
2. Methods
2.1. Study population
Twenty-five genetically confirmed type III (n = 19) and type IV (n = 6) SMA patients and 25 gender- and age-matched healthy controls (HCs) were recruited in a prospective multimodal spinal and cerebral neuroimaging study (NCT0288587). The study protocol was approved by the Ethics Committee of the Pitié-Salpêtrière University Hospital (Paris) and all the participants provided informed consent. All the procedures included in the protocol were conducted in accordance with the Helsinki declaration.
The patients underwent genetic testing, confirming the diagnosis of SMN1-related SMA. Based on current consensus criteria (Mercuri et al., 2018), patients were diagnosed as SMA type III if symptom onset was after 18-month of age and if they learnt to walk on time. Patients with onset before 3 years were diagnosed with SMA type IIIa, while patients with onset between 3 and 18 years of age were diagnosed with SMA type IIIb. Patients with symptom onset after 18 years of age where considered as having SMA type IV (Wang et al., 2017).
Exclusion criteria included prior CNS pathology and presence of medical devices incompatible with high-field MR imaging.
2.2. Neuromuscular evaluation
All participants underwent standardized neurological assessment including muscle strength evaluation through the Medical Research Council (MRC) scores in the deltoid, biceps brachii, triceps brachii, extensor carpi, opponens pollicis and flexor digitorum profundus muscles for upper limbs (UL) and in the iliopsoas, hip abductors, quadriceps femoris, hamstrings, anterior tibialis, gastrocnemius, and extensor hallucis longus muscles for lower limbs (LL). All muscles were tested bilaterally and cumulative scores for UL and LL were computed. The Motor Function Measure (MFM) scale was used as standardized score for the evaluation of global motor impairment (Vuillerot et al., 2013;Montes et al., 2009). The MFM scale is composed of 32 items grouped in 3 functional domains: standing and transfers (D1 sub-score), axial and proximal motor function (D2 sub-score), and distal motor function (D3 sub-score). Cumulative scores are typically expressed as the percentage of the maximum possible score.
2.3. Cervical spinal cord (SC) acquisition protocol
SMA patients and HCs underwent a 3 T cervical SC MR imaging (MAGNETOM Prisma, Siemens Healthcare, Erlangen, Germany, 64-channel head and neck coil). Anatomical imaging between C2 and C7 spinal levels included a sagittal 3D T2-weighted fast spin-echo SPACE sequence and an axial 2D T2*-weighted multi-echo gradient echo se-quence (MEDIC) providing high GM-WM contrast (Martin et al., 2017). The main imaging parameters for the T2-weighted sequences were: slab selective excitation, voxel size = 0.8 × 0.8 × 0.8 mm3,
FOV = 256 × 256 mm2, 72 sagittal slices, TR/TE = 1500/131 ms,
ac-celeration factor R = 2. T2*-weighted imaging parameters were: voxel size = 0.5 × 0.5 × 5 mm3, FOV = 180 × 180 mm2, TR/ TE = 470/
G. Querin et al. NeuroImage: Clinical 21 (2019) 101618
17 ms, flip angle = 30°, seven slabs. T2*-weighted images were ac-quired at the middle of each cervical vertebral level and perpendicular to the SC axis.
Spine diffusion tensor imaging (DTI) data were acquired using a reduced field of view EPI sequence with high angular resolution (HARDI) with two axial slabs containing three slices each (C2 to C4 and C5 to C7 vertebral levels). Imaging parameters were: b = 1000 s/mm2,
60 diffusion-encoding gradient directions, voxel size = 8 × 0.8 × 5 mm3, FOV = 45 × 128 mm2, TR/TE = 500/73 ms,
cardiac gating.
2.4. Spinal cord MRI data processing
Data processing was performed using the Spinal Cord Toolbox v3.1 (SCT) (De Leener et al., 2017). Raw data were first reviewed for ac-quisition quality and incidental findings. T2-weighted and multimodal MR images were automatically registered to a common template image. Total CSA was extracted at each vertebral level from the T2-weighted images and expressed in mm2.
GM and WM were automatically segmented on the T2*-weighted image and WM-CSA and GM-CSA were calculated in mm2(De Leener
et al., 2017) (Fig. 1).
DTI images were co-registered in the PAM50 template-space (De Leener et al., 2017). Motion and Eddy-current corrections were first performed and subsequently the four main diffusivity metrics were computed: fractional anisotropy (FA), radial diffusivity (RD), axial diffusivity (AD) and mean diffusivity (MD). Using template-based analyses, DTI parameters were calculated for the medial and lateral CSTs and for the dorsal columns.
3. Brain MRI acquisition protocol
Cerebral MR data were acquired using a 64-channel head coil. DTI acquisition parameters were: TE = 73 ms, TR = 3490 ms, dimensions: 116x116x84 and an isometric voxel size of 1.81 × 1.81 × 1.81 mm. 3D T1-weighted imaging data were acquired with TE = 2.22 ms,
TR = 2400 ms, dimension matrix: 300x320x256 and an isometric voxel size of 1x1x1 mm. Brain MRI data were pre-processed for 25 SMA pa-tients and 25 HC. After quality verification procedures, brain MRI data was discarded for one SMA patient and two HCs due to movement ar-tefacts.
4. Brain MRI data processing
4.1. Cortical thickness analyses
The FreeSurfer image analysis suite was used to carry out cortical thickness measurements and comparative statistics (Fischl, 2012). Standard pre-processing steps were implemented, including motion correction, averaging of the structural T1-weighted data, removal of non-brain tissue, segmentation of the subcortical WM and deep GM structures, intensity normalization, tessellation of the GM-WM boundary, and automated topology correction. False Discovery Rate (FDR) correction was used to correct for multiple comparisons at p < .05 and group comparisons were corrected for gender and age. 4.2. Grey matter analyses
GM morphometry analyses were carried out using standard pipe-lines as implemented in FMRIB's software library (FSL) (Smith et al., 2004). Following brain extraction, motion-correction and tissue-type segmentation, GM partial volume images were aligned to MNI152 standard space using non-linear registration. An equal number (23−23) of SMA and control images were used to generate a sym-metric, study-specific grey matter template. All native GM images were then non-linearly registered to this study-specific template, modulated by a Jacobian field warp and smoothed with an isotropic Gaussian kernel with a sigma of 3 mm. The threshold-free cluster enhancement (TFCE) method and permutation-based nonparametric inference was used for the comparisons of the SMA patients and HCs accounting for age and gender. Statistical significance was set at p < .05 FWE.
Fig. 1. Segmentation and vertebral labelling of cervical spinal cord MRI images.
Automated spinal cord segmentation and vertebral labelling on sagittal (a) and axial (b) T2-weighted images resulting in cross-sectional area estimations (mm2). c:
4.3. White matter analyses
Raw DTI datasets underwent Eddy current corrections, motion correction and brain-tissue extraction using FSL (Smith et al., 2006). A diffusion tensor model was then fitted, generating maps of AD, RD, MD and FA. Tract-based spatial statistics (TBSS) (Smith et al., 2006) and permutation-based nonparametric inference was used for group com-parisons in a study-specific WM template applying the TFCE method. Design matrices included age and gender as covariates, and statistical significance was set at p < .05 FWE.
4.4. Region of interest (ROI) analyses
In addition to standard ‘whole-brain’ morphometry and TBSS, we performed ROI GM and WM analyses in the motor cortex and CSTs to specifically explore UMN associated degeneration. All ROI analyses were performed in the study-specific template space on our 4D data sets. The left and right hemispheric portion of the precentral gyrus label of the Harvard-Oxford cortical probability atlas were used to generate the motor cortex ROI mask (supplementary fig. 1). The Harvard-Oxford probabilistic atlas includes labels for 48 cortical and 21 subcortical structural areas (Desikan et al., 2006). Two types of ROI analyses were performed. First, permutation-based, design-matrix defined non-para-metric statistics were preformed in our motor cortex mask using FSL, thresholded and visualised just as in our standard, ‘whole-brain’ mor-phometry analyses. In a supplementary analysis, average GM prob-ability values were retrieved from the above cortical masks to perform additional post hoc analyses. Comparative statistics of ROI-GM-data were explored using ROI-GM probability as dependent variable, study group affiliation as the categorical independent variable and age and gender as covariates.
WM-ROIs were defined by masking the study-specific WM skeleton by the left and right CST labels of the Jülich histological atlas in MNI space (Eickhoff et al., 2005). (supplementary fig. 1) First a TBSS-type analysis was performed in the above CST mask for the four main dif-fusion metrics. Subsequently, average AD, RD, MD and FA values were retrieved from the left and right CST masks from the skeletonised 4D WM data and fed into post hoc statistics. Age and gender were used as covariates when comparing diffusivity values between SMA patients and controls.
5. Statistical analyses
Statistical analyses were performed using JMP 13 Pro. Shapiro-Wilk test was applied to test for normality. Descriptive variables such as mean, median, standard deviation, percentage and range were used to summarise quantitative measures. Group comparisons of normally distributed variables were performed using t-tests. For non-normally distributed data, the 2-tailed unpaired Mann-Whitney U test was used. The Chi-squared test was used to compare categorical data.
Spearman's correlation coefficient was used to assess correlations and FDR was used to correct for multiple correlations. The significance level was set at p < .05.
The datasets generated during and/or analysed during the current study are available from the corresponding author on reasonable re-quest.
6. Results
6.1. Clinical and neuromuscular evaluation
The demographic and neuromuscular profile of participants is summarized inTable 1.
None of the patients had significant comorbidities and patients were not on disease-modifying therapies. Based on consensus criteria (Mercuri et al., 2018;Wang et al., 2017), 5 patients were classified as SMA type IIIa, 14 as SMA IIIb and 6 as SMA type IV (supplementary table 1). SMN2 copy number was only available for 12 out of 25 pa-tients: all of them had 4 copies of the gene except 2 type IIIb SMA, who had 3 copies (age at symptom onset 12 and 15 years respectively). No correlation was found between SMN2 copy number and age of symptom onset, neuromuscular parameters or disease duration.
None of the patients had evidence of bulbar involvement. 18 pa-tients (72%) were ambulant and 7 papa-tients were non-ambulant (28%). Both muscle weakness and muscle wasting were strikingly symmetric (no significant difference was found in the muscle strength between the right and the left side for each tested muscle, p > .05) and pre-dominantly proximally both in the UL and LL. Proximal muscle in-volvement was also captured by D1 MFM sub-score reduction (61.6% of maximal score), representing the ability to maintain a standing position.
A significant association was identified between muscle strength and disease duration (supplementary table 2).
Table 1
Demographic, clinical and functional parameters of study participants described as mean value and standard deviation. MFM = muscle function measure. Cumulative mega-scores for proximal and distal muscle strength were calculated as follows: UL proximal score: deltoid, biceps brachii, triceps brachii; UL distal score: extensor carpi, opponens pollicis, flexor digitorum profundus; LL proximal score: iliopsoas, hip abductors, quadriceps femoris, hamstrings; LL distal score: anterior tibialis, gastrocnemius, extensor hallucis longus for lower limbs.
SMA patients Healthy controls p-value
Age 41.38 +/− 13.25 (range 18–66) 37.00 +/− 10.31 (range 18–57) p = .219
Sex 13 M:12F 12 M:13F p = .778
Handedness 21 Right-handed: 4 Left-handed 23 Right-handed: 2 Left-handed p = .140
Age at symptoms' onset (years) 11.00 +/− 7.01 (range 1–22) N/a
Age at molecular diagnosis (years) 18.32 +/− 13.20 (range 1–58) N/a Age at walking acquisition (months) 14.16 +/− 3.82 (range 12–24) N/a Disease duration at evaluation (years) 30.38 +/− 15.40 (range 5–55) N/a Upper limbs force mega score (max 70) 57.72 +/− 13.52 (range 38–70) N/a Upper limbs proximal force megascore (max 30) 23.60 +/− 7.02 (range 10–30) N/a Upper limbs distal force megascore (max 40) 34.12 +/− 6.73 (range 24–40) N/a Lower limbs force mega score (max 70) 49.24 +/− 15.51 (range 15–70) N/a Lower limbs proximal force megascore (max 40) 21.96 +/− 11.09 (range 0–40) N/a Lower limbs distal force megascore (max 30) 27.28 +/− 5.28 (range 12–30) N/a
MFM total score % 60.51 +/− 33.56 (range 0–100) N/a
MFM D1 score % 38.44 +/− 33.50 (range 0–100) N/a
MFM D2 score % 70.99 +/− 40.67 (range 0–100) N/a
MFM D3 score % 79.59 +/− 39.67 (range 0–100) N/a
G. Querin et al. NeuroImage: Clinical 21 (2019) 101618
6.2. Spinal cord MRI analyses
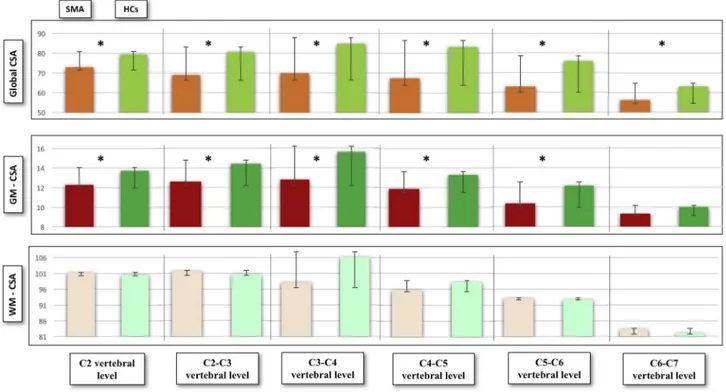
Significant CSA differences were identified between SMA patients and HCs at each vertebral level (all p < .05, not FDR corrected) as shown inFig. 2. More importantly, multilevel GM-CSA reductions were captured: at C2 (p < .001, consistent with a 10.73% reduction com-pared to HCs), at C2-C3 (p = .001, 12.77% reduction), C3-C4 (p < .001, 18.19% reduction), C4-C5 (p = .026, 11.29% reduction) and at C5-C6 (p = 0,006, 15.13% reduction). No GM-CSA reduction was identified at C6-C7 level compared to controls (p = .306) (Fig. 3). No significant WM-CSA reductions nor significant diffusivity differences were identified in SMA patients compared to controls, supporting the lack of WM degeneration in SMA (supplementary tables 3 and 4).
Significant correlation was also observed between GM-CSA at C3-C4 level and deltoid muscle strength (r = 0.41, p = .05). No other corre-lation was found between SC MRI parameters and functional scores. To examine the possible effect of disease-duration and explore differences between type III and type IV SMA patients, additional post hoc tests were performed. No significant differences were identified between the two cohorts for any of the spinal parameters (p > .05) and no corre-lation was detected between age or disease duration and spinal MRI metrics (total CSA or GM-CSA for C2-C7 vertebral levels).
6.3. Brain MRI analyses
Standard voxel-based morphometry (VBM) revealed multiple foci of increased GM density in SMA patients compared to HCs at p < .05 FWE TFCE. These regions included the bilateral anterior cingulate, orbitofrontal cortices, aspects of the dorsolateral pre-frontal cortex and significant portions of the precentral gyrus representing the motor cortex (Fig. 4).
Cortical thickness analyses and ‘whole-brain’ TBSS did not identify statistically significant differences between SMA patients and controls. Similarly, ‘whole-brain’ TBSS did not reveal WM alterations. Based on the increased GM density highlighted by VBM, supplementary ROI analyses were performed in the motor cortex and CSTs. Motor cortex ROI analyses highlighted a focus of increased GM density in SMA pa-tients in the right precentral gyrus (p < .05 FWE), which is anatomi-cally consistent with the hand representation of the motor homunculus (Fig. 4, section B). Based on retrieved T1 data, SMA patients exhibited higher average density values in the right motor cortex (p = .047) and a trend was also observed in the left motor cortex (p = .066). CST-based TBSS analyses did not identify significant WM integrity differences between SMA patients and HCs. Similarly, comparisons of CST diffu-sivity metrics between SMA patients and controls did not reach statis-tical significance. The boxplots of raw GM and WM metrics are pre-sented inFig. 5. The means, standard deviation and comparison of raw ROI values are reported in supplementary table 5.
Increased cortical volume was observed in SMA type IV compared to type III patients in the left motor cortex (p = .0108), and a similar trend was also observed on the right (p = .08). A significant correlation was observed between disease duration and motor cortex volumes; Spearman's rho: −0.413 in the left with FDR corrected p = .022 and − 0.51 in the right side with FDR corrected p = .020. No associa-tion was identified between age at onset and cortical volumes; Spearman's rho = 0.32 in the left side and 0.29 in the right, corre-sponding FDR-corrected p-values = .12 and 0.10 respectively.
7. Discussion
Our study confirms the presence of considerable multi-level cervical spinal cord atrophy in SMA (El Mendili et al., 2014). Spinal atrophy
Fig. 2. The spinal cord atrophy profile of SMA patients.
a: Total cross-sectional area values for each vertebral level presented as mean, standard deviation and comparative p-values between SMA patients and healthy controls. b: Grey matter cross-sectional area for each vertebral level presented as mean, standard deviation and comparative p-value between SMA patients and healthy controls c: Visual representation of grey matter atrophy profile of SMA patients expressed as mean CSA and relative standard deviation. CSA = cross-sectional area (mm2) Green colour indicates healthy controls and blue colour indicates the grey matter profile of SMA patients. (For interpretation of the references to color in this figure legend, the reader is referred to the web version of this article.)
Fig. 3. Graphical representation of total CSA, GM and WM-CSA for each vertebral level.
CSA is measured in mm2. Significant differences are indicated by asterisks. Green colour indicates healthy controls, red colour depicts the spinal cord profile of
patients with SMA. (For interpretation of the references to color in this figure legend, the reader is referred to the web version of this article.)
Fig. 4. Increased grey matter density in SMA patients described by voxel-based-morphometry.
(A) Increased grey matter density in SMA patients compared to healthy controls at p < .05 FWE (TFCE, age and gender corrections) identified by VBM. MNI coordinates are provided for the relevant axial, sagittal and coronal views. (B) Region of interest (ROI) morphometry in the motor cortex (yellow) highlights a focus of increased grey matter density in SMA patients compared to controls at p < .05 FWE TFCE. MNI coordinates of the focus (red) are indicated on the right bottom corner of the figure. (For interpretation of the references to color in this figure legend, the reader is referred to the web version of this article.)
G. Querin et al. NeuroImage: Clinical 21 (2019) 101618
seems to be primarily driven by GM degeneration, that was most pro-nounced between the C3 and C5 vertebral levels, while no atrophy was identified at C6-C7, mirroring the proximal predominance of muscle weakness. Moreover, no WM atrophy was detected by CSA and DTI measurements. Despite sample size limitations, our findings suggest that mechanisms underlying MN degeneration in SMA are different from those taking place in other MNDs, such as ALS (Paquin et al., 2018;De Albuquerque et al., 2017;Querin et al., 2017). The sparing of white matter was further supported by brain imaging, which detected no WM alterations in the CSTs despite using a dual whole-brain, and ROI approach. Interestingly, increased GM density was identified in the motor cortex of SMA patients compared to controls, which was further confirmed by ROI analyses. The presence of selective cortical hyper-trophy in key motor regions needs careful interpretation, especially given the relatively small number of study participants. Notwith-standing these limitations, increased cortical volumes may be inter-preted as an attempted compensatory mechanism in face of progressive LMN degeneration and discussed from a plasticity perspective. The reorganisation of motor regions is well recognised and has not only been reported in response to repetitive tasks (Chang, 2014), but also in patients with perinatal brain injuries, where increased GM density and cortical thickness is often identified in the contralateral hemisphere (Maguire et al., 2000). The best known example of cortical hypertrophy in response to a repetitive cognitive task is the increased hippocampal volume of London taxi drivers famously described by Maguire et al.
Such compensatory mechanisms however are known to be more evident in children and there may be a critical period for effective brain re-organisation to take place (Artzi et al., 2016). Both type III and IV SMA patients start to develop LMN degeneration early in life and therefore may be more likely to exhibit effective cortical adaptation. Moreover, similar mechanisms have been previously proposed to explain superior language skills in SMA, which was also interpreted as a compensatory response (von Gontard et al., 2002). Our post-hoc grey matter analyses revealed increased motor cortex volumes in the type IV SMA cohort compared to type III patients and we identified a significant correlation between disease duration and cortical volumes. We acknowledge that these findings should be interpreted with caution because of the limited sample size of the two cohorts. Nevertheless, they suggest that in-creased cortical volumes may represent a compensatory mechanism or cortical reorganisation which is more evident in patients with slower progression rates and longer disease duration. This interpretation is merely a hypothesis until our findings are replicated by other groups and validated in larger SMA cohorts.
The specific cellular mechanisms underlying the observed cortical changes in our SMA cohort remain to be elucidated. Dendritic spine density has been recently linked to VBM measures (Keifer Jr et al., 2015) in a study of neural plasticity in mice, showing that increased VBM signal was associated with an increase in dendritic spine density. Based on our findings, we propose that adaptive compensatory me-chanisms may take place in SMA which may be driven by dendrite
Fig. 5. Comparison of ROI-defined grey and white matter metrics between SMA patients and healthy controls. Boxplots represent raw data in controls (green) and
density modifications. We acknowledge that these are merely hy-potheses which need extensive validation by imaging studies in in-dependent cohorts and ultimately by histopathological evaluation.
Our study is not without limitations. Larger cohort sizes and more robust stratification of type III and IV SMA patients may be desirable and a longitudinal study would be a natural extension of our proof-of-concept findings. We did not capture correlations between SMN2 copy numbers and clinical or neuroimaging measures, but we SMN2 copy numbers were not available for all participants. Moreover, even if WM involvement was not identified at a spinal or cerebral level, due to methodological constraints WM degeneration in SMA cannot be com-pletely ruled out. We need to specifically acknowledge the limitation of region-of interest methods. While standard, ‘whole-brain’ analyses readily confirmed increased cortical volumes in the motor cortex, (Fig. 4) ROI type approaches are susceptible to spatial registration and modulation bias.
8. Conclusions
Our spinal and cerebral findings suggest that adult forms of SMA are manifestations of selective anterior horn degeneration, which may begin long before symptom onset, allowing for attempted cortical compensation. Our finding of SMA-associated grey matter hypertrophy in the primary motor cortex needs to be replicated in large independent patient cohorts. While correlations between disease-duration and cor-tical volumes and differences between type III and type IV patients may support the notion of compensatory cerebral processes and cortical reorganisation, this interpretation needs to be carefully validated in large, prospective longitudinal studies. The relatively slow disease progression rates in type III and type IV SMA may allow for adaptive changes to take place. Interestingly, even after long disease duration, our cohort of SMA patients does not exhibit evidence of retrograde UMN degeneration. Mechanisms contributing to isolated LMN loss without UMN involvement are of particular interest given the paucity of slow-progressing animal models of SMA and the divergent reports from other LMN-dominant MNDs (Muller et al., 2018). The characterisation of SMA-associated spinal and cerebral pathology and the development of disease-specific biomarkers are particularly timely given the emer-gence of effective disease-modifying therapies and promising pharma-cological trials in SMA.
Study funding
This study was supported by the Association Française contre les Myopathies (AFM) and the Institut pour la Recherche sur la Moelle épinière et l'Encéphale (IRME). The research leading to these results has also received funding from the program “Investissements d'avenir” ANR-10-IAIHU-06.
Competing interests
This study was sponsored by Association Française contre les Myopathies (AFM) and the Institut pour la Recherche sur la Moelle épinière et l'Encéphale (IRME). The research leading to these results has also received funding from the program “Investissements d'avenir” ANR-10-IAIHU-06.
Dr. Giorgia Querin, Dr. Mohamed-Mounir El Mendili, Dr. Timothée Lenglet, Dr. Anthony Behin, Dr. Tanya Stojkovic, Dr. François Salachas, Dr. Nadine Le Forestier, Dr. Maria del Mar Amador, Dr. Rabab Debs, Dr. Lucette Lacomblez, Prof. Vincent Meninger, Dr. Gaelle Brunetau, De Julien Cohen-Adad, Prof. Pascal Laforêt and Prof. Stéphane Lehéricy, Sophie Blancho, Dr. Habib Benali, Dr. Martin Catala, Prof. Véronique Marchand-Pauvert, Dr. Jean-Yves Hogrel and Prof. Pierre-François Pradat report no disclosures. Prof. Peter Bede is supported by the Health Research Board (HRB – Ireland; HRB EIA-2017-019), the Irish Institute of Clinical Neuroscience IICN − Novartis Ireland Research Grant, and
the Iris O'Brien Foundation Ireland.
Acknowledgements
We gratefully acknowledge the kindness and generosity of our pa-tients for participating in this study, their caregivers and our control participants. We thank Eric Bardinet for his contribution to data ac-quisition and Dr. Henrik Lundell for his computational assistance to quantify spinal cord dimensions. We thank Gwenn Olivier for her technical assistance in the functional evaluation. This study was sup-ported by the Association Française contre les Myopathies (AFM) and the Institut pour la Recherche sur la Moelle épinière et l'Encéphale (IRME). The research leading to these results has also received funding from the program “Investissements d'avenir” ANR-10-IAIHU-06. Peter Bede is supported by the Health Research Board (HRB – Ireland; HRB EIA-2017-019), the Irish Institute of Clinical Neuroscience IICN − Novartis Ireland Research Grant, and the Iris O'Brien Foundation Ireland.
Author's contributions
Giorgia Querin: study design, data collection, data analysis, drafting the manuscript. Mounir-Mohamed El Mendili: study design, optimisa-tion of MRI protocol, data collecoptimisa-tion, data analysis. Menghan Li: MRI data treatment. Timothée Lenglet, François Salachas, Rabab Debs, Daivd Devos, Nadine Le Forestier, Maria del Mar Amador, Anthony Behin, Tanya Stojkovic, Lucette Lacomblez, Vincent Meninger, Gaelle Brunetau, Pascal Laforêt: patient recruitment, clinical evaluation, data collection, review of manuscript for intellectual content. Julien Cohen-Adad, Stéphane Lehéricy: development of spinal MRI protocol, opti-misation of analysis pipelines, revision of the manuscript. Sophie Blancho: patient recruitment, patient selection, review of the manu-script. Habib Benali, Martin Catala, Véronique Marchand-Pauvert, Jean-Yves Hogrel: critical review of the manuscript. Peter Bede: data processing, cerebral MRI analyses, statistical calculations, drafting the manuscript. Pierre François Pradat: principal investigator, supervision and coordination of all clinical and research aspects of the study, drafting of the manuscript.
Appendix A. Supplementary data
Supplementary data to this article can be found online athttps:// doi.org/10.1016/j.nicl.2018.101618.
References
Artzi, M., Shiran, S.I., Weinstein, M., Tarrasch, R., Schertz, M., Fattal-Valevski, A., et al., 2016. Cortical reorganization following injury early in life. Neural. Plast. 2016, 8615872.https://doi.org/10.1155/2016/8615872.
Bonati, U., Holiga, Š., Hellbach, N., Risterucci, C., Bergauer, T., Tang, W., et al., 2017. Longitudinal characterization of biomarkers for spinal muscular atrophy. Ann. Clin. Transl. Neurol. 4 (5), 292–304.https://doi.org/10.1002/acn3.406.
Chang, Y., 2014. Reorganization and plastic changes of the human brain associated with skill learning and expertise. Front. Hum. Neurosci. 8, 35.https://doi.org/10.3389/ fnhum.2014.00035.
De Albuquerque, M., Branco, L.M., Rezende, T.J., de Andrade, H.M., Nucci, A., França Jr., M.C., 2017. Longitudinal evaluation of cerebral and spinal cord damage in Amyotrophic Lateral Sclerosis. Neuroimage. Clin. 14, 269–276.https://doi.org/10. 1016/j.nicl.2017.01.024.
De Leener, B., Lévy, S., Dupont, S.M., Fonov, V.S., Stikov, N., Louis Collins, D., et al., 2017. SCT: Spinal Cord Toolbox, an open-source software for processing spinal cord MRI data. NeuroImage 145, 24–43.https://doi.org/10.1016/j.neuroimage.2016.10. 009.
D'Errico, P., Boido, M., Piras, A., Valsecchi, V., De Amicis, E., Locatelli, D., et al., 2013. Selective vulnerability of spinal and cortical motor neuron subpopulations in delta7 SMA mice. PLoS One 8 (12), e82654.https://doi.org/10.1371/journal.pone. 0082654.
Desikan, R.S., Ségonne, F., Fischl, B., Quinn, B.T., Dickerson, B.C., Blaker, D., et al., 2006. An automated labelling system for subdividing the human cerebral cortex on MRI scans into gyral based regions of interest. NeuroImage 31 (3), 968–980. Deymeer, F., Serdaroglu, P., Parman, Y., Poda, M., 2008. Natural history of SMA IIIb:
muscle strength decreases in a predictable sequence and magnitude. Neurology 71 (9), 644–649.https://doi.org/10.1212/01.wnl.0000324623.89105.c4.
G. Querin et al. NeuroImage: Clinical 21 (2019) 101618
Eickhoff, S.B., Stephan, K.E., Mohlberg, H., Grefkes, C., Fink, G.R., Amunts, K., et al., 2005. A new SPM toolbox for combining probabilistic cytoarchitectonic maps and functional imaging data. NeuroImage 25 (4), 1325–1335.
El Mendili, M.M., Cohen-Adad, Pelegrini-Issac M., Rossignol, S., Morizot-Koutlidis, R., Marchand-Pauvert, V., et al., 2014. Multi-parametric spinal cord MRI as potential progression marker in amyotrophic lateral sclerosis. PLoS One 9 (4), e95516.https:// doi.org/10.1371/journal.pone.0095516.
El Mendili, M.M., Lenglet, T., Stojkovic, T., Behin, A., Guimarães-Costa, R., Salachas, F., et al., 2016. Cervical Spinal Cord Atrophy Profile in Adult SMN1-Linked SMA. PLoS One 11 (4), e0152439.https://doi.org/10.1371/journal.pone.0152439.
Elsheikh, B., Prior, T., Zhang, X., Miller, R., Kolb, S.J., Moore, D., et al., 2009. (2009). An analysis of disease severity based on SMN2 copy number in adults with spinal mus-cular atrophy. Muscle Nerve 40 (4), 652–656.https://doi.org/10.1002/mus.21350. Faravelli, I., Nizzardo, M., Comi, G.P., Corti, S., 2015. Spinal muscular atrophy-recent
therapeutic advances for an old challenge. Nat. Rev. Neurol. 11 (6), 351–359.
https://doi.org/10.1038/nrneurol.2015.77.
Fischl, B., 2012. FreeSurfer. NeuroImage 62 (2), 774–781.https://doi.org/10.1016/j. neuroimage.2012.01.021.
Keifer Jr., O.P., Hurt, R.C., Gutman, D.A., Keilholz, S.D., Gourley, S.L., Ressler, K.J., 2015. Voxel-based morphometry predicts shifts in dendritic spine density and morphology with auditory fear conditioning. Nat. Commun. 6, 7582.https://doi.org/10.1038/ ncomms8582.
Lefebvre, S., Bürglen, L., Reboullet, S., Clermont, O., Burlet, P., Viollet, L., et al., 1995. Identification and characterization of a spinal muscular atrophy-determining gene. Cell 80 (1), 155–165.
Maguire, E.A., Gadian, D.G., Johnsrude, I.S., Good, C.D., Ashburner, J., Frackowiak, R.S., et al., 2000. Navigation-related structural change in the hippocampi of taxi drivers. Proc. Natl. Acad. Sci. U. S. A. 97 (8), 4398–43403.
Marshall, A., Duchen, L.W., 1975. Sensory system involvement in infantile spinal mus-cular atrophy. J. Neurol. Sci. 26 (3), 349–359.
Martin, A.R., De Leener, B., Cohen-Adad, J., Cadotte, D.W., Kalsi-Ryan, S., Lange, S.F., et al., 2017. A Novel MRI Biomarker of Spinal Cord White Matter Injury: T2*-Weighted White Matter to Gray Matter Signal Intensity Ratio. AJNR Am. J. Neuroradiol. 38 (6), 1266–1273.https://doi.org/10.3174/ajnr.A5162.
Mercuri, E., Finkel, R.S., Muntoni, F., Wirth, B., Montes, J., Mazzone, E.S., et al., 2018. Diagnosis and management of spinal muscular atrophy: Part 1: Recommendations for diagnosis, rehabilitation, orthopaedic and nutritional care. Neuromuscul. Disord. 28, 103–115.https://doi.org/10.1016/j.nmd.2017.11.005.
Montes, J., Gordon, A.M., Pandya, S., De Vivo, D.C., Kaufmann, P., 2009. Clinical out-come measures in spinal muscular atrophy. J. Child. Neurology 24 (8), 968–978.
https://doi.org/10.1177/0883073809332702.
Muller, H.P., Agosta, F., Riva, N., Spinelli, E.G., Comi, G., Ludolph, A.C., et al., 2018. Fast progressive lower motor neuron disease is an ALS variant: A two-centre tract of in-terest-based MRI data analysis. NeuroImage Clinical. 17, 145–152.https://doi.org/ 10.1016/j.nicl.2017.10.008.
Paquin, M.Ê., El Mendili, M.M., Gros, C., Dupont, S.M., Cohen-Adad, J., Pradat, P.F., 2018. Spinal cord gray matter atrophy in amyotrophic Lateral sclerosis. AJNR Am. J. Neuroradiol. 39 (1), 184–192.https://doi.org/10.3174/ajnr.A5427.
Piepers, S., van den Berg, L.H., Brugman, F., Scheffer, H., Ruiterkamp-Versteeg, M., van Engelen, B.G., et al., 2008. A natural history study of late onset spinal muscular atrophy types 3b and 4. J. Neurol. 255 (9), 1400–1404.https://doi.org/10.1007/ s00415-008-0929-0.
Powis, R.A., Gillingwater, T.H., 2016. Selective loss of alpha motor neurons with sparing of gamma motor neurons and spinal cord cholinergic neurons in a mouse model of spinal muscular atrophy. J. Anat. 228 (3), 443–451.https://doi.org/10.1111/joa. 12419.
Querin, G., El Mendili, M.M., Lenglet, T., Delphine, S., Marchand-Pauvert, V., Pradat, P.F., 2017. Spinal cord multi-parametric magnetic resonance imaging for survival prediction in amyotrophic lateral sclerosis. Eur. J. Neurol. 24 (8), 1040–1046.
https://doi.org/10.1111/ene.13329.
Rasoanandrianina H, Grapperon AM, Taso M, Girard OM, Duhamel G, Guye, et al (2017). Region-specific impairment of the cervical spinal cord (SC) in amyotrophic lateral sclerosis: A preliminary study using SC templates and quantitative MRI (diffusion tensor imaging/inhomogeneous magnetization transfer). NMR Biomed. 30(12). doi:
https://doi.org/10.1002/nbm.3801.
Smith, S.M., Jenkinson, M., Woolrich, M.W., Beckmann, C.F., Behrens, T.E., Johansen-Berg, H., et al., 2004. Advances in functional and structural MR image analysis and implementation as FSL. NeuroImage 23 (Suppl. 1), 208–219.
Smith, S.M., Jenkinson, M., Johansen-Berg, H., Rueckert, D., Nichols, T.E., Mackay, C.E., et al., 2006. Tract-based spatial statistics: voxelwise analysis of multi-subject diffu-sion data. NeuroImage 31 (4), 1487–1505.
Towfighi, J., Young, R.S., Ward, R.M., 1985. Is Werdnig-Hoffmann disease a pure lower motor neuron disorder? Acta Neuropathol. 65 (3–4), 270–280.
von Gontard, A., Zerres, K., Backes, M., Laufersweiler-Plass, C., Wendland, C., Melchers, P., et al., 2002. Intelligence and cognitive function in children and adolescents with spinal muscular atrophy. Neuromuscul. Disord. 12 (2), 130–136.
Vuillerot, C., Payan, C., Iwaz, J., Ecochard, R., Bérard, C., MFM Spinal Muscular Atrophy Study Group, 2013. Responsiveness of the motor function measure in patients with spinal muscular atrophy. Arch. Phys. Med. Rehabil. 94 (8), 1555–1561.https://doi. org/10.1016/j.apmr.2013.01.014.
Wadman, R.I., Wijngaarde, C.A., Stam, M., Bartels, B., Otto, L.A.M., Lemmink, H.H., et al., 2018. Muscle strength and motor function throughout life in a cross- sectional cohort of 180 patients with SMA types 1c-4. Eur. J. Neurol. 25 (3), 512–518.https://doi. org/10.1111/ene.13534.
Wang, C.H., Finkel, R.S., Bertini, E.S., Schroth, M., Simonds, A., Wong, B., et al., 2017. Consensus statement for standard of care in spinal muscular atrophy. J. Child Neurol. 22 (8), 1027–1049.https://doi.org/10.1177/0883073807305788.
Wishart, T.M., Huang, J.P., Murray, L.M., Lamont, D.J., Mutsaers, C.A., Ross, J., et al., 2010. SMN deficiency disrupts brain development in a mouse model of severe spinal muscular atrophy. Hum. Mol. Genet. 19 (21), 4216–4228.https://doi.org/10.1093/ hmg/ddq340.
Zhang, Z., Lotti, F., Dittmar, K., Younis, I., Wan, L., Kasim, M., Dreyfuss, G., 2008. SMN deficiency causes tissue-specific perturbations in the repertoire of snRNAs and widespread defects in splicing. Cell 133 (4), 585–600.https://doi.org/10.1016/j.cell. 2008.03.031.