HAL Id: hal-01174636
https://hal.archives-ouvertes.fr/hal-01174636
Submitted on 9 Jul 2015
HAL is a multi-disciplinary open access
archive for the deposit and dissemination of
sci-entific research documents, whether they are
pub-lished or not. The documents may come from
teaching and research institutions in France or
abroad, or from public or private research centers.
L’archive ouverte pluridisciplinaire HAL, est
destinée au dépôt et à la diffusion de documents
scientifiques de niveau recherche, publiés ou non,
émanant des établissements d’enseignement et de
recherche français ou étrangers, des laboratoires
publics ou privés.
Integrating Multimodal Priors in Predictive Models for
the Functional Characterization of Alzheimer’s Disease
Mehdi Rahim, Bertrand Thirion, Alexandre Abraham, Michael Eickenberg,
Elvis Dohmatob, Claude Comtat, Gael Varoquaux
To cite this version:
Mehdi Rahim, Bertrand Thirion, Alexandre Abraham, Michael Eickenberg, Elvis Dohmatob, et al..
Integrating Multimodal Priors in Predictive Models for the Functional Characterization of Alzheimer’s
Disease. Medical Image Computing and Computer Assisted Intervention, Oct 2015, Munich, Germany.
�10.1007/978-3-319-24553-9_26�. �hal-01174636�
Integrating Multimodal Priors in Predictive
Models for the Functional Characterization of
Alzheimer’s Disease
Mehdi Rahim1,2,3, Bertrand Thirion1,2, Alexandre Abraham1,2, Michael Eickenberg1,2, Elvis Dohmatob1,2, Claude Comtat3, and Gael Varoquaux1,2
1
Parietal Team, INRIA Saclay-ˆIle-de-France, Saclay, France 2 CEA, DSV, I2BM, Neurospin bˆat 145, 91191 Gif-Sur-Yvette, France 3
CEA, DSV, I2BM, SHFJ 4, place du G´en´eral Leclerc, 91401 Orsay, France mehdi.rahim@cea.fr
Abstract. Functional brain imaging provides key information to char-acterize neurodegenerative diseases, such as Alzheimer’s disease (AD). Specifically, the metabolic activity measured through fluorodeoxyglu-cose positron emission tomography (FDG-PET) and the connectivity ex-tracted from resting-state functional magnetic resonance imaging (fMRI), are promising biomarkers that can be used for early assessment and prog-nosis of the disease and to understand its mechanisms. FDG-PET is the best suited functional marker so far, as it gives a reliable quantitative measure, but is invasive. On the other hand, non-invasive fMRI acquisi-tions do not provide a straightforward quantification of brain functional activity. To analyze populations solely based on resting-state fMRI, we propose an approach that leverages a metabolic prior learned from FDG-PET. More formally, our classification framework embeds population pri-ors learned from another modality at the voxel-level, which can be seen as a regularization term in the analysis. Experimental results show that our PET-informed approach increases classification accuracy compared to pure fMRI approaches and highlights regions known to be impacted by the disease.
Keywords: Classification, prior, connectivity, metabolism, resting-state fMRI, FDG-PET, Alzheimer’s disease
1
Introduction
Alzheimer’s disease (AD) is characterized by a progressive impairment of brain structures and their connections, which leads to a loss of cognitive function. Mild cognitive impairment (MCI) is frequently seen as a prodromal stage of AD. The anatomical and functional changes caused by AD or MCI can be detected via various neuroimaging modalities and machine learning techniques.
Indeed, anatomical measures performed on Magnetic Resonance Images (MRIs) such as hippocampus volume or cortical thickness [8] [6] [5], amyloid-β deposition [12], the quantification of metabolism on fluorodeoxyglucose positron emission
tomography (FDG-PET), or cerebrospinal fluid (CSF) measures, can all bring precious biomarkers to help to distinguish AD subjects or MCI subjects who convert later to AD [10].
There is abundant prior art on classification models based on multi-modal images and non-imaging data. For instance [14] used a kernel to combine FDG-PET, anatomical MRI and CSF biomarker measures to obtain a high AD detec-tion accuracy. Here we focus on funcdetec-tional imaging biomarkers involved in AD. Several studies have shown that FDG-PET imaging on MCI and AD subjects reveals significantly reduced metabolic activity. Whether based on brain regions [2] or voxels [9], prediction of AD on FDG-PET yields 90% accuracy. The major drawback of this modality is that it is invasive and involves exposition to gamma-ray radiation. On the other hand, resting-state fMRI captures brain activation via fluctuations of the blood oxygenation level dependent (BOLD) contrast. It is used to estimate functional connectivity, which is measured through the cor-relation between time courses. As studied in [13] and [4], AD is characterized by widespread decreases in connectivity, especially in the default mode network (DMN). Resting-state fMRI acquisitions are non-invasive and can be easily in-tegrated within a clinical imaging protocol. However, their low signal-to-noise ratio reduces the sensitivity with regards to AD prediction. Also, the selection of prior seed regions for connectivity mapping involves a subjective choice which may lead to inaccuracies when analyzing groups of subjects.
Recently, [7] reported a close relationship between the DMN functional con-nectivity and its metabolic activity at rest, thanks to a study on FDG-PET and resting-state fMRI performed on a PET-MRI scanner. In this paper, we leverage this relationship in a rest-fMRI-based classification framework, con-strained by a metabolism-based discriminative pattern learned from a distinct and large FDG-PET dataset. We show that regularization with an FDG-PET prior improves the fMRI classification accuracy and the discriminative pattern identification, compared to various state-of-the-art regularizers applied to the functional connectivity maps. We address the issue of the arbitrary selection of a reference region of interest (ROI) when computing connectivity by using several seed-based correlations of ROIs extracted from a functional atlas, fol-lowed by a model that stacks their predictions. The resulting predictor, based on multiple ROIs, gives better accuracy than a single selected ROI. The pa-per is organized as follows. In section 2, we present our classification framework with the integration of priors. Section 3 presents experiments in which different approaches are compared. Finally section 4 summarizes the results.
2
Multimodal prior integration for model enhancement
The proposed approach relies on the assumption that information on metabolism alterations measured with FDG-PET images can improve the accuracy of resting-state fMRI-based predictive models. Rather than a multi-modal PET-fMRI pre-diction in each subject, we derive a population-level PET prior, to avoid as much as possible the recurrent use of PET, since it is invasive. The first step of the
proposed framework is to estimate a connectivity-based classification model reg-ularized by a learned metabolic prior, which involves a complementary coupling parameter to adapt this prior. Besides the metabolic prior, we also investigate the usefulness of a spatial prior called the total-variation TV-`1prior proposed in
[1]. It is composed of a sparse regularization scheme `1that displays few salient
regions, combined with a TV scheme which promotes spatially grouped regions. The second step combines the predictions computed from the prior-integrated models of all ROIs involved thanks to a stacking model. Typically, a given set of seed-regions are used to compute signal correlations.
Let X ∈ Rn×p denote a voxel-level connectivity matrix relative to a specific
ROI, where n and p are respectively the numbers of samples (subjects) and variables (voxels). Let y ∈ {0, 1}n denote the class (diagnosis) vector of each
sample. Our model builds on ridge regression. The classical ridge regression estimates the coefficients ˆwridge∈ Rp so that
ˆ wridge= argminwkXw − yk 2 2+ αkwk 2 2, (1)
where α > 0 is a parameter of the coefficient penalization that controls the amount of shrinkage. The proposed model integrates the prior within the penal-ization term yielding
ˆ
w = argminwkXw − yk2
2+ αkw − λwpriork22, (2)
where wprior is the prior coefficient vector that has already been learned. λ > 0
is a scaling parameter that adapts the prior to the actual setting. By substituting b = w − λwprior, one falls back to a classical ridge regression formulation. Each
of the model parameters λ and α are empirically estimated through a nested cross-validation procedure.
The coefficient vector ˆw of the predictive model is a spatial map that can be regularized with the TV-`1spatial prior, in order to obtain more stable
discrim-inative patterns. So the estimation problem is formulated as ˆ w = argminw1 2kXw − yk 2 2+ α 2kw − λwpriork 2 2+ βJ (w), (3)
where J (w) is the TV-`1 regularization term expressed as
J (w) = k∇wk21+ ρkwk1. (4)
In the stacking stage, the unthresholded prior-model predictions of all ROIs are concatenated, yielding a matrix S ∈ Rn×s, where s is the number of ROIs. This
summary is used in a logistic regression model to predict the subject class y. The pipeline corresponding to our model is depicted in Fig. 1. The inputs are the quantitative metabolism on 3D FDG-PET which is used for the prior estimation, the 4D resting-state fMRI and a set of ROIs from which the con-nectivity is estimated. First, the prior is estimated from FDG-PET thanks to a ridge classifier. Regarding the resting-state fMRI features, ROI-based connectiv-ity maps are computed based on fMRI data as correlations between each voxel
Functional atlas ROI to voxel correlation FDG-PET Classification FDG-PET informed Classification weights as prior Stacking Connectivity features Class prediction N ROIs Prediction for each ROI
fMRI
time
Connectivity_N
Connectivity_1 Prediction_1
Prediction_N
Fig. 1: Overview of the proposed classification pipeline: The inputs are ROI-to-voxel connectivities computed from the rs-fMRI time-series. FDG-PET model weights are integrated as prior for the classification. Then, predictions of all ROIs are the inputs of a stacking model to predict the clinical group.
and signals from the ROI. Unlike what is commonly done, we took as ROIs several regions extracted from a functional brain atlas. Actually, we compared two widely used functional brain atlases. The first atlas (called Atlas 1 below), comprises 68 seed ROIs extracted from a functional dataset and proposed in [3]. This atlas has been constructed on 892 subjects, and was successfully used to characterize differences between AD subjects and cognitively normal ones. The second functional atlas (Atlas 2 ) has been proposed in [11], it contains 39 ROIs learned from resting-state fMRI data. Then, the regression model informed by the FDG-PET prior is estimated. This yields one model per ROI. Finally, the global classification on fMRI is performed via a logistic regression which estimates the target from the stacked predictions of each ROI-based model.
3
Experiments
Datasets Data used in this study are taken from the Alzheimer’s Disease Neu-roimaging Initiative (ADNI) database (adni.loni.ucla.edu). In this work, two subject-distinct subsets were extracted for each modality (FDG-PET and fMRI) at baseline. We wish to study and predict conversion of MCI subjects to AD. However, the resting-state fMRI protocol has been integrated only recently in the ADNI study (from ADNI-GO phase), and we have merely 5 MCI convert-ers that have fMRI acquisitions, which is not sufficient for estimation. We thus consider a proxy, namely the classification between MCI and AD subjects.
We applied a preprocessing pipeline which is composed of the following steps: removing the three first frames, motion correction, normalization to the MNI template, spatial smoothing (Gaussian, FWHM 5mm) and temporal detrending. After a quality check, we selected 94 subjects (21 AD and 73 MCI) out of 110 from ADNI-GO and ADNI-2 phases. Regarding the FDG-PET acquisitions, the downloaded data had already been preprocessed and quality-checked. The FDG-PET data used are 3D averaged images which have undergone co-registration, intensity standardization and a spatial normalization. Overall, we have images from 627 subjects (147 AD and 480 MCI) acquired mainly during ADNI-1 phase.
50 60 70 80 90 100
Accuracy (%)
PET no prior TV-l1 prior PET prior (PET+TV-l1) prior (a) 50 60 70 80 90 100Accuracy (%)
PCC Stacking (Atlas 1) Stacking (Atlas 2) PCC + prior Stacking + prior (Atlas 1) Stacking + prior (Atlas 2)(b)
Fig. 2: Classification accuracies of : (a) PET prior and TV-`1 prior classifiers
compared to pure connectivity classifier (no prior). (b) Atlas based stacking approach compared to a single ROI connectivity.
Note that the datasets of the two modalities are from two completely distinct groups of subjects.
Experiment settings We evaluate the impact of : i) The regularization (metabolic, spatial, both, none). ii) The selection of the ROIs (Atlas 1, Atlas 2, posterior cin-gulate cortex region) on the connectivity-based classification. The model without regularization relies on a ridge regression on each ROI stacked under a logistic regression classifier. The evaluation of the two models is done by cross-validation, which consists of a stratified-shuffle split loop with 100 iterations and a test fold size of 20% of the whole dataset. The classification hyper-parameters (α, λ, β, ρ) are estimated by a nested 4-fold cross-validation. Moreover, the accuracy dif-ferences between test folds across iterations are measured through a two-sided Wilcoxon test.
4
Results and discussion
Classification accuracy Fig. 2a shows the accuracy of the cross-validated classifi-cation for the classical connectivity, the TV-`1prior and the proposed metabolic
prior. These results show that the proposed prior method outperformed the pure functional connectivity method. Indeed, the mean gain is relatively substantial (around 8%), as reported in Table 1, which summarizes the mean differences and the p-values calculated from the two-sided Wilcoxon test between each pair of models. The spatial TV-`1prior does not improve the connectivity classification
accuracy, although it produces a more stable model as the cross-validation accu-racies have a lower variance. From these results, we conclude that the metabolic prior is more powerful to classify AD subjects than the spatial prior. One could expect that combining both metabolic and spatial priors would increase the connectivity-based prediction. In fact, the spatial penalty limited the metabolic
Table 1: Comparing accuracies on cross-validation folds when including the metabolic and the spatial priors or not. The last three rows report the differ-ences when stacking predictions of ROI set from two functional atlases, and when using a selected ROI (posterior cingulate cortex). P-values from the two-sided Wilcoxon test between each pair of methods are in the last column.
Comparison Mean difference (%) p-value
TV-`1 prior − no prior −1.9 ± 7.6 6.7 × 10⁻³
PET prior − no prior +7.9 ± 9.5 1.3 × 10⁻¹⁰
(PET + TV-`1) prior − no prior +4.1 ± 9.4 1.8 × 10⁻⁴ PET prior − TV-`1 prior +9.7 ± 8.8 1.6 × 10⁻¹³ (PET + TV-`1) prior − TV-`1 prior +5.9 ± 7.1 4.4 × 10⁻¹¹ (PET + TV-`1) prior − PET prior −3.7 ± 9.6 2.7 × 10⁻⁴
Atlas 1 − PCC +9.3 ± 9.8 2.6 × 10⁻¹²
Atlas 2 − PCC +10.7 ± 12.2 6.6 × 10⁻¹²
Atlas 1 − Atlas 2 +1.4 ± 9.3 3.5 × 10⁻¹
prior influence in terms of accuracy, but decreased the variance. While these re-sults should be interpreted with caution, given the size of the dataset, the overall accuracy increase is significant. It suggests that the metabolic prior estimated from FDG-PET data (whose consistency has been validated) permits the high-lighting of biomarkers that the small fMRI dataset alone fails to bring. Spatial regularization does not enhance the scarce information provided by fMRI maps. Regarding the stacking approach, Fig. 2b represents the accuracy distribu-tion when stacking ROIs-based connectivity estimates compared to single-ROI connectivity. We note that, despite a higher variance introduced, calculating the connectivity from various ROIs and combining them allows a significant predic-tion accuracy enhancement: in Table 1, the accuracies are 10% higher than the PCC connectivity usually used in the analysis of resting-state fMRI connectivity. The comparison between the two atlases reveals that the models produced by each of them are quite similar in terms of accuracy. This shows that, in order to set up more robust connectivity-based models that classify AD, it is impor-tant not to restrict the analysis to a single region, but to extend it to several functional regions that bring complementary information.
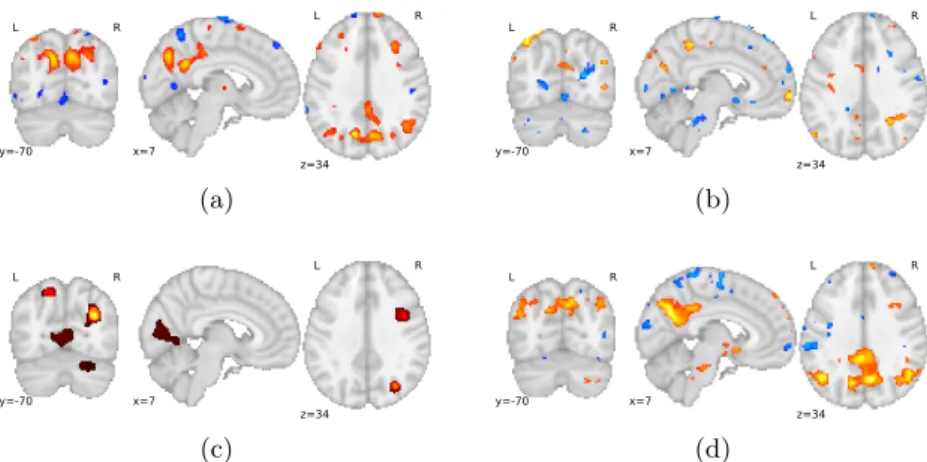
Discriminative spatial patterns Since we perform a voxel-level brain analysis, it is easy to visualize discriminant patterns between AD subjects and MCI subjects to interpret the estimated classification model coefficients. Learned brain spatial models, which consist of averaged classifier weights across cross-validation folds, are shown in Fig. 3.
Fig. 3a shows the spatial distribution map of the learned FDG-PET prior model, the map values are the coefficients of a cross-validated ridge classifier, with an overall accuracy of 88.0±5.7%. This difference map clearly outlines some cerebral regions, such as the posterior cingulate cortex (PCC), the precuneus,
L R y=-70 x=7 L R z=34 (a) L R y=-70 x=7 L R z=34 (b) L R y=-70 x=7 L R z=34 (c) L R y=-70 x=7 L R z=34 (d)
Fig. 3: Maps of AD discriminative spatial patterns extracted from : (a) the FDG-PET model used as prior. (b) the fMRI seed-to-voxel connectivity. (c) the fMRI with the spatial prior. (d) the fMRI with the metabolic prior.
and parts of the parietal lobe. These structures, which are part of the DMN, are known to characterize AD with a decreased metabolism.
The regions formed by the weights of the classification model estimated from PCC functional connectivity are plotted in Fig. 3b. Although the patterns are quite noisy, these regions describe some meaningful functional structures such as the default mode network, and parts of the parietal lobe.
The spatial TV-`1 prior in Fig. 3c did not bring supplementary information,
but as expected, the sparse `1 constraint yielded less noisy patterns and the
total-variation constraint produced more focused regions.
The impact of the FDG-PET prior is shown in Fig. 3d, where we see that the metabolic prior overcame the limitations of the connectivity-based discriminant patterns. We observe in particular patterns that are smoother than fMRI only, e.g. the clearly outstanding default mode network. This finding is in agreement with AD studies that showed the functional connectivity differences observed on resting-state fMRI, but it is hard to obtain from functional connectivity only.
5
Conclusion
We introduced in this paper a learning framework that integrates multi-modal prior knowledge from a distinct cohort. We addressed the ROI selection issue when computing the functional connectivity by proposing a stacking model that couples a set of ROIs. Experimental results confirm that the metabolism activity of brain structures measured on the FDG-PET images is linked to the connec-tivity measured by resting-state fMRI. In our experiments on the ADNI fMRI dataset, within the context of AD/MCI prediction, we validated the proposed method, since it improved the accuracy of the classification of AD subjects bet-ter than a spatial prior, and highlighted meaningful functional regions related to
state-of-the-art studies on AD. It overcomes the limitations of fMRI data (small dataset, noisy data) with a pre-established model validated on a consistent fold of subjects. We showed that the stacking approach has a significant impact on the prediction accuracy, and using a validated functional atlas allowed us to be insensitive to the ROI selection. Moreover, our experiments showed that existing datasets are a very useful resource to investigate more difficult questions such as the prognosis of conversions from MCI to AD.
Acknowledgements. This work is supported by the Lidex PIM project funded by the IDEX Paris-Saclay, ANR-11-IDEX-003-02. We also acknowledge funding from the NiConnect project (ANR-11-BINF-0004 NiConnect).
References
1. Gramfort, A., Thirion, B., Varoquaux, G.: Identifying predictive regions from fMRI with TV-L1 prior. In: Pattern Recognition in Neuroimaging (PRNI). p. 17 (2013) 2. Gray, K.R., Wolz, R., Heckemann, R.A., Aljabar, P., Hammers, A., Rueckert, D.: Multi-region analysis of longitudinal FDG-PET for the classification of Alzheimer’s disease. NeuroImage 60(1), 221–9 (2012)
3. Jones, D.T., Vemuri, P., Murphy, M.C., et al.: Non-stationarity in the “resting brain’s” modular architecture. PloS one 7(6), e39731 (2012)
4. Koch, W., Teipel, S., Mueller, S., Benninghoff, J., Wagner, M., et al.: Diagnostic power of default mode network resting state fMRI in the detection of Alzheimer’s disease. Neurobiology of aging 33(3), 466–478 (2012)
5. Lillemark, L., Sørensen, L., et al.: Brain region’s relative proximity as marker for Alzheimer’s disease based on structural MRI. BMC med imag 14(1), 21 (2014) 6. Prados, F., Cardoso, M.J., et al.: Measuring brain atrophy with a generalized
formulation of the boundary shift integral. Neurobiology of aging 36, 81–90 (2015) 7. Riedl, V., Bienkowska, K., Strobel, C., et al.: Local activity determines functional connectivity in the resting human brain: a simultaneous FDG-PET/fMRI study. Journal of neuroscience 34(18), 6260–6 (2014)
8. Sabuncu, M.R., Desikan, R.S., Sepulcre, J., et al.: The dynamics of cortical and hippocampal atrophy in Alzheimer’s disease. Archives of neurology 68, 1040 (2011) 9. Toussaint, P.J., Perlbarg, V., Bellec, P., et al.: Resting state FDG-PET functional connectivity as an early biomarker of Alzheimer’s disease using conjoint univariate and independent component analyses. NeuroImage 63(2), 936–46 (2012)
10. Trzepacz, P.T., Yu, P., Sun, J., et al.: Comparison of neuroimaging modalities for the prediction of conversion from mild cognitive impairment to Alzheimer’s dementia. Neurobiology of aging 35(1), 143–151 (2014)
11. Varoquaux, G., Gramfort, A., Pedregosa, F., Michel, V., Thirion, B.: Multi-subject dictionary learning to segment an atlas of brain spontaneous activity. In: Informa-tion Processing in Medical Imaging. pp. 562–573. Springer (2011)
12. Villain, N., Ch´etelat, G., et al.: Regional dynamics of amyloid-β deposition in healthy elderly, mild cognitive impairment and Alzheimer’s disease: a voxelwise PiB–PET longitudinal study. Brain 135(7), 2126–2139 (2012)
13. Wang, K., Liang, M., Wang, L., Tian, L., Zhang, X., Li, K., Jiang, T.: Altered functional connectivity in early Alzheimer’s disease: A resting-state fmri study. Human brain mapping 28(10), 967–978 (2007)
14. Zhang, D., Wang, Y., Zhou, L., Yuan, H., Shen, D.: Multimodal classification of Alzheimer’s disease and mild cognitive impairment. NeuroImage 55, 856 (2011)