HAL Id: hal-01838593
https://hal.laas.fr/hal-01838593
Submitted on 13 Jul 2018
HAL is a multi-disciplinary open access
archive for the deposit and dissemination of
sci-entific research documents, whether they are
pub-lished or not. The documents may come from
teaching and research institutions in France or
abroad, or from public or private research centers.
L’archive ouverte pluridisciplinaire HAL, est
destinée au dépôt et à la diffusion de documents
scientifiques de niveau recherche, publiés ou non,
émanant des établissements d’enseignement et de
recherche français ou étrangers, des laboratoires
publics ou privés.
Modeling of microfluidically tuned capacitor for RF
applications
Nizar Habbachi, Hatem Boussetta, Mohamed Kallala, Ali Boukabache,
Patrick Pons, Kamel Besbes
To cite this version:
Nizar Habbachi, Hatem Boussetta, Mohamed Kallala, Ali Boukabache, Patrick Pons, et al.. Modeling
of microfluidically tuned capacitor for RF applications. IEEE International Multi-Conference on
Systems, Signals & Devices (SSD’18), Mar 2018, Hammamet, Tunisia. 5p. �hal-01838593�
Modeling of microfluidically tuned capacitor for RF
applications
Nizar Habbachi
Microelectronics and Instrumentation Laboratory, Faculty of Sciences of Monastir, University of Monastir, 5000
Monastir, Tunisia,
Hatem Boussetta
Institut Prépratoire aux Etudes d’Ingénieurs de Monastir, Rue Ibn Eljazzar - 5019 Monastir Tunisia, and he is with Microelectronics and Instrumentation Laboratory, Faculty
of Sciences of Monastir, University of Monastir, 5000 Monastir, Tunisia,
Mohamed Adel Kallala
Military Research Centre, Tunis, and he is with Microelectronics and Instrumentation Laboratory, Faculty
of Sciences of Monastir, University of Monastir, 5000 Monastir, Tunisia,
Ali Boukabache
Laboratory for Analysis and Architecture of Systems, CNRS , LAAS, 7 avenue du Colonel Roche, 31077 Toulouse, France, and he is with the University of Toulouse,
1077 Toulouse, France,
Patrick Pons
Laboratory for Analysis and Architecture of Systems, CNRS, LAAS, 7 avenue du Colonel Roche, 31077
Toulouse, France,
Kamel Besbes
Center for Research on Microelectronics & Nanotechnology, CRMN Sousse TechnoPark, BP 334 Sahloul Sousse, Tunisia, and he is with Microelectronics
and Instrumentation Laboratory, Faculty of Sciences of Monastir, University of Monastir, 5000 Monastir, Tunisia,
Abstract— this paper presents the modeling of microfluidically tuned capacitor for RF applications. The designed structure is based on performances variations following DI water displacement between capacitor’s electrodes. We have modeled the electric field and the current distribution using FEM tool for different DI water position in microchannels. The obtained results at 4.5 GHz show an important variation of electric field
and current distribution that impacts the capacitor
performances: the capacitance value is comprised between Cmin =
0.11 pF and Cmax = 5.76 pF, the factor value decreases from Qmax
= 84.27 to Qmin = 3.99, and the resonant frequency ranges from
5.67 GHz to 19.8 GHz. Indeed, the capacitance variation reaches Tr = 5136% and the broadband ability is higher than 240%.
Keywords-Microfluidic; RF MEMS, capacitor; tunable; wide band.
I. INTRODUCTION
Tuned capacitors are used in multitude RF applications such as: satellite communication, wireless networks, radar systems, and cellular mobile. The main features involved in the design of variable RF MEMS capacitors are: high tuning range, low insertion loss, high quality factor, broadband, high frequency operation. The versatility of actuation modes of RF MEMS capacitors enables several essential functions such as impedance matching, adjustable filters, variable phase shifters, multi-band amplifiers or adjustable amplifiers.
Originally, actuations modes are based on operating forces generated due to the conversion of mechanical energy into electrical energy and vice versa. Furthermore, the implantation
of an actuator to the micrometer scale requires specific manufacturing techniques and materials. The most important feature in RF MEMS capacitors is variation range, which is usually related to the nature of the used mode. Since the invention of MEMS components the researchers have tried to cross the limits of variation based on different actuations modes [1-6].
In this paper, we study a highly tunable RF MEMS capacitor based on microfluidic actuation. In the first section, we present the 3D perspective of our microfluidic capacitor and our principal of variation. In the next section, we discuss the electric field and current distribution following the DI water displacement. In third section, we investigate the effect of fluidic variation on capacitance and quality factor in response of frequency. Finally, we analyze the RF performances of our capacitor: resonant frequency and insertion loss in response of DI water displacement in microchannels.
II. MICROFLUIDIC CAPACITOR DESIGN:
Our principle of variation relies on the modification of driving medium permittivity where prevailing electric field following DI water displacement between capacitor’s electrodes. The change will take place gradually and continuously as a function of dielectric fluid passage between microchannels separating the armatures of capacitor. This change alters the distribution of electric field, which varies capacitor’s performances. The microfluidic actuation is used in wide tunable RF MEMS components [6-9].
The Fig. 1 presents the 3D perspective of our microfluidic capacitor and the different positions of DI water in microchannels:
(a)
(b) (c)
(d) (e)
Figure 1: Design of the squared microfluidic capacitor: (a) 3D representation of the structure; fluid positions in channel: (b) POS1 (c) POS2 (d) POS3 (e) POS4.
III. CAPACITOR MODELING:
Analytical models describing the operation of microwave capacitors are usually based on equivalent circuit's using lumped and ideals elements and they are generally insufficient to give fairly and accurate results. Indeed, the obtained results give an approximation to real behaviors and they not consider the whole RF losses that are not all taken into account. Furthermore, numerical methods based on the resolution of
Maxwell's equations are more appropriate for RF structures. There are several types of numerical methods such as finite difference method (FDM), method of moment (MoM), finite element method (FEM), etc. During our analyses, we have chosen FEM software for its high precision of calculation, although it requires a higher calculation time.
In this part, we expose the effect of DI water displacement on electric field distribution and current density at 4.5 GHz for four DI water positions.
1) Electric field distribution:
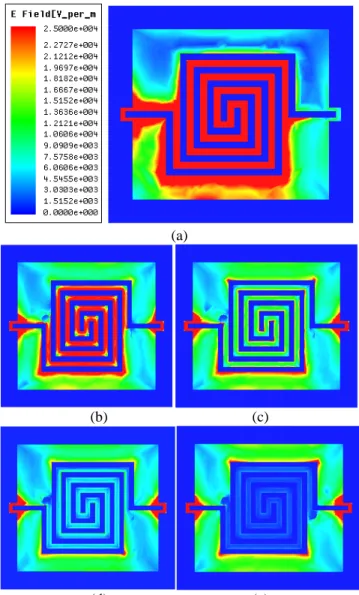
The Fig 2 shows the surface distribution of electric field at 4.5 GHz in response of dielectric fluid penetration in microchannels:
(a)
(b) (c)
(d) (e)
Figure 2: Surface distribution of electric field at 4.5 GHz when the capacitor is empty and for four DI water position, (a) empty (b) POS1 (c) POS2 (d) POS3 (e) POS4.
As we can see in Fig. 2 (a), when the capacitor is empty, the electric field is maximal in microchannel and at excitation port 1. Indeed, the permittivity in microchannel (vacuum) is less
than that of dielectric medium, which encloses it (substrate and SU-8 layers), and consequently the fluidic channel represents the confinement medium of the electric field. We also note that electric field is high at SU-8 layers that separate spirals and ground. This result shows that electrodes can be considered as a source of electric field prevailing in the structure when it is empty. On the other hand, when the deionized water enters capacitor, it changes the permittivity of the microchannel and subsequently modifies the distribution of the electric field. As we can see in Fig. 2 (b), at first position of fluid, the field decreases in microchannels and remains high in the area closest to electrodes. We also note the appearance of electric field part near the second excitation port. In second position (Fig 2 (c)); the electric field continue to dissipate from microchannels and a residual part remains focused at it. From third position (Fig. 2 (d)); we notice an excessive and continuous decrease of E field residual part in microchannels. Indeed, the increase of permittivity in microchannel following the displacement of DI water increasingly influences the depletion of E field in microchannel. The last position of fluid (Fig. 2 (e)) reveals a cancellation of electric field in microchannel and a homogeneous distribution of electric field in structure as well as in the two excitations ports.
2) Current density distribution:
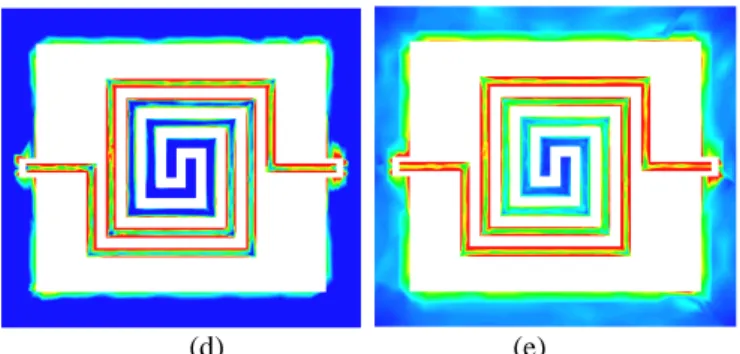
The Fig. 3 presents the current density distribution for four DI water positions at 4.5 GHz:
(a)
(b) (c)
(d) (e)
Figure 3: Current density distribution at 4.5 GHz when the capacitor is empty and for four DI water position, (a) empty (b) POS1 (c) POS2 (d) POS3 (e) POS4.
As we can see in Fig. 3 (a), current density value is low at capacitor center when it is empty. With fluid penetration in microchannels (Fig. 3 (b-d)), current density value increases continuously in electrodes and remains zero at the ground surface. At fourth position (Fig. 4 (e)), current density reaches its maximum at electrodes surface and begins to increase at ground surface. We would like to clarify that current density value is mainly related to the operation frequency and reaches its maximum at resonant frequency. Knowing that fluid position in microchannels changes physical properties of the structure and consequently changes the resonant frequency. The results presented in Fig. 3 show a partial current density because the frequency is fixed at 4.5 GHz.
B. Fluidic variation effect on capacitor performances: In this section, we analyze the effect of fluidic actuation on the electrical and RF performances of microfluidic capacitor: capacitance, quality factor, and reflection/transmission losses based on S parameters. The simulation of the structure is carried out under "HFSS-software" for a frequency range from 10 MHz to 40 GHz for four positions of DI water between capacitor's electrodes.
1) Capacitance and quality factor:
The Fig. 4 below shows the variation of capacitance and quality as a function of frequency for four positions of DI water:
0.01
0.1
1
10
-12
-8
-4
0
4
8
12
POS1 POS2 POS3 POS4C
apac
it
anc
e (pF
)
Frequency (GHz)
(a)0.01
0.1
1
10
0
100
200
300
400
500
600
Q
ual
it
y
f
ac
tor
Frequency (GHz)
POS1 POS2 POS3 POS4 (b)Figure 4: Capacitor performances in response of frequency for four DI water positions (a) capacitance value (b) quality factor.
The curves of Fig. 4 (a) show that the capacitance value increases exponentially in response of frequency up to resonant frequency (Fres); from there, capacitance value decreases and becomes negative. This change of sign indicates a new mode of operation, which becomes inductive.
Furthermore, we note that when the capacitor is empty, its value is minimal and increases with the progress of fluid circulation. This increase is followed by a degradation of quality factor as shown in Fig. 4 (b). Indeed, the quality factor reaches its maximum when the capacitor is empty and then it decreases rapidly with DI water displacement.
In order to investigate the effect of fluid variation, we have taken the value of the capacitor and the quality factor at 4.5 GHz for each fluid position. Fig. 5 below summarizes the different results: 0 1 2 3 4 0 18 36 54 72 90 Quality factor Capacitance (pF)
Liquid position
Q
ual
it
y
f
ac
tor
0 1 2 3 4 5 6C
apac
it
anc
e (pF
)
Figure 5: Capacitor performances variations at 4.5 GHz for four DI water positions.
According to Fig. 5, the capacitance value increases continuously with the penetration of DI water and reaches its maximum when it is completely filled. The capacitance value is comprised between Cmin = 0.11 pF and Cmax = 5.76 pF thus ensuring a very wide variation that reaches Tr = 5136%. However, the quality factor decreases from Qmax = 84.27 when it is empty to Qmin = 3.99 when it is fully filled with DI water.
2) RF performances analyses:
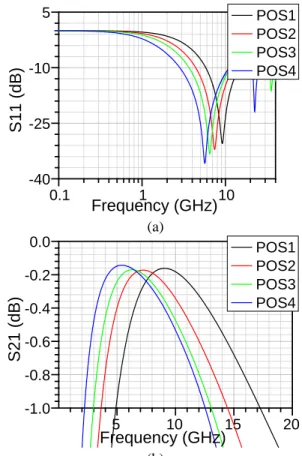
The Fig. 6 presents the variation of gain dB(S11) and dB(S21) in response of frequency for four DI water positions:
0.1 1 10 -40 -25 -10 5
S
11 (dB
)
Frequency (GHz)
POS1 POS2 POS3 POS4 (a) 5 10 15 20 -1.0 -0.8 -0.6 -0.4 -0.2 0.0S
21 (dB
)
Frequency (GHz)
POS1 POS2 POS3 POS4 (b)Figure 6: RF performances in response of four DI water positions (a) dB(S11) gain (b) dB(S21) gain.
Fig. 6 (a) illustrates the curves of dB(S11) as a function of frequency for the different positions of the fluid. We notice that the resonance frequency is maximum when the capacitance is empty and decreases with DI water penetration in microchannels. Furthermore, Fig. 6 (b) shows dB(S21) versus frequency curves for the different positions of the deionized water. It is clear that the frequency band is wider when the capacitor is empty and it decreases as a function of the filling with deionized water. We note that the range of the capacitive mode operation is described by dB(S21) gain. To better evaluate the resonant frequency variation, we have taken the minimum values of dB(S11) for each position of DI water (Fig. 7).
0 1 2 3 4 5 10 15 20 Return loss Insertion Loss (dB)
Liquid position
F
requenc
y
(G
H
z
)
-0.30 -0.25 -0.20 -0.15 -0.10I
ns
ert
ion Los
s
(dB
)
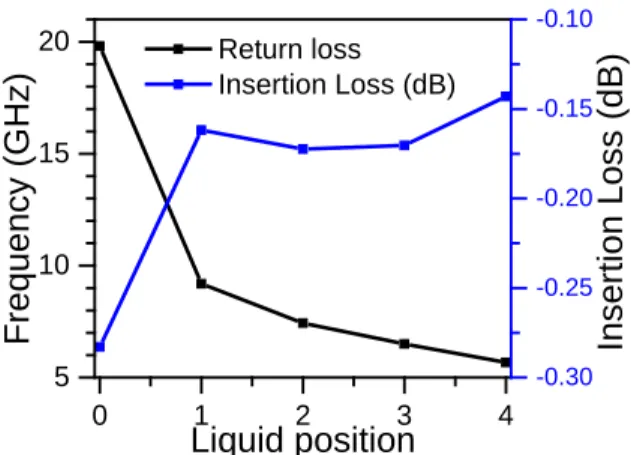
Figure 7: RF performances variations for four DI water positions.
The resonant frequency is comprised between 19.81 GHz when the capacitor is empty and 5.67 GHz when it is full. We obtain a broadband variation, which is greater than 240%. In addition, insertion loss is comprised between IL = -0.28 dB and IL = -0.14 dB. These results demonstrate a low insertion loss of the microfluidic capacitor for all DI water positions and could be used for high spectral microwave applications.
C. Conclusion
A wide tunable microfluidic RF MEMS capacitor is designed and analyzed. We have used FEM software in order to model the electric field and the current distribution for different DI water displacement. In addition, we have studied different performances of microfluidic capacitor in response of frequency for four DI water positions. The obtained results present an important variation of the capacitance value and a wide band of resonant frequency. Furthermore, the dB(S21) investigations exhibit a low insertion loss for all water positions.
REFERENCES
[1] Nieminem H., Ermolov V., Nybergh K., Silanto S., Ryhanen T., "Microelectromechanical capacitors for RF applications", Journal of Micromechanics and Microengineering, vol. 12, p. 177-186, 2002. [2] Seonho-seok, Wonseo-choi, Kukjin-chun, "A novel linearly tunable
MEMS variable capacitor", Journal of Micromechanics and Microengineering, n. 1, p. 82-86, 2002.
[3] OZ A., FEDDER G., "RF CMOS-MEMS capacitor having large tuning range", Transducers, Solid-State Sensors, Actuators and Microsystems, 12th International Conference, 2003.
[4] Nguyen H., Had D., Patterson P.R., Piywattanametha W., et al., "Angular vertical comb-driven tunable capacitor with high tuning capabilities", Journal of Microelectromechanical systems, Vol.3, p. 406-413, 2004.
[5] Gu L, Li X. "Rotational Driven RF Variable Capacitors with Post-CMOS Processes", Sensors and Actuators, vol. 29, no 2, p. 195-197, 2008.
[6] Habbachi, N., Boussetta, H., Boukabache, A., Kallala, M. A., Pons, P., & Besbes, K. (2016). Tunable MEMS capacitor: influence of fluids. Electronics Letters.
[7] Habbachi, N., Boussetta, H., Boukabache, A., Kallala, M. A., Pons, P., & Besbes, K. (2016). Fabrication and modeling of a capacitor microfluidically tuned by water. IEEE Electron Device Letters.
[8] El Gmati, I., Calmon, P. F., Boukabache, A., Pons, P., Fulcrand, R., Pinon, S., ... & Besbes, K. (2011). Fabrication and evaluation of an on-chip liquid micro-variable inductor. Journal of micromechanics and microengineering, 21(2), 025018.
[9] Pinon, S., Diedhiou, D. L., Gué, A. M., Fabre, N., Prigent, G., Conédéra, V., ... & Boukabache, A. (2012). "Development of a microsystem based on a microfluidic network to tune and reconfigure RF circuits". Journal of Micromechanics and Microengineering, 22(7), 074005.