HAL Id: hal-00300881
https://hal.archives-ouvertes.fr/hal-00300881
Submitted on 31 Jul 2002HAL is a multi-disciplinary open access
archive for the deposit and dissemination of sci-entific research documents, whether they are pub-lished or not. The documents may come from teaching and research institutions in France or abroad, or from public or private research centers.
L’archive ouverte pluridisciplinaire HAL, est destinée au dépôt et à la diffusion de documents scientifiques de niveau recherche, publiés ou non, émanant des établissements d’enseignement et de recherche français ou étrangers, des laboratoires publics ou privés.
Application of the Spectral Structure Parameterization
technique: retrieval of total water vapor columns from
GOME
R. Lang, J. E. Williams, W. J. van der Zande, A. N. Maurellis
To cite this version:
R. Lang, J. E. Williams, W. J. van der Zande, A. N. Maurellis. Application of the Spectral Structure Parameterization technique: retrieval of total water vapor columns from GOME. Atmospheric Chem-istry and Physics Discussions, European Geosciences Union, 2002, 2 (4), pp.1097-1130. �hal-00300881�
ACPD
2, 1097–1130, 2002 Retrieval of water vapor columns R. Lang et al. Title Page Abstract Introduction Conclusions References Tables Figures J I J I Back Close Full Screen / EscPrint Version Interactive Discussion
c
EGS 2002
Atmos. Chem. Phys. Discuss., 2, 1097–1130, 2002 www.atmos-chem-phys.org/acpd/2/1097/
c
European Geophysical Society 2002
Atmospheric Chemistry and Physics Discussions
Application of the Spectral Structure
Parameterization technique: retrieval of
total water vapor columns from GOME
R. Lang1,2,3, J. E. Williams1, W. J. van der Zande1, and A. N. Maurellis2 1FOM-Institute for Atomic and Molecular Physics, Amsterdam, The Netherlands 2
SRON National Institute for Space Research, Utrecht, The Netherlands 3
Department of Physics and Astronomy, Vrije Universiteit, Amsterdam, The Netherlands Received: 20 June 2002 – Accepted: 23 July 2002 – Published: 31 July 2002
ACPD
2, 1097–1130, 2002 Retrieval of water vapor columns R. Lang et al. Title Page Abstract Introduction Conclusions References Tables Figures J I J I Back Close Full Screen / EscPrint Version Interactive Discussion
c
EGS 2002
Abstract
We use a recently proposed spectral sampling technique for measurements of atmo-spheric transmissions called the Spectral Structure Parameterization (SSP) in order to retrieve total water vapor columns (WVC) from reflectivity spectra measured by the Global Ozone Monitoring Experiment (GOME). SSP provides a good compromise
be-5
tween efficiency and speed when performing retrievals on highly structured spectra of narrow-band absorbers like water vapor. We show that SSP can be implemented in a radiative transfer scheme which treats both direct-path absorption and absorption by singly scattered light directly. For the retrieval we exploit a ro-vibrational overtone band of water vapor located in the visible around 590 nm. We compare our results to
in-10
dependent values given by the data assimilation model of ECMWF. In addition, results are compared to those obtained from the more accurate, but slower, Optical Absorption Coefficient Spectroscopy (OACS).
1. Introduction
The retrieval of concentrations of narrow-band line absorbers, such as water vapor
15
(WV), from space-borne spectral instruments is often complicated by the relatively low resolution of the detector with respect to the width of an individual absorption line. For example, GOME spectral sampling in the visible region (channel 3) is 0.2 nm which covers up to 12 individual absorption lines of WV in the spectral region around 580 nm (ESA,1995). To allow accurate modeling of such absorption spectra requires a large
20
number of spectral realization points in order to resolve the narrowest lines, especially at high altitudes where pressure broadening is absent. In principle, band models, ex-ponential sum fitting methods or other opacity sampling techniques, like the well known k-distribution method (Lacis and Oinas,1991;Kato et al.,1999), and the more recently proposed Optical Absorption Coefficient Spectroscopy technique (OACS) (Maurellis et
25
ACPD
2, 1097–1130, 2002 Retrieval of water vapor columns R. Lang et al. Title Page Abstract Introduction Conclusions References Tables Figures J I J I Back Close Full Screen / EscPrint Version Interactive Discussion
c
EGS 2002
latter two methods use opacity sampling probability functions to represent the effective absorption within a specific spectral sampling interval. These probabilities are then used either directly (OACS), or indirectly, via a transformation from wavelength into cross-section space (k-distribution), as weighting functions of a set of opacity basis functions, whose summation replaces a computationally expensive spectral sampling
5
integral. Both of these methods have demonstrated their ability to solve the problem of spectral sampling in an accurate and efficient way for atmospheric water vapor absorp-tion, in case of OACS utilizing GOME measurements in the absorption region around 590 nm (Lang et al.,2002) and, in case of the k-distribution method, on synthetic spec-tra in the IR regions of the SCanning Imaging Absorption CartograpHY (SCIAMACHY)
10
instrument on ESA’s Environmental satellite ENVISAT (Buchwitz et al.,2000).
In contrast, in the Spectral Structure Parameterization (SSP) recently proposed by
Maurellis et al. (2000b) and applied here for the first time to retrievals from reflectiv-ity measurements, the number of opacreflectiv-ity functions and their weights are reduced to only one basis function with one weighting parameter, called the spectral structure
pa-15
rameter w, which characterizes the spectral structure of the absorber within a specific wavelength range and at a specific altitude. SSP lends itself therefore more to the ba-sic concept of band models, where the average absorption over a specific wavelength interval is represented by averaged line parameter values. Different to band models, SSP is well suited for relatively small sampling regions containing only a small number
20
of distinct absorption lines, such as those found in the regions covered by the detec-tor pixels of both GOME and SCIAMACHY (both instruments work at relatively high spectral resolution across a wide wavelength region). In addition, the implementation of SSP in a radiative transfer scheme including direct path absorption, as well as the contribution of single-scattering to the measured reflectivities, is relatively simple and
25
requires only a small amount of computational effort. Consequently, SSP retrieval of WVC is fast and may be performed on a global scale in a reasonable time, as demon-strated in this paper .
ACPD
2, 1097–1130, 2002 Retrieval of water vapor columns R. Lang et al. Title Page Abstract Introduction Conclusions References Tables Figures J I J I Back Close Full Screen / EscPrint Version Interactive Discussion
c
EGS 2002
andCasadio et al.(2000) utilizing absorption bands in the region around 700 and 740 nm, respectively. We are focussing on a ro-vibrational overtone band of WV in the visible between 580 and 605 nm covered by the GOME instrument. This band was first exploited for the retrieval of WVC byMaurellis et al.(2000a), using the OACS sampling technique. SSP is a retrieval method, which is easy to implement, fast, self-contained
5
and based on first principles. The only inputs needed for the retrieval of WVC by SSP are pressure and temperature profiles together with some information on background absorbers, which are, for global retrievals, taken from climatology models or GOME level 2 data. SSP retrieves subcolumn profile over 18 atmospheric levels from which a total column is calculated. The only constraints applied to the fits are three standard
10
upper profile constraints for tropical, mid-latitude and high-latitude cases.
In the following section we briefly summarize the basic concept of SSP for homo-geneous atmospheres. Then we show how SSP can be applied to nadir satellite re-flectivity measurements probing nonhomogeneous atmospheres, including light paths where photons undergo a single scattering event. Thereafter, we present results of
15
SSP forward-modeled reflectivity spectra, which we compare to both line-by-line (lbl) forward-modeled spectra, as well as GOME measurements. SSP retrieval results from lbl forward-modeled spectra are used to assess the method related bias and to intro-duce a retrieval correction term for high WVC values. The impact of multiple scatter-ing and aerosol loadscatter-ing on the retrieval values will also be discussed in some detail.
20
We then expand our retrievals to both a single GOME track and a global coverage (i.e. three days of continuous GOME measurements). The results are compared and discussed with respect to co-located WVC given by the European Center of Medium Range Weather Forecast (ECMWF) data assimilation model, after which we present our conclusions.
ACPD
2, 1097–1130, 2002 Retrieval of water vapor columns R. Lang et al. Title Page Abstract Introduction Conclusions References Tables Figures J I J I Back Close Full Screen / EscPrint Version Interactive Discussion
c
EGS 2002
2. Sampling of homogeneous absorption
For homogeneous absorption over a direct path in the absence of any scattering events, the spectrally sampled transmittance may be defined as
hT iδλ= Z
δλ
exp(−σ(λ)N)d λ
δλ, (1)
where σ(λ) is the absorption cross-section, N is the total column density and δλ is the
5
sampling width. The transmittance hT iδλ may also be expressed as:
hT iδλ= 1 + w exp(−SN) − w. (2)
Here, S has units of cross-section, therefore, determines the height of a box with width w(0 < w ≤ 1) in units of δλ−1, which covers the area of absorption equivalent to the area covered by the individual lines of the absorber within the spectral region δλ
10
(see Fig.1) with
hσ(λ)iδλ = wS, (3)
and the pixel-averaged optical depth hτiδλ = wSN. w and S are now defined by the simultaneous solution of Eqs. (2) and (3) with the result that they are implicitly depen-dent on N. A Taylor expansion to second order of the exponents in Eqs. (1) and (2)
15 reveals that w≈ hσi 2 δλ hσ2i δλ and S ≈ hσ 2i δλ hσiδλ . (4)
The latter is a good approximation of w and S in cases of a wavelength-averaged optical depth of lower than 0.1 (Maurellis et al.,2000b).
ACPD
2, 1097–1130, 2002 Retrieval of water vapor columns R. Lang et al. Title Page Abstract Introduction Conclusions References Tables Figures J I J I Back Close Full Screen / EscPrint Version Interactive Discussion
c
EGS 2002
3. Application to nadir measurements in nonhomogeneous atmospheres
For the specific scenario of modeling the WV absorption from a nadir viewing geome-try, we subdivide the atmosphere into 18 levels `, containing WV subcolumn densities N`. For real measurements, pressure and temperature profiles, as well as oxygen and nitrogen profiles for the calculation of Rayleigh scattering albedo, are taken from the
5
Neutral Atmosphere Empirical Model MSISE90 (Hedin et al.,1991) for a given date, time, and geolocation at fixed altitude levels. We use 18 atmospheric layers ` to cover altitudes from the ground up to 9 km and, therefore, more than 99% of the atmospheric water vapor. The WV density drops generally by more than 2 orders of magnitude over the first 10 km (see, alsoLang et al.,2002). In general, the w width parameter
10
or, respectively, the structure of the spectrum, changes with pressure and tempera-ture over altitude due to the pressure and temperatempera-ture dependent width of the lines. The same holds for the pixel-averaged line strength S. For the treatment of nonhomo-geneous paths traversed by photons undergoing higher orders of scattering we now assume that the absorption over the different light paths throughout the atmosphere is
15
dominated by the level with the maximum absorption, as is the shape of the measured absorption line. Consequently, the choice of a dominant absorbing layer is dependent on the shape of the profile of the absorber of interest. Note, that due to the strong exponential decrease of the WV profile with respect to altitude, we may assume that the maximum impact on the absorption over a specific light path will occur at the lowest
20
point of the path. A solution of the transport equation of scalar radiative transfer in its plane parallel approximation (Lang et al.,2002) reveals that the measured reflectivity R of a nadir viewing instrument may be separated into three distinctive parts, viz.,
Rj = ΛhRsurfij + hRssij + hRmsij, (5)
where j is a specific spectral interval with width δλ,Λ is the surface-albedo of a
Lam-25
bertian surface, Rsurf,j is the reflectivity of the direct light path reflected at the earth surface, Rss,j is the reflectivity of singly scattered and Rms,j of multiply scattered light. Using the assumption above on the dominant w-parameter, we define wmax= w(N( ¯`)),
ACPD
2, 1097–1130, 2002 Retrieval of water vapor columns R. Lang et al. Title Page Abstract Introduction Conclusions References Tables Figures J I J I Back Close Full Screen / EscPrint Version Interactive Discussion
c
EGS 2002
where N( ¯`) is the maximum subcolumn density for a specific path at level ¯`. Now, we may write the reflected light coming from the surface, utilizing Eq. (2), as
hRsurfij = 1 + w( ¯`surf)jexp " −X ` ˜ µS(`)jN(`) # − w( ¯`surf)j, (6)
where ˜µ is the geometric path-length factor for a nadir viewing instrument, with ˜µ ≡ (µ1
o + 1), µo is the cosine of the solar zenith angle (SZA) and w( ¯`surf)j is the dominant
5
w-parameter wmaxfor the specific case of the direct, surface reflected path. Because, in the case of WV absorption, we expect the maximum optical density at the surface layer we may set ¯`surf = 1. Using the same reasoning for the single-scattering contribution we can then write, by again utilizing Eq. (2),
hRssij =p(Θ) 4µ0 Z∞ 0 hβ(`(z))scaij 10 × 1+ w( ¯`ss)jexp − `top X `=`(z) ˜ µS(`)jN(`) − w ( ¯`ss)j dz , (7)
where ¯`ss = `(z), because `(z) is the lowest altitude point for each single-scattering path and, therefore, in the case of WV, the point with most impact on the absorption. In addition, we assume that Rayleigh scattering is the dominant form of single-scattering and hβ(`(z))scaij is the mean Rayleigh scattering coefficient within δλj at altitude z,
15
with a corresponding phase function of p(Θ) = 34(1+ cos2(Θ)), where Θ denotes the SZA.
The multiple-scattering contribution hRmsij to the reflected light is represented by a first order polynomial with free parameters C and D, which accounts for the broad-band effect of multiple scattering. In the previous study by Lang et al. (2002) it was
20
shown that the error on the retrieved WVC using this kind of treatment for the multiple-scattering contribution is lower than 20% in cloud-free situations for a worst-case sce-nario of high WVC of 1.4 × 10²³ molec/cm2, low surface albedo of 0.03 and 0.1 and
ACPD
2, 1097–1130, 2002 Retrieval of water vapor columns R. Lang et al. Title Page Abstract Introduction Conclusions References Tables Figures J I J I Back Close Full Screen / EscPrint Version Interactive Discussion
c
EGS 2002
high aerosol loading for maritime and rural scenarios, respectively, utilizing the OACS retrieval technique (see also Sect. 7 for the impact of aerosol loading and multiple-scattering on the SSP retrieval). Similarly, the unknown surface albedo is represented by a first order polynomial with free parameters A and B. The parameters A to D have to be adjusted to the real measurement when comparing SSP forward model results to
5
the measurements, as well as during the retrieval and fitting of WVC values.
For details concerning the different contributions to the total reflectivity, as well as a detailed discussion about the impact of multiple scattering within this wavelength region, the reader is referred to the aforementioned study byLang et al.(2002) and, for the specific case of SSP, to section7of this work.
10
4. Construction of look-up-tables for w and S
In this study we utilize Eq. (4) in order to construct a look-up-table for each of the param-eters w and S. For a range of 22 temperatures T and 31 pressure values p, covering all p and T values thought relevant for our altitude region of interest for all possible geolo-cations, we then calculate realizations of the cross-section σ utilizing line-parameters
15
from the HITRAN ’96 database and Voigt absorption line shapes (Armstrong, 1967). For those realizations we use 50 000 numerical grid points over the whole spectral re-gion between 585 and 600 nm, in order to resolve the narrowest lines with at least 5 points. We use a sampling width δλ, which is three times smaller than the sampling width of a GOME detector pixel and more than 4 times smaller than the
full-width-half-20
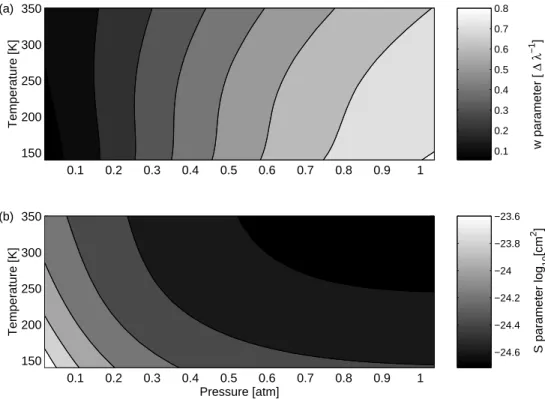
maximum (FWHM) of the instrumental response function, which satisfies the Nyquist criterion (see also following section) and results in a total of 207 spectral bins. By do-ing so we create for each parameter w and S, a 22 by 31 by 207 look-up-table matrix which we can interpolate over p and T for a specific measurement scenario at each altitude level `. Figure2shows w and S for one wavelength bin j as a function of the
25
p and T reference profiles. From this we see that w and S vary smoothly with respect to p and T , meaning that interpolation on intermediate p, T -tuples leads to reasonable
ACPD
2, 1097–1130, 2002 Retrieval of water vapor columns R. Lang et al. Title Page Abstract Introduction Conclusions References Tables Figures J I J I Back Close Full Screen / EscPrint Version Interactive Discussion
c
EGS 2002
results (Maurellis et al.,2000b). As the pressure decreases the w parameter also de-creases (upper panel Fig.2), i.e. the spectrum becomes more structured due to the pressure-related narrowing of the lines. The line width is only weakly dependent on the temperature (Rothman et al.,1998) which can also be seen from the w contour plot. The S parameter (lower panel Fig.2) changes significantly only for the lowest
5
pressures. For low pressures, when the w parameter decreases, the S parameter in-creases, because the area of absorption or the averaged line intensity within a certain wavelength bin has to be conserved. Due to the temperature dependence of the line-intensity value of individual absorption lines (Rothman et al., 1998), the variation in temperature for the S parameter is stronger than that for the w parameter.
10
In general, the w,S-tables are smaller than the usual tables used for the k-distribution method, and significantly smaller than the look-up-tables used for the OACS method, because the extra dimension for the summation over section probability, or cross-section bin space, necessary in the latter two methods, is not required for SSP. There-fore, the interpolation on the look-up-tables can be performed very rapidly even for
15
small∆λ, and thus, for high wavelength resolution.
5. Forward modeling and retrieval
The spectral region between 585 and 600 nm is covered by 69 detector pixels of the GOME instrument. Within this region absorptions of the additional absorbers (O2)2, O3, NO2and Sodium have to be taken into account, together with the loss of light scattered
20
out of the light path by means of Rayleigh scattering. Apart from Sodium and NO2, which contributes very little to the total absorption in this spectral region, all of these remaining absorbers contribute to a smooth background absorption. The contribution of the Fraunhofer line absorption to the so called F0 effect and the contribution of the Ring effect, from rotational Raman-scattering, to the total reflectivity is also assumed
25
to be rather small within this spectral region (for a detailed discussion the reader is referred to Lang et al.,2002).
ACPD
2, 1097–1130, 2002 Retrieval of water vapor columns R. Lang et al. Title Page Abstract Introduction Conclusions References Tables Figures J I J I Back Close Full Screen / EscPrint Version Interactive Discussion
c
EGS 2002
GOME measures the earth radiance I in nadir viewing geometry for a footprint of 40 by 320 km. The solar irradiance F0 is measured once for every orbit (for a detailed description of the instrument seeESA,1995;Burrows et al.,1999). The instrumental function H(λ, λ0;Σ) of channel 3 is represented here by a Gaussian function with a FWHMΣ. The reflectivity measured by the kth detector pixel is then defined as
5 RkGOME= Z ∆λk Z+∞ −∞ πI(λ) µoFoH(λ, λ 0;Σ)dλ0 dλ ∆λk , (8)
where∆λk is the wavelength coverage of a GOME detector pixel of about 0.21 nm in case of channel 3. Here, it is assumed that the solar irradiance F0 is constant within ∆λk. The modeled reflectivity Rk can be approximated by
Rk = K X j M X i RjH(λj, λi;Σ)δλi δλj ∆λk , (9) 10
where M is the number of sampling bins j over the total spectral region of interest, K is the number of sampling bins j within the spectral region covered by one GOME detector pixel and |δλi ,j|= K−1∆λk. Rj is the sampled reflectivity from Eq. (5) with Rj = (Aλj + B)hRsurfij + hRssij + (Cλj + D). (10)
Here, it must be noted that Eq. (9) is only a good representation of Eq. (8) when
15
δλ Σ, satisfying the Nyquist criterion. In our case δλ (around 0.07 nm) is a third of the spectral width covered by a single GOME detector pixel (K = 3), whilst Σ is about 0.29 nm.
In Fig.3we present a direct comparison between sample GOME measurements and forward calculations using Eq. (9) for two representative measurement geometries and
20
geolocations with both high and low WVC. Realistic WV profiles used for the forward calculations are taken from the ECMWF database, with the resulting fit residuals being smaller than 1%, except for the region near the solar sodium Fraunhofer lines which is not explicitly modeled here.
ACPD
2, 1097–1130, 2002 Retrieval of water vapor columns R. Lang et al. Title Page Abstract Introduction Conclusions References Tables Figures J I J I Back Close Full Screen / EscPrint Version Interactive Discussion
c
EGS 2002
For the SSP retrievals we fit Eq. (9) to GOME reflectivity spectra utilizing a robust, non-linear, large-scale trust-region method (Byrd et al.,1988), which solves the opti-mization problem min N`,(A...D) X k h RkGOME− Rk(N`, (A...D))i2. (11)
Each SSP fit is initialized with a flat WV subcolumn profile N`,0 = 1016, where the
5
N` are given in units of subcolumn density. Each fit is constrained by an upper limit N < N`,max in the form of a step function. N`,max consists out of three steps over the total number of levels with high values over the first three kilometers, medium values between 3 and 5 km, and low values for the higher levels. The lower profile constraint is set to N`,lower = 0. The constraints prevent the fit from giving too much weight to
10
the higher altitude levels, which otherwise would increase the relative contribution of the singly scattered photons to unrealistic values by setting the surface albedo to zero and, in doing so, decrease the total mean free path length. We scale the upper profile constraint differently for geolocations between 30◦N and 30◦S latitude, between 30◦ and 60◦latitude and latitudes above or below 60◦.
15
6. Method accuracy and bias adjustment
Two important assumptions were made in the derivation of Eqs. (6) and (7): (i) the analytical derivation of the w and S parameter (Eq.4) which is only accurate for optical densities lower than 0.1 and (ii) the assumption on the dominant spectral structure parameter wmaxfor individual light path of single-scattered photons (Sect.3). The bias
20
introduced due to these assumptions we call the method-related bias of SSP.
In principle, by reducing the thickness of the individual layers (i.e. utilizing more altitude layers) the optical thickness per layer may be always reduced below the 0.1 limit, where analytical derivation for w and S are a good approximation of the real value and the non-linear nature of the absorption of individual lines per layer becomes
ACPD
2, 1097–1130, 2002 Retrieval of water vapor columns R. Lang et al. Title Page Abstract Introduction Conclusions References Tables Figures J I J I Back Close Full Screen / EscPrint Version Interactive Discussion
c
EGS 2002
weakened. However, increasing the number of altitude layers increases the number of fit parameters and makes the optimization procedure computationally more expensive without gaining much additional information about the profile. Figure4shows that, by using 18 altitude layers, the spectrally averaged optical density per layer is significantly below the 0.1 using a high WVC of 1.84×10²³molec/cm2. Therefore, in our case, the
5
analytical derivation of w and S is a good assumption and does not contribute to the method-related bias. Consequently, our assumption of the dominant spectral structure parameter wmax, which is equal to the w value for the layer with the highest optical density in the path, creates a bias. The fixed wmaxis usually higher with respect to what the real w parameter per layer would be. From Eq. (2), an underestimation follows for
10
high WVC.
In order to quantify this bias and to correct for it, we perform SSP retrievals of 26 lbl forward-modeled reflectivity spectra on the basis of Eq. (10) from a range of WV pro-files, with the total WVC ranging between 8 × 10²¹ and 1.8 × 10²³molec/cm2. These profiles were taken from the ECMWF database and chosen to be representative of a
15
wide range of significantly different geolocations. The contributions by the additional background absorbers were also accounted for. In order to make a direct comparison, realistic values for the variables A to D were obtained from the best fit of the forward-lbl modeling results to GOME measurements taken at corresponding geolocations.
The results are summarized in Fig. 5, which shows the relative and absolute di
ffer-20
ences between WVCs retrieved using SSP and that used for the forward-lbl modeling, respectively. For low- and mid-range columns (≤1× 10²³ molec/cm2) the maximal dif-ferences between the retrieved and the true values is about 10%. For instances of very low WVC (<1× 10²² molec/cm2) which occur predominantly at high latitudes, the dif-ferences are larger due to the high SZA which are usually associated with such GOME
25
measurements. Note that together with the lowest WVC (i.e. 8× 10²¹ molec/cm2) uti-lized in the forward-lbl calculations, a SZA of 61◦was used, which corresponds roughly to latitudes >70◦. The accuracy (dotted line Fig.5a) for low and mid columns up to 1× 10²³molec/cm2, calculated from the mean relative differences, is −1.1%.
ACPD
2, 1097–1130, 2002 Retrieval of water vapor columns R. Lang et al. Title Page Abstract Introduction Conclusions References Tables Figures J I J I Back Close Full Screen / EscPrint Version Interactive Discussion
c
EGS 2002
For instances of high WVC (>1× 10²³ molec/cm2) the systematic retrieval bias in-creases up to a maximum of −20%, which is referred to as the underestimation of the WVC by the dominant layer assumption. An empirical correction term was found by fit-ting a second-order polynomial (solid line in Fig.5b) to the absolute differences, which results in
5
W V Ccorr= −0.018 ∗ (W V C − 0.096)2+ 0.164 ∗ (W V C − 0.096) − 0.283, (12) where the WVC is in units of 1022molec/cm2(Fig.5).
7. Aerosol loading and multiple scattering
Even in the absence of clouds, the background aerosol may cause a significant error in the retrieved WVC value. Aerosols may affect the net absorption, as well as the path
10
length of the scattered light and, therefore, affect the assumptions made with respect to scattering and surface albedo.
The full effect of multiple scattering and aerosols on the retrieved WVC has been estimated by solving the full scalar radiative transfer equation, including the multiple scattering source term, by employing a doubling-adding model (DAM) (de Haan et al.,
15
1987), which has been reduced to the scalar representation of the radiation field. The reflectance R(λ) is calculated in a line-by-line mode for a spectral resolution of 0.01 cm−1.
We investigate four atmospheric scenarios: a maritime case and a rural boundary layer case both with and without aerosol loading (clear-sky scenario). The clear sky
20
scenario solely quantifies the contribution of multiple Rayleigh scattering and its impact on the retrieved WVC. All scenarios include the effects of Rayleigh scattering, ozone absorption and Lambertian surface reflection. In the case of the maritime scene we use a surface albedo of 0.03, whereas for the rural scene a surface albedo of 0.1 is used. For maritime aerosol loading a constant particle density of 4000 particles per
25
ACPD
2, 1097–1130, 2002 Retrieval of water vapor columns R. Lang et al. Title Page Abstract Introduction Conclusions References Tables Figures J I J I Back Close Full Screen / EscPrint Version Interactive Discussion
c
EGS 2002
background aerosol, for which the particle density decreases with the third power in pressure with the optical properties of the aerosols being taken fromShettle and Fenn
(1979). In the rural case we have chosen a constant, but much higher, particle density of 15 000 particles per cm3.
Table1lists the relative contribution of ground-reflected, single and multiple-scattered
5
photons as a percentage of the total reflectivity using the DAM-model for the four dif-ferent aerosol loading cases described above and with a medium WVC of 7.72×10²² molec/cm2, for which the systematic method related bias may be neglected. Without aerosols, the maximum contribution of multiply-scattered photons is about 8% at 590 nm. Single scattering is the dominant source of reflectivity for the maritime aerosol
10
scenario (47%) because of low surface albedo, with the ground-reflected component being comparable or lower than the contribution due to multiple scattering. This may be contrasted with the rural aerosol scenario, in which multiple scattering is the dominant source of scattered light (51%) due to the high aerosol optical density. Aerosols reduce the ground-reflected component down to 13%.
15
The first-order polynomial utilized in this retrieval to implement multiple-scattering (Eq.5) does not account for a differential contribution reflecting the absorption by water vapor, but only for the broad-band effect. The retrieval of parameters C and D may, therefore, influence the retrieval of the surface albedo (parameters A and B) and the WVC.
20
Table 1 also includes the SSP retrieved WVC and surface albedo values from the DAM forward-modeled reflectivity spectra for the four scenarios. The results show that SSP retrieves accurate values for both of the clear sky situations. It underestimates the WVC by 12%, in the case of maritime aerosol loading, and overestimates it by 18% in case of rural aerosol loading. The error in the retrieved albedo is generally of the order
25
of 20%, except for the maritime case, where the aerosol layer above the surface alters the retrieved surface albedo value significantly resulting in a decrease in the retrieved WVC.
ACPD
2, 1097–1130, 2002 Retrieval of water vapor columns R. Lang et al. Title Page Abstract Introduction Conclusions References Tables Figures J I J I Back Close Full Screen / EscPrint Version Interactive Discussion
c
EGS 2002
previous section). After application of the empirical correction (Table2), the error due to multiple scattering for the maritime and rural case is less than 6 and 2%, respectively (clear sky cases). The impact due to maritime and rural aerosol loading on the retrieved column is less than 9 and 14%, respectively, after correction for the method-related bias.
5
8. Results for single GOME pass
Figure6a shows uncorrected WVC results (stars) using SSP for the GOME pass on 23 October 1998, between 80◦S and 80◦N in latitude and longitudes between 90◦W and 150◦W, which contains a total of 476 ground-pixel nadir measurements. For compari-son, we show values from the OACS method utilizing the same GOME measurements
10
(solid line) and exploiting the same spectral region, together with co-located values from ECMWF (solid line with dots).
In general, the SSP values compare well with the ECMWF values, except in sit-uations where the percentage cloud cover significantly exceeds 10%. This may be explained by an enhanced photon path length, as is modeled by SSP, due to an
15
enhanced contribution of multiple-scattered photons in case of the presence of thick clouds. Moreover, the presence of a significant cloud cover will reduce the transmis-sion of light to the lower layers of the atmosphere where most of the water vapor is located. These two effects occasionally tend to cancel each other, as for the first the SSP model underestimates the absorption resulting in an overestimation of the WVC
20
by the fitting procedure, whilst for the second SSP overestimates the absorption result-ing in an underestimation of the WVC.
In comparison to the similarly implemented but more accurate OACS sampling method, the uncorrected SSP results systematically underestimate the higher columns, as would be expected considering the method related bias of SSP (see Sect. 6). The highest
25
WVC in the tropics are systematically 15 to 20% lower than those of the other datasets. The circles in Fig.6show SSP retrieved WVC after the bias-correction (Eq.12) for
val-ACPD
2, 1097–1130, 2002 Retrieval of water vapor columns R. Lang et al. Title Page Abstract Introduction Conclusions References Tables Figures J I J I Back Close Full Screen / EscPrint Version Interactive Discussion
c
EGS 2002
ues >1×10²³molec/cm2were applied.
A critical parameter which governs the accurate retrieval of WVC is the shape of the resulting subcolumn profile retrieved by SSP. Due to the effect of the altitude de-pendence of both p and T on the spectral structure of WV, the effective absorption is governed by the specific atmospheric paths through which the photons travel. The
5
retrieval of an unrealistic shape of the retrieved subcolumn profile may, therefore, un-realistically alter the weights of various atmospheric paths, i.e. the relative contribution between ground-reflected, singly and multiply scattered light. This yields an error in the retrieved surface albedo, which weights the direct, ground-reflected, light path con-tribution (Eq.5) or an error in the retrieved broad-band multiple scattering contribution.
10
This error propagates into the final retrieved column. From Fig.7we can see that the differences between the WVC values retrieved by OACS and SSP, and the differences between the surface albedo values retrieved by both methods, are very well corre-lated. Introducing upper fit constraints assists both methods in finding the accurate profile shapes but the OACS method is, due to its more accurate treatment of the
rep-15
resentation of the spectral structure at each altitude level, superior to the SSP method, resulting in higher sensitivity and better agreement with the independent data-set from ECMWF, especially for high WVC. However, a big benefit of SSP is that it is about 4 to 5 times faster than the OACS method even though it uses a higher sampling resolution then the one chosen for OACS inLang et al.(2002).
20
9. Global retrieval results
Finally we present the results of a global WVC retrieval utilizing 47 000 ground pixels from GOME between 70◦S and 70◦N latitude on 22–24 October 1998 using the SSP method. The globally corrected results (Eq.12) are shown in the global plot in Fig.8a. For comparison we show the global WVC, as given by ECMWF, on 23 October 1998,
25
18:00 UTC (Fig.8b). Figure8c shows the global WVC as retrieved by SSP for cloud-free pixels, i.e. where the cloud-fraction is reported to be lower than 10%. The cloud
ACPD
2, 1097–1130, 2002 Retrieval of water vapor columns R. Lang et al. Title Page Abstract Introduction Conclusions References Tables Figures J I J I Back Close Full Screen / EscPrint Version Interactive Discussion
c
EGS 2002
cover fraction was taken as reported by the GOME Data Processor (GDP) level 2 data (Balzer and Loyola,1996;DLR,1999). This fraction is derived by the initial cloud fitting algorithm (ICFA) with the cloud top pressure being taken from the International Satellite Cloud Climatology project (ISCCP) (Koelemeijer et al.,1999).
The general latitudinal dependence of WV concentration, with high WVC in the
equa-5
torial regions and low WVC towards the poles, is well represented by the SSP retrieval results. Individual features common to both the ECMWF model results and the SSP results may also be identified as, for example, the low WVC above north-west China and the Gobi desert as well as in the United States at this time above North-west Car-olina. A similar transition from low to high WVC can be observed from the southern
10
part of the United States to Mexico and the Caribbean Sea. However, GOME-SSP WVC results show significantly lower values compared to ECMWF above the Sahara, Saudi Arabia and the Andes around 40◦S latitude. SSP retrieves high WVC above the Philippine Sea north of New Guinea where the ECMWF model reports only medium water vapor concentrations.
15
Figure 9 shows a scatter plot between SSP retrieved WVC from GOME and collo-cated WVC data reported by ECMWF, where the GOME measurements coincide with ECMWF data within a 1 hour time window at 23 October 1998. We compare 420 GOME measurements with a GDP level 2 data reported cloud fraction of less than 10%. The gradient of the scatter data is 0.98 with a maximum scatter of 50%.
20
10. Discussion
Differences in the surface albedo retrieved by the OACS sampling technique and SSP, both exploiting the same WV absorption band, lead to overall differences between the retrieved WVC. The difficulties in the retrieval of the correct surface albedo is a gen-eral problem for nadir remote-sensing techniques, especially during instances of high
25
aerosol optical depth. This is due to the uncertain contribution to the backscattered light introduced by aerosol layers, with the aerosol profile being a critical parameter.
ACPD
2, 1097–1130, 2002 Retrieval of water vapor columns R. Lang et al. Title Page Abstract Introduction Conclusions References Tables Figures J I J I Back Close Full Screen / EscPrint Version Interactive Discussion
c
EGS 2002
Moreover, surface albedo is also dependent on wavelength, geolocations and season. In our wavelength region of interest, the utilized first-order polynomial is a good ap-proach for the wavelength dependence of the albedo for most cases (Koelemeijer et
al.,1997). We find, that the accuracy of the retrieved values and the gradients of the surface albedo are correlated with the shape of the retrieved WVC profile and the
re-5
trieved contribution of multiply scattered photons, which is also accounted for by a first order polynomial. For this reason, we introduced three different step functions, depend-ing on geolocation, as upper constraints for the retrieved profile, in order to prevent the optimization method occasionally finding a local fit minima by setting the ground albedo to zero and unrealistically increasing the scattering components.
10
An additional concern for any WV retrieval approach is the accuracy and complete-ness of the cross-section database used for the construction of the w–S look-up table. From recent measurement studies of water vapor absorption bands other than the one used in this study, Learner et al. (2000) recently showed discrepancies ranging from about 100% for small lines to about 20% for strong lines for the main water vapor
ab-15
sorption bands in the region between 1110 and 685 nm. They also found systematic differences in various bands ranging from 6% to 33%. Even though measurements by
Learner et al.(2000) in the wavelength range between 585 and 600 nm have not been studied, large differences in some of the water absorption bands between 1110 and 685 nm suggest the presence of potentially large uncertainties in the reference
cross-20
sections of the HITRAN’96 database used in this study. In addition, the presence of many weak absorption lines, not accounted for in the HITRAN’96 database, may con-tribute to an additional background absorption, which may affect the retrieval of both surface albedo and broad-band multiple-scattering contribution and, therefore, also the retrieval of WVC.
25
The contribution of aerosols and clouds to the error in the retrieved column, as given in Sect.7, can only be estimated. In the case of aerosols, this is due to their high vari-ability in optical depth, concentration profile and scattering probabilities, all of which depend on geolocation and season. In the case of clouds, the uncertainties arise from
ACPD
2, 1097–1130, 2002 Retrieval of water vapor columns R. Lang et al. Title Page Abstract Introduction Conclusions References Tables Figures J I J I Back Close Full Screen / EscPrint Version Interactive Discussion
c
EGS 2002
the high variability with respect to cloud-top heights, form and density of clouds. Fur-thermore, the scatter between SSP-retrieved WVC values and those given by ECMWF may also be affected by systematic errors for cases, where the cloud-fraction is re-ported to be less than 10%. Differences in the reported cloud-fraction by GDP level 2 data with respect to the co-located Along Track Scanning Radiometer-2 (ATSR-2) can
5
be as much as 18% (Koelemeijer et al.,1999).
11. Conclusion
In this study the spectral structure parameterization technique has been implemented and tested for retrieval of total WVC from GOME measurements utilizing a radiative transfer scheme, which includes molecular clear-sky direct-path absorption as well
10
as molecular clear-sky single-scattering, together with a broadband approximation of higher orders of scattering. The radiative transfer scheme was previously used for re-trieval of total WVC using the Optical Absorption Coefficient Spectroscopy. SSP is less accurate and less sensitive than the OACS retrieval method but significantly faster and easier to implement. Retrieval of WVC using SSP for one ground pixel takes less than
15
30 seconds on a Pentium III, 800 MHz, using an uncompiled MATLAB retrieval code, and requires less than 128 MB internal memory.
Whereas OACS utilizes a spectral sampling technique based on cross-section prob-ability density distribution functions, SSP utilizes average line parameters within the sampling region, and is, therefore, conceptually closer to band models. From retrieval
20
studies of synthetic spectra we conclude that the sensitivity of SSP is better than 10% and the accuracy is about 1% for WVC lower than 1 × 10²³molec/cm2. For WVC above this limit, a systematic offset of up to 20% is introduced by using an analytical second-order approach for the determination of the average line parameters w and S (Eq.4). Moreover, the assumption of a dominant absorbing layer applied to the modeling of
25
nonhomogeneous paths (Sect.3and Eq.7) also introduces a bias. This bias has been corrected for in the current study by applying an empirical second-order polynomial
ACPD
2, 1097–1130, 2002 Retrieval of water vapor columns R. Lang et al. Title Page Abstract Introduction Conclusions References Tables Figures J I J I Back Close Full Screen / EscPrint Version Interactive Discussion
c
EGS 2002
(Sect.6).
We studied the impact of aerosols and the differential contribution of multiple scat-tering for four different scenarios utilizing synthetic spectra from a doubling adding radiative transfer method. For medium WVC, for which no correction is needed, the multiple-scattering impact on the SSP retrieved WVC is below 1%. Neglecting
mar-5
itime aerosols and rural aerosols results in a retrieval error of less than 13 and 19% respectively. For corrected high WVC (Table2) the error due to multiple scattering for maritime and rural scenario is less than 6 and 2%, respectively (clear sky cases). Here, the impact due to maritime and rural aerosols on the retrieved column is less than −9 and+14%, respectively, after correction for the method-related bias.
10
A global comparison between SSP retrieved WVC and data from ECMWF shows good general agreement in the latitudinal dependence of the water vapor concentra-tion. However, significant regional differences, for example, over the Sahara and the Philippine Sea are found. The higher spatial resolution of the GOME measurements over sea and land with respect to ECMWF, where the density of ground measurements
15
is low, is clearly an advantage of this kind of SSP retrieval from GOME. However, ECMWF data is provided for a specific time and day, whereas global GOME retrieval results, as shown in Fig.8, are collected over three days. Wide parts of the differences in the global data set may, therefore, also be related to changes in the global water vapor distribution over the analysis period. The scatter plot comparison between SSP
20
and ECMWF (Fig.9), as well as the single GOME pass comparison (Fig. 6), are cor-related in time and geolocation. The scatter plot shows good correlation between the two data-sets of correlated cloud-free ocean pixel with a gradient of 0.98. However, in some cases, the scatter can be as high as 50%, which points to local differences between the two data products.
ACPD
2, 1097–1130, 2002 Retrieval of water vapor columns R. Lang et al. Title Page Abstract Introduction Conclusions References Tables Figures J I J I Back Close Full Screen / EscPrint Version Interactive Discussion
c
EGS 2002
12. Outlook
In general, SSP is well suited for fast clear-sky retrieval of narrowband absorbers from nadir satellite instruments like GOME. The accuracy in the retrieval of the surface albedo and the impact of aerosols and multiple scattering limits the accuracy of the retrieved WVC. The latter may be improved by introducing surface albedo from global
5
databases once available and tested. The current implementation of SSP in a direct path and single-scattering radiative transfer scheme provides the possibility for imple-mentation of specific aerosol optical properties. The treatment of clouds for such nadir-viewing measurements in the visible is a yet unsolved problem. SSP provides WVC (and potentially profile) retrieval from instruments like GOME and SCIAMACHY, which
10
were not originally intended for WV retrieval. SSP retrieved WV values may be used to refine other retrievals from such satellite data because WV “contaminates” the entire spectrum. In addition, SSP is, in principle, also suitable for the retrieval of spectrally overlapping narrowband absorptions from different species. This situation occurs in the IR regions around 2 µm covered by the SCIAMACHY instrument. Multi-species
re-15
trieval may be performed by introducing an additional averaged line parameter, which accounts for the degree of overlap between the different absorbers within a specific spectral sampling width.
Acknowledgements. We would like to thank Ilse Aben (SRON) for useful discussions and the reading of the manuscript. We also would like to thank Jochen Landgraf (SRON) for
provid-20
ing DAM model spectra. We like to thank P. F. J. van Velthoven (KNMI) for assistance with ECMWF data. ESA is acknowledged for providing GOME data (ESA 1995–1999) processed by DFD/DLR. This work is part of the research program of the “Stichting voor Fundamenteel Onderzoek der Materie (FOM)”, which is financially supported by the “Nederlandse organisatie voor Wetenschappelijke Onderzoek (NWO)” and is supported by SRON through project grants
25
ACPD
2, 1097–1130, 2002 Retrieval of water vapor columns R. Lang et al. Title Page Abstract Introduction Conclusions References Tables Figures J I J I Back Close Full Screen / EscPrint Version Interactive Discussion
c
EGS 2002
References
Armstrong, B. H.: Spectrum Line Profiles: The Voigt Function, J. Quant. Spect. & Rad. Transfer, 7, 61–88, 1967. 1104
Balzer, W. and Loyola, D.: Product Specification Document of the GOME Data Processor, Tech-nical Document ER-PS-DLR-60-0016, Deutsche Forschungsanstalt f ¨ur Luft- und Raumfahrt,
5
pp. 21, 1996. 1113
Burrows, J. P., Weber, M., Buchwitz, M., Rozanov, V., Ladst ¨atter-Weißenmayer, A., Richter, A., deBeek, R., Hoogen, R., Bramstedt, K., Eichmann, K.-U., and Eisinger, M.: The Global Ozone Monitoring Experiment (GOME): Mission Concept and First Scientific Results, J. At-mos. Sci., 56, 151–175, 1999. 1106
10
Buchwitz, M., Rozanov, V. V., and Burrows, J. P.: A near-infrared optimized DOAS method for the fast global retrieval of atmospheric CH4, CO, CO2, H2O, and N2O total column amounts from SCIAMACHY Envisat-1 nadir radiances, J. Geophys. Res., 105, 15 231–15 245, 2000.
1099
Byrd, R. H., Schnabel, R. B., and Shultz, G. A.: Approximate Solution of the Trust Region
15
Problem by Minimization over Two-Dimensional Subspaces, Mathematical Programming, 40, 247–263, 1988. 1107
Casadio S., Zehner, C., Piscane, G., and Putz, E.: Empirical Retrieval of Atmospheric Air Mass Factor (ERA) for the Measurement of Water Vapor Vertical Content using GOME Data, Geophys. Res. Lett., 27, 1483–1486, 2000. 1100
20
DLR: GOME data Processor Extraction Software User’s Manual, Doc.No.: ER-SUM-DLR-GO-0045, DLR/DFD, Oberpfaffenhofen, Germany, 1999. 1113
ESA: The Global Ozone Monitoring Experiment Users Manual, (Ed) Bednarz, F., ESA Publica-tion SP-1182, ESA PublicaPublica-tion Division, ESTEC, Noordwijk, The Netherlands, 1995. 1098,
1106 25
de Haan, J., Bosma, P., and Hovenier, J.: The adding method for multiple scattering calculations of polarized light, Astron. Astrophys., 181, 371–391, 1987. 1109
Hedin, A. E.: Extension of the MSIS Thermosphere Model into the Middle and Lower Atmo-sphere, J. Geophys. Res., 96, 1159–1172, 1991. 1102
Koelemeijer, R. B. A., Stammes, P., and Stam, D.: Spectral Surface Albedo Derived From
30
GOME Data, Proc. 3rd ERS Symp. on Space at the service of our Enviroment, Florence, Italy, 17–21 March 1997, ESA SP-414, 3 Vols, 1997. 1114
ACPD
2, 1097–1130, 2002 Retrieval of water vapor columns R. Lang et al. Title Page Abstract Introduction Conclusions References Tables Figures J I J I Back Close Full Screen / EscPrint Version Interactive Discussion
c
EGS 2002
Koelemeijer, R. B. A. and Stammes, P.: Validation of GOME cloud cover fraction relevant for accurate ozone column retrieval, J. Geophys. Res., 104, 18 801–18 814, 1999. 1113,1115
Kato, S., Ackerman, T. P., Mather, J. H., and Clothiaux, E. E.: The k-distribution method and correlated-k approximation for shortwave radiative transfer model, J. Quant. Spect. & Rad. Transfer, 62, 109–121, 1999. 1098
5
Lacis, A. A. and Oinas, V.: A description of the correlated k-distribution method for modeling nongray gaseous absorption, thermal emission, and mutlitple scattering in vertically inhomo-geneous atmospheres, J. Geophys. Res., 96, D5, 9027–9063, 1991. 1098
Lang, R., Maurellis, A. N., van der Zande, W. J., Aben, I., Landgraf, J., and Ubachs, W.: Forward Modeling and Retrieval of Water Vapor from GOME: Treatment of Narrow Band Absorption
10
Spectra, J. Geophys. Res., in press, 2002. 1098,1099,1102,1103,1104,1105,1112
Learner, R., Schermaul, R., Tennyson, J., Zobov, N., Ballard, J., Newnham, D., and Wickett, M.: Measurement of H2O Absorption Cross-Sections for the Exploitation of GOME data, ESTEC Contract No 13312/9/NL/SF, Final Presentation, 2000. 1114
Maurellis, A. N., Lang, R., van der Zande, W. J., Ubachs, U., and Aben, I.: Precipitable Water
15
Column Retrieval from GOME Data, Geophys. Res. Lett., 27, 903–906, 2000a. 1098,1100
Maurellis, A. N., Lang, R., and van der Zande, W. J.: A New DOAS Parameterization for Re-trievalof Trace Gases with Highly-Structure Absorption Spectra, Geophys. Res. Lett., 27, 4069–4072, 2000b. 1099,1101,1105
No ¨el, S., Buchwitz, M., Bovensmann, H., Hoogen, R., and Burrows, J. P.: Atmospheric Water
20
Vapor Amounts Retrieved from GOME Satellite Data, Geophys. Res. Lett., 26, 1841–1844, 1999. 1099
Rothman, L. S., Rinsland, C. P., Goldman, A., Massie, S. T., Edwards, D. P., Flaud, J.-M., Perrin, A., Camy-Peyret, C., Dana, V., Mandin, J.-Y., Schroeder, J., McCann, A., Gamache, R. R., Wattson, R. B., Yoshino, K., Chance, K. V., Jucks, K. W., Brown, L. R., Nemtchino,
25
V., and Varanasi, P.: The HITRAN Molecular Spectroscopic Database and HAWKS (HITRAN Atmospheric Workstation): 1996 Edition, J. Quant. Spect. Rad. Transfer, 60, 665–710, 1998.
1105
Shettle, E. P. and Fenn, R. W.: Models for aerosols of the lower atmosphere and the effects of the humidity variations on their optical properties, Air Force Geophys. Lab. (OP), Envir. Res.
30
Pap. 676, AFGL-TR-79-0214, Hanscom, Massachusetts (technical report), 1979.
ACPD
2, 1097–1130, 2002 Retrieval of water vapor columns R. Lang et al. Title Page Abstract Introduction Conclusions References Tables Figures J I J I Back Close Full Screen / EscPrint Version Interactive Discussion
c
EGS 2002
Table 1. Relative contribution of ground-reflected, singly-scattered and multiply-scattered pho-tons to the total reflectivity calculated by the DAM model assuming a SZA of 40◦and a WVC of 7.72×10²²[molec/cm2] for each case
Model Input Model Output SSP Retrieval Results
AODa Λ GRb SSc MSd WVCe ∆ WVC [%] Λ ∆Λ [%] Maritime Clear Sky 0 0.03 42.2 49.6 8.2 7.68 -0.33 0.036 +20.0 Maritime Aerosol 0.30 0.03 17.9 46.9 35.2 6.76 -12.3 0.052 +73.3 Rural Clear Sky 0 0.10 67.8 23.9 8.3 7.69 -0.26 0.110 +10.0 Rural Aerosol 0.63 0.10 13.0 25.1 61.9 9.14 +18.6 0.121 +21.0
a
Aerosol Optical Depth
b
Percentage of ground reflected light at 592 nm
c
Percentage of single scattering at 592 nm
d
Percentage of multiple scattering at 592 nm
e
ACPD
2, 1097–1130, 2002 Retrieval of water vapor columns R. Lang et al. Title Page Abstract Introduction Conclusions References Tables Figures J I J I Back Close Full Screen / EscPrint Version Interactive Discussion
c
EGS 2002
Table 2. Same as Table1but for a high WVC of 1.43×10²³molec/cm2. The relative difference ∆ WVC is calculated between the model value and the corrected retrieved WVC
Model Input Model Output SSP Retrieval Results
AODa Λ GRb SSc MSd WVC corr. WVCe ∆ WVC [%] Λ ∆Λ [%] Maritime Clear Sky 0 0.03 43.8 48.2 8.0 12.5 13.5 −5.2 0.039 +30.0 Maritime Aerosol 0.21 0.03 20.0 53.2 26.8 14.0 15.5 +8.5 0.038 +26.6 Rural Clear Sky 0 0.10 69.1 22.8 8.1 13.3 14.5 +1.6 0.102 +2.0 Rural Aerosol 0.51 0.10 17.9 30.9 51.2 14.6 16.3 +14.1 0.112 +12.0
a
Aerosol Optical Depth
b
Percentage of ground reflected light at 592 nm
c
Percentage of single scattering at 592 nm
d
Percentage of multiple scattering at 592 nm
e
ACPD
2, 1097–1130, 2002 Retrieval of water vapor columns R. Lang et al. Title Page Abstract Introduction Conclusions References Tables Figures J I J I Back Close Full Screen / EscPrint Version Interactive Discussion c EGS 2002 cross-section
S
δ
λ
0
δ
λ
w
δ
λ
Fig. 1. Schematic of the construction of an effective pixel coverage parameter w and effective mean value for the absorption cross-section S (right hand panel) from a typical absorption spectrum which has been sampled over a wavelength range δλ (left hand panel).
ACPD
2, 1097–1130, 2002 Retrieval of water vapor columns R. Lang et al. Title Page Abstract Introduction Conclusions References Tables Figures J I J I Back Close Full Screen / EscPrint Version Interactive Discussion c EGS 2002 0.1 0.2 0.3 0.4 0.5 0.6 0.7 0.8 0.1 0.2 0.3 0.4 0.5 0.6 0.7 0.8 0.9 1 150 200 250 300 350 Temperature [K] w parameter [ ∆ λ −1 ] (a) −24.6 −24.4 −24.2 −24 −23.8 −23.6 0.1 0.2 0.3 0.4 0.5 0.6 0.7 0.8 0.9 1 150 200 250 300 350 Pressure [atm] Temperature [K] S parameter log 10 [cm 2 ] (b)
Fig. 2. Contour plot of the w- (a) and the S-parameter (b) look-up-table for one spectral sam-pling bin j in dependence of temperature and pressure. A standard pressure and temperature grid is used for the construction of the look up tables, covering all possible pressure and tem-perature ranges within the altitude region of interest.
ACPD
2, 1097–1130, 2002 Retrieval of water vapor columns R. Lang et al. Title Page Abstract Introduction Conclusions References Tables Figures J I J I Back Close Full Screen / EscPrint Version Interactive Discussion c EGS 2002 585 590 595 600 0.06 0.065 0.07 Reflectivity (a) GOME SSP 585 590 595 600 −1 0 1 Wavelength [nm] [%] 585 590 595 600 0.35 0.355 0.36 0.365 0.37 Reflectivity (b) GOME SSP 585 590 595 600 −1 0 1 Wavelength [nm] [%]
Fig. 3. The left panels (a) show a GOME measurement (solid line) at 34◦N latitude and 110◦W longitude over the pacific with a SZA of 23◦ together with the result of a SSP forward model (dashed line) and their residual (GOME-SSP)/GOME). The albedo was adjusted using a first order polynomial, resulting in a value of 0.04 at 590 nm. The WV density profile was taken from ECMWF with a high WVC of 1.34 × 10²³[molec/cm2]. The right panels(b) show the same but than for a rural GOME measurement at 62◦N latitude and 100◦W longitude with a high SZA of 73◦and a low WVC of 8.9 × 10²¹. For this pixel the albedo was adjusted resulting in a value of 0.32 at 590 nm.
ACPD
2, 1097–1130, 2002 Retrieval of water vapor columns R. Lang et al. Title Page Abstract Introduction Conclusions References Tables Figures J I J I Back Close Full Screen / EscPrint Version Interactive Discussion c EGS 2002 585 590 595 600 0 0.005 0.01 0.015 0.02 0.025 0.03 0.035 0.04 Wavelength [nm] Optical thickness Bottom layer Top layer
Fig. 4. Spectral averaged optical thickness for the bottom and top atmospheric layer used in the retrieval with subcolumn densities of 1.8×10²²and 1.3×10²¹molec/cm2, respectively. Here, we selected a high total WVC of 1.83×10²³molec/cm2.
ACPD
2, 1097–1130, 2002 Retrieval of water vapor columns R. Lang et al. Title Page Abstract Introduction Conclusions References Tables Figures J I J I Back Close Full Screen / EscPrint Version Interactive Discussion c EGS 2002 0 2 4 6 8 10 12 14 16 18 20 −20 −10 0 10 20 Rel. residual [%]
SSP retrieved WVC from lbl forward−modeled spectra a) 0 2 4 6 8 10 12 14 16 18 20 −4 −3 −2 −1 0 1 Residual 10 22 [molec/cm 2 ] WVC 1022 [molec/cm2] b)
Fig. 5. Relative (a) and absolute (b) differences between the retrieved WVC by SSP and the WVC utilized in the lbl forward model. The solid line in the lower panel (b) shows a second order polynomial fit through the absolute difference values. The polynomial is used to adjust for the systematic method related bias of the SSP retrieval. The upper panel (a) also shows the accuracy of the method (dotted line) for low and mid-range WVC up to 1×10²³molec/cm2.
ACPD
2, 1097–1130, 2002 Retrieval of water vapor columns R. Lang et al. Title Page Abstract Introduction Conclusions References Tables Figures J I J I Back Close Full Screen / EscPrint Version Interactive Discussion c EGS 2002 0 5 10 15 20 WVC × 10 22 [molec/cm 2 ] (a) SSP OACS ECMWF corr. SSP −800 −60 −40 −20 0 20 40 60 80 50 100 o [%] (b)
Fig. 6. SSP uncorrected WVC fit results over latitude ((a), filled circles) for a GOME pass on 23 October 1998, covering longitudes from 90◦W at 73◦N latitude to 150◦W at 80◦S latitude. For validation, the WVC values from OACS using GOME measurements (red curve) and from ECMWF given at 18:00 UTC are shown (green curve). The open circels denote SSP corrected values for WVC higher than 1×10²³molec/cm2. The cloud coverage in percentage per GOME observation is taken from GOME GDP level-2 data and is indicated by the solid curve in the lower panel(b).
ACPD
2, 1097–1130, 2002 Retrieval of water vapor columns R. Lang et al. Title Page Abstract Introduction Conclusions References Tables Figures J I J I Back Close Full Screen / EscPrint Version Interactive Discussion c EGS 2002 −80 −60 −40 −20 0 20 40 60 80 −100 −50 0 50 100 Latitude [o]
Rel. differences OACS vs. SSP [%]
WVC
Λ
Fig. 7. Relative differences between SSP and OACS for retrieved values of WVC ([OACS-SSP]/OACS; solid line) and surface albedoΛ ([SSP-OACS]/OACS; dotted line). An underes-timation of the surface albedo leads to an overesunderes-timation in the retrieved WVC. The relative differences result form the same GOME track as shown in Fig.6including all ground pixel.
ACPD
2, 1097–1130, 2002 Retrieval of water vapor columns R. Lang et al. Title Page Abstract Introduction Conclusions References Tables Figures J I J I Back Close Full Screen / EscPrint Version Interactive Discussion
c
EGS 2002
Fig. 8. Global total water vapor column plots for all retrieved GOME ground pixel using SSP (a). The measurements were performed from 22–24 October 1998. The right panel (b) shows global WVC as given by ECMWF at 23 October, 1998, 18:00 UTC. The lower panel(c) shows SSP columns for GOME observations where the cloud fraction reported by GOME level-2 data is lower than 10%. Data gaps for GOME retrievals are due to calibration periods or data pro-cessing failures. At 24 October from 14:00 UTC GOME was in Narrow Swath Mode until 11:00 UTC the next day. For these tracks the data was interpolated to the standard swath width.
ACPD
2, 1097–1130, 2002 Retrieval of water vapor columns R. Lang et al. Title Page Abstract Introduction Conclusions References Tables Figures J I J I Back Close Full Screen / EscPrint Version Interactive Discussion c EGS 2002 0 2 4 6 8 10 12 14 16 18 20 0 2 4 6 8 10 12 14 16 18 20 SSP WVC 1022 [molec/cm2] ECMWF WVC 10 22 [molec/cm 2 ]
Fig. 9. Scatter plot between ECMWF total WVC and SSP retrievals for GOME measurements with a GDP level-2 data reported cloud fraction lower than 10%. The GOME measurements are performed between 70◦S and 70◦N in latitude: on 30 September 1999 from 0:09 to 1:05 UTC between 120◦E and 180◦E longitude and on 23 October 1998 from 17:52 to 18:32 UTC between 90◦W and 150◦W longitude. Co-located ECMWF data is given for 00:00 UTC and 18:00 UTC, respectively. The solid line denotes the best fit of a linear polynomial to the retrieved columns.


![Fig. 7. Relative di ff erences between SSP and OACS for retrieved values of WVC ([OACS- ([OACS-SSP]/OACS; solid line) and surface albedo Λ ([SSP-OACS]/OACS; dotted line)](https://thumb-eu.123doks.com/thumbv2/123doknet/14702339.565196/33.918.710.896.87.617/relative-erences-oacs-retrieved-values-surface-albedo-dotted.webp)

