HAL Id: hal-02492213
https://hal.archives-ouvertes.fr/hal-02492213
Submitted on 23 Nov 2020HAL is a multi-disciplinary open access
archive for the deposit and dissemination of sci-entific research documents, whether they are pub-lished or not. The documents may come from teaching and research institutions in France or abroad, or from public or private research centers.
L’archive ouverte pluridisciplinaire HAL, est destinée au dépôt et à la diffusion de documents scientifiques de niveau recherche, publiés ou non, émanant des établissements d’enseignement et de recherche français ou étrangers, des laboratoires publics ou privés.
Distributed under a Creative Commons Attribution - NoDerivatives| 4.0 International License
Subcellular Chemical Imaging: New Avenues in Cell
Biology.
Johan Decelle, Giulia Veronesi, Benoit Gallet, Hryhoriy Stryhanyuk, Pietro
Benettoni, Matthias Schmidt, Rémi Tucoulou, Melissa Passarelli, Sylvain
Bohic, Peta Clode, et al.
To cite this version:
Johan Decelle, Giulia Veronesi, Benoit Gallet, Hryhoriy Stryhanyuk, Pietro Benettoni, et al.. Subcel-lular Chemical Imaging: New Avenues in Cell Biology.. Trends in Cell Biology, Elsevier, 2020, 30 (3), pp.173-188. �10.1016/j.tcb.2019.12.007�. �hal-02492213�
1
Subcellular chemical imaging: new avenues in cell biology
1
Johan Decelle1*, Giulia Veronesi2,3, Benoit Gallet4, Hryhoriy Stryhanyuk5, Pietro Benettoni5, Matthias 2
Schmidt5, Rémi Tucoulou3, Melissa Passarelli6, Sylvain Bohic3,7, Peta Clode8,9, Niculina Musat5 3
Affiliations:
4
1- Cell and Plant Physiology Laboratory, University Grenoble Alpes, CNRS, CEA, INRA, IRIG, Grenoble, France.
5
2- Chemistry and Biology of Metals Laboratory, Université Grenoble Alpes, CNRS, CEA, IRIG, Grenoble, France.
6
3- ESRF - The European Synchrotron, Grenoble, France.
7
4- Institut de Biologie Structurale, Université Grenoble Alpes, CNRS, CEA; Grenoble, France.
8
5- Helmholtz Centre for Environmental Research – UFZ, Department of Isotope Biogeochemistry, Leipzig, Germany.
9
6- Ecole Polytechnique Fédérale de Lausanne (EPFL), Laboratory for Biological Geochemistry, Lausanne, Switzerland.
10
7- INSERM – UA7 – Synchrotron Radiation for Biomedicine, STROBE, University Grenoble Alpes, Grenoble, France.
11
8- The Centre for Microscopy Characterisation and Analysis, The University of Western Australia, Crawley, Australia.
12
9- UWA School of Biological Sciences, The University of Western Australia, Crawley, Australia.
13 14
Keywords
: chemical imaging, correlative microscopy, electron microscopy, elemental imaging,
15X-ray fluorescence, SIMS 16 *Correspondence: johan.decelle@univ-grenoble-alpes.fr 17 18
Abstract
19To better understand the physiology and acclimation capability of a cell, one of the great challenges 20
of the future is to access the interior of a cell and unveil its chemical landscape (composition and 21
distribution of elements and molecules). Chemical imaging has greatly improved in sensitivity and 22
spatial resolution to visualize and quantify nutrients, metabolites, toxic elements, and drugs in 23
single cells at the subcellular level. This review aims at presenting the current potential of these 24
emerging imaging technologies and guiding biologists towards a strategy for interrogating 25
biological processes at the nanoscale. We also describe different solutions to combine multiple 26
imaging techniques in a correlative way and provide perspectives and future directions for 27
integrative subcellular imaging across different disciplines. 28
2
New avenues for the subcellular exploration of the cell
30The advent of electron microscopy in the mid 1900s was a formidable tool for the detailed 31
exploration of a cell´s structure at nanoscale resolution. Nowadays, a key challenge in cell biology 32
is to understand the activity and function of organelles and cellular compartments, and their role 33
in the metabolism and physiology of a cell. Omics bulk analyses (e.g. transcriptomics, 34
metabolomics) have greatly improved our understanding on cellular mechanisms, but only provide 35
averaged information of extracted molecules from numerous lysed cells. Hence, spatial 36
information at the subcellular level is a missing dimension to fully interpret the phenotypic state 37
of a cell and assess heterogeneity in a population. Chemical imaging techniques (see Glossary) 38
are now able to reveal the chemical landscape of cells (i.e. the composition and distribution of 39
elements and molecules) at the subcellular level without the need to add or genetically encode 40
fluorescent labels. Probing the elemental and molecular composition in organelles and subcellular 41
structures can reveal fundamental information about the function and physiology of a cell in 42
response to different conditions. The subcellular distribution of some elements (e.g. the 43
macronutrients N, P, S), which are essential building blocks of biomolecules (e.g. DNA, proteins, 44
lipids), can reflect the metabolic roles and needs of organelles [1]. Trace metals (e.g. Fe, Cu, Zn) 45
play a fundamental role in different biochemical functions of the cell, and their homeostasis and 46
compartmentalization need to be tightly controlled to avoid cell death and severe pathologies. 47
More particularly, metals are key players in parasitic and viral infections, cancer cells, and 48
neurodegenerative diseases [2]. In the biomedical field, the increasing human exposure to 49
exogenous compounds (e.g. metal-based nanoparticles, toxic elements) and use of therapeutic 50
drugs, call for imaging techniques to visualize their fate in tissues and cells, and assess their 51
toxicity and impact on the homeostasis of native elements [3,4]. In addition to elements, the 52
localization of metabolites (e.g. sugars, lipids) in cells is also essential to fully understand 53
metabolic processes. Therefore, subcellular mapping of elements and metabolites is becoming 54
indispensable to investigate the physiology and metabolism of healthy and diseased cell types, 55
understand cellular interactions in tissues or with beneficial cells (e.g. symbioses) and pathogens 56
(e.g. viral or bacterial infection), and their adaptive response to abiotic stresses. 57
Recent technological progress in chemical imaging has substantially improved sensitivity and 58
spatial resolution, allowing disentangling of cellular compartments in a single cell. However, the 59
multiplicity of these complex imaging techniques requires guidance for non-specialists. An 60
3
overview of the chemical imaging techniques currently available is therefore needed to help 61
biologists integrating the subcellular scale in their studies while being aware of their potential and 62
limitations. Each chemical imaging platform presents experimental specifications that make them 63
more sensitive to some elements or molecules, so different platforms need to be combined to have 64
a comprehensive view of the chemical landscape of a cell. Moreover, since chemical imaging 65
generally provides limited information on the cell ultrastructure, electron microscopy (EM) is often 66
required to interpret the intracellular localization of elements and molecules. Correlation between 67
light microscopy and EM (CLEM) is well established [5,6], but correlation between EM and 68
chemical imaging is less developed. Bridging the data acquired with different high-resolution 69
imaging strategies is the next challenge and will make correlative subcellular imaging a new 70
powerful research tool towards integrative cell biology. 71
This review aims at presenting the potential and limitations of state-of-the-art chemical imaging 72
techniques for non-specialists who seek to obtain chemical information at the subcellular level. 73
We aim to guide biologists to the appropriate imaging technique and associated sample preparation 74
to visualize and quantify elements or biomolecules in cells. We also summarize the new 75
developments for correlative subcellular imaging (Figure 1, Key Figure), highlight the role of such 76
combinatory techniques to disentangle biochemical processes of a cell and discuss future 77
challenges and directions in the field. 78
79
Potential and limitations of subcellular chemical imaging platforms and
80required sample preparation
81Multiple chemical imaging instruments are capable of visualizing the molecular, elemental, and 82
isotopic composition of a cell with high lateral resolution [7]. These microscopes are generally 83
equipped with a high-energy, and focused primary beam of electrons, protons, photons, or ions 84
that raster across the surface of the sample and obtain quantitative information in a spatially 85
resolved manner (Box 1). The instrument and experimental setup need to be carefully chosen 86
according to the research question and the target elements or molecules of interest. Here we focus 87
on the key methodologies that are routinely being used to provide subcellular information. Lower 88
resolution technologies (e.g. MALDI, LA-ICP-MS) will not be discussed in detail here (see review 89
[8]). 90
4
X-ray fluorescence microscopy relies on the excitation of core electrons of atoms that leads to
91
X-ray emissions, which are specific to elements in the sample (see Glossary and Box 1). The 92
primary probe determines the technique: electrons in Energy Dispersive X-ray Spectrometry 93
(S/TEM-EDS); protons in particle-induced X-ray emission (PIXE), synchrotron-generated 94
photons in synchrotron X-Ray Fluorescence (S-XRF) imaging. These analytical techniques can be 95
used to visualize and quantify the distribution of macronutrients (e.g. P, S), key trace elements 96
(e.g. Mn, Fe, Cu, Zn, Se), toxic heavy metals (e.g. Hg, Pb), and pharmacological compounds (e.g. 97
organometallic compounds based on Pt, Ir, Os, Ru). S/TEM-EDS can provide the highest spatial 98
resolution (sub-nanometre in TEM) with sensitivity of ~1000 ppm (1 mg.g-1) [9]. Compared to 99
this, PIXE is less spatially resolved (sub-micron) but is more sensitive (ppm range) [7]. But overall, 100
synchrotron X-ray Fluorescence (S-XRF) provides arguably the best combination of high spatial 101
resolution capabilities (down to few 10 nm) and high sensitivity (sub-ppm) to light and heavy 102
elements (Figure 2, Box 1) [10,11]. S-XRF has allowed mapping and quantification of metals, 103
such as Fe, Zn, Cu in microalgal and human cells [12–14], as well as silica, drugs, organometallic 104
molecules, and titanium oxide nanoparticles in cancer cells [2,15–19]. In combination with XRF 105
imaging, X-ray Absorption Spectroscopy (XAS) can be performed in order to reveal the chemical 106
speciation of a target element. XAS has disclosed the chemical transformations of indium-based 107
nanocrystals, or of osmium-based anticancer drugs in cancer cells [20,21]. The modulations of the 108
XAS spectra also allowed mapping the distribution of different chemical states of S (e.g. sulfate 109
esters and inorganic sulfate) in a biological tissue, in order to understand their role in cell 110
differentiation [22]. 111
Secondary ion mass spectrometry (SIMS) instruments are based on the analysis of mass of
112
elements and molecules (see Glossary). Secondary ions are sputtered away from the topmost layer 113
of a sample by a focused primary ion beam and analyzed in a mass spectrometer (Box 1). 114
NanoSIMS is a SIMS instrument particularly suitable for probing macronutrients and metals in
115
cells at a lateral resolution down to 50 nm (Figure 2) [23–26]. For instance, P, S, Ca, Fe, Zn, Mn, 116
and Cu have been mapped in cells [12,25,27,28]. Morphological features of the cell can be revealed 117
by secondary electron signal (only in negative extraction mode), and from different secondary 118
ions, such as cyanide (12C14N-) and phosphorous (31P-) showing the overall shape and internal 119
compartments of the cell, and the nucleus, respectively. The high mass-resolving power of 120
nanoSIMS can also unveil the isotopic composition of a cell (i.e. being able to distinguish between 121
5
12C15N and 13C14N), and so is highly suitable for stable isotope probing (SIP) [29,30].
SIP-122
nanoSIMS allows for quantitation of metabolic activities at the subcellular level (e.g. 50 - 100 nm), 123
such as C and N assimilation [31–34]. This technique has been used to understand nutrient 124
exchange between cells in symbiotic, pathogenic and virus-host interactions [35–40] and the 125
localization of drug compounds in human cells [41] (Figure 2). 126
With the ToF-SIMS (Time-of-Flight-SIMS; see Glossary and Box 1), molecular information can 127
be obtained since the ion probe (polyatomic or gas cluster) is less destructive than in nanoSIMS 128
(monoatomic). The softer ionization conditions, as compared to nanoSIMS, allow for spatially 129
resolved analysis of large molecular fragment species within the range of 1 to ~1000 Da with a 130
typical lateral resolution of 100 nm – 5 µm. Different analysis modes exist: spectrometry mode to 131
get high mass resolution, imaging mode to get high lateral resolution, and delayed extraction mode 132
to combine high mass resolution (10000 MRP) with a high lateral resolution (400 nm) [42]. 133
Delayed extraction is now widely used to image organic samples and lately was shown to achieve 134
a 108 nm lateral resolution to visualize single particle in algal biofilms [43,44]. ToF‐SIMS is a 135
useful method for studying small molecules [45–47] and lipids in cells, especially in lipid-related 136
diseases, such as cancer, Duchenne muscular dystrophy and atherosclerosis (Figure 2) [48,49]. 137
138
Box 1. Principles of subcellular chemical imaging techniques
6
* X-ray fluorescence (XRF) relies on the photoelectric effect occurring when an X-ray photon is
absorbed by an atom: a photo-electron is ejected from a core orbital of the excited atom leaving a vacancy which is then filled by another electron from a higher orbital. This is followed by the emission of a fluorescence X-ray photon whose energy is characteristic of the element. XRF acquisition is often performed by scanning the sample and energy dispersive detectors collect and measure the emitted fluorescence spectrum in each pixel, unveiling the elemental composition. The beam size determines the spatial resolution, from 10 nm up to 1µm. For a thin sample, the intensity of the fluorescence is proportional to the concentration of the elements, which can be calculated using thin standards of known concentration.
* SIMS (Secondary Ion Mass Spectrometry): Upon impact of a focused ion beam, sample material is
sputtered and about 1% of ejected material is ionized. In nanoSIMS, these ions are extracted in negative or positive modes into a mass spectrometer and separated according to their mass-to-charge ratio (m/z) in the magnetic sector of the mass analyzer. Simultaneous detection of up to 7 secondary ion species (monoatomic ions or small molecular fragments of up to 4-6 atoms) can be achieved. The ion beam can
7
scan a predefined surface area of the cell, therefore providing color-coded cartography of ion counts per pixel. Note that the charge compensation (i.e., compensating the build-up charge on non-conductive surfaces) is available only in negative extraction mode. Therefore, coating the sample surface with a conductive metal (~10 nm) is mandatory to overcome this limitation in positive extraction mode.
In ToF-SIMS (Time-of-Flight Secondary Ion Mass Spectrometry), the ejection and ionization of
material relies on a lower ion beam fluence and less destructive cluster ion sources compared to nanoSIMS. With new cluster ion sources (Bin, Arn, Aun, C60), ToF-SIMS provides the possibility of minimizing molecular damages while maximizing molecular ion yields. Small organic molecules within range of 1 to ~1000 Da can be detected with a lateral resolution of around a micron on biological material. The pulsed operation mode of the primary ion gun and its 45° mounting geometry allows for charge compensation in both extraction polarities while employing the same primary ion species. Yet, the 45° geometry can cause shadowing and lateral displacement effect upon depth profiling or when analyzing a surface with a pronounced topography.
139
Seeing is believing, but what we see critically depends on the sample preparation. Sample
140
preparation is one of the most fundamental steps – and should aim to preserve cells as close as 141
possible to their native state - the Holy Grail in cell biology. The ideal method is the one that fixes 142
and conserves both the ultrastructure of the cell and its native chemical composition (Box 2). 143
However, sample preparation is highly specific to both the sample and instrument(s) being used, 144
and compromises have to be made at each experiment (Table 1). 145
146
Box 2. Sample preparation for subcellular imaging
8
The sample preparation workflow depends on the sample, imaging platform, and targeted compound (e.g. molecule, element, isotope). Because of the high vacuum conditions in most EM and chemical imaging instruments, live cells cannot be directly analyzed but generally need to be fixed, dehydrated, and sectioned/milled to access subcellular structures (Table 1). For fixation, the use of aldehydes at room temperature can alter the ultrastructure and chemistry of the cell since diffusible mobile ions and small molecules (e.g. free amino acids, lipids) can be redistributed and/or washed out from the cell. Therefore, rapid freezing methods (high-pressure freezing and plunge freezing) are superior in preserving native-state cell structure and chemistry at a fast rate (scale of milliseconds compared to minutes with chemical fixation). Then, freeze substitution is a dehydration step where ice of the vitreous cell is slowly replaced by an organic solvent at very low temperature (from - 90°C to -30°C) with retention of elements and metabolites possible, provided the substitution protocol is carefully chosen [13,50]. Chemical fixatives, such as osmium , tannic acid, aldehydes, can be used during this step to stabilize cellular structures [51]. A resin-embedding step is then necessary in order to obtain thin sections and access the cell´s interior. Cryo-dehydration can also be performed by freeze-drying, but this method can cause ultrastructure modification and elemental redistribution. However, freeze-drying is particularly powerful for drying ultrathin frozen-hydrated sections for room temperature analysis. After sample preparation, chemical
9
preservation of the cell can be assessed by visualizing the most diffusible elements (K+, Na+, Ca2+, Cl-) that move rapidly across membranes and within the cytoplasm, thus representing a relevant rule-of-thumb criterion for chemical preservation [52]. Overall, it remains difficult to be certain that the chemical environment within a cell is a true representation of normal physiology, and each step of the preparation can be debatable. We recommend more methodological development and comparisons in the future to optimize sample preparation and assess putative artefacts. This is a challenge since access to cutting-edge microscopes is generally difficult forthat methodological purpose. Compared to freeze-substituted and resin-embedded cells, analyzing frozen-hydrated cells (or vitreous cells) is obviously superior for chemical preservation (Table 1). However, this leads to many challenges that need to be tackled in the future (further discussed in this review): i) cryo-sectioning, ii) the need for a cryo-transfer system and a cryo-stage in the imaging platform, iii) difficulty to undertake correlative studies across different platforms; iv) inherent lack of contrast for sample visualization.
147 148 149
Sample preparation steps
Strategy Pros Cons
Fixation of cell
Chemical fixation Easy to use in the field or for pathogenes (human parasites)
Ultrastructure and chemical composition can be greatly
modified Cryo-fixation under high
pressure
Excellent preservation of the ultrastructure and chemistry of
the cell
Thickness of the sample must be less than 200 µm, requires bulky
laboratory-based equipment Cryo-fixation with plunge
freezing in a liquid cryogen
Can be done in the field or the laboratory
Maximum sample thickness to maintain vitreous ice formation is ~5µm, some ice
crystal formation in thicker samples
Dehydration
Chemical dehydration at room temperature
Can be done in the field or the laboratory
Structural and chemical preservation are not
guaranteed
Freeze-drying
No use of chemicals or solvents, ideal for drying ultrathin frozen
hydrated sections for room temperature analysis
Likelihood of movement of target ions (particularly
diffusible elements) or metabolites, especially in highly vacuolated tissues Freeze-substitution
Dehydration at very low temperature allows for good
structural and chemical preservation
Use of solvents can extract materials of interest; long process (days – weeks)
Use of chemical fixative during the freeze substitution
Osmium
Membranes are fixed, and osmium provides contrast for EM
investigation and structural information in XRF
Highly toxic, Interfere with some molecules and elements for XRF and
ToF-SIMS analysis.
Aldehydes Proteins are fixed, maintaining structural preservation
Toxic, no contrast for EM investigation, cannot be
prepared as anhydrous (therefore loss of any
10
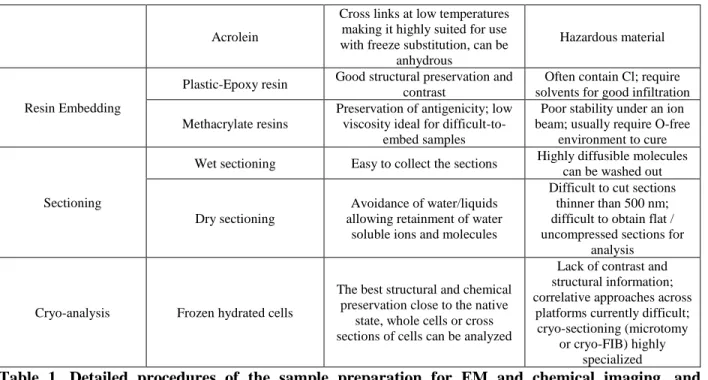
Acrolein
Cross links at low temperatures making it highly suited for use with freeze substitution, can be
anhydrous
Hazardous material
Resin Embedding
Plastic-Epoxy resin Good structural preservation and contrast
Often contain Cl; require solvents for good infiltration Methacrylate resins
Preservation of antigenicity; low viscosity ideal for
difficult-to-embed samples
Poor stability under an ion beam; usually require O-free
environment to cure
Sectioning
Wet sectioning Easy to collect the sections Highly diffusible molecules can be washed out
Dry sectioning
Avoidance of water/liquids allowing retainment of water
soluble ions and molecules
Difficult to cut sections thinner than 500 nm; difficult to obtain flat / uncompressed sections for
analysis
Cryo-analysis Frozen hydrated cells
The best structural and chemical preservation close to the native
state, whole cells or cross sections of cells can be analyzed
Lack of contrast and structural information; correlative approaches across
platforms currently difficult; cryo-sectioning (microtomy
or cryo-FIB) highly specialized
Table 1. Detailed procedures of the sample preparation for EM and chemical imaging, and
150
considerations (Pros and cons) for each step.
151 152
Correlated subcellular imaging towards integrative cell biology
153Correlation between morphology and chemical imaging. Since chemical imaging provides
154
little morphological information, combination with light/electron microscopy is required in order 155
to unambiguously elucidate the localization of elements and molecules within a cell. Yet, the 156
challenge is the trade-off between ultrastructure and chemistry preservation of the cell during the 157
sample preparation, and the ability to transfer and analyze the same cells on different imaging 158
platforms. Some imaging techniques, such as SIMS, are destructive, meaning that morphological 159
imaging must generally take place before. Here we propose different strategies that can be adopted 160
to analyze the same cellular region of interest with multimodal imaging (Figure 1). 161
Organelles can be labeled and observed with fluorescence microscopy before the entire cell is 162
subjected to chemical imaging. For instance, the accumulation of Mn in the Golgi apparatus of 163
dopaminergic cells was revealed using green fluorescent proteins targeting the organelle followed 164
by S-XRF imaging in cryogenic conditions [53–55]. More recently, correlation between super-165
resolution stimulated emission depletion microscopy of proteins and S-XRF imaging of trace 166
metals were performed with 40 nm spatial resolution on neurons [56]. 167
To obtain high-resolution cellular context, it is also possible to analyze cell sections in S/TEM 168
followed by S-XRF, providing an unambiguous spatial origin of elements in subcellular 169
11
compartments (Figures 3 and 4) [57]. Osmium tetroxide (OsO4) can be used to fix and stain cellular
170
compartments (Table 1), providing morphological contrast not only in EM, but also in S-XRF, 171
where Os fluorescence reveals the ultrastructure of the cell (Figures 2 and 3; [12]. The drawback 172
is that the XRF emission lines of Os interfere with those of phosphorous and some trace metals 173
(e.g. Cu and Zn), increasing their detection limit. In order to obtain structural and 174
elemental/isotopic information from a single cellular region, it is possible to perform TEM 175
followed by NanoSIMS (Figure 3). Usually it would require the use of a specific TEM grid with 176
coordinates or fiducial markers to find the same regions of interest in both instruments (Figures 3 177
and 4) [35,37,58,59]. With the recent advent of sensitive backscatter detectors in the modern SEM 178
it is also possible to acquire structural information from sections using SEM before nanoSIMS and 179
S-XRF analyses, on the same sample or on consecutive sections [12,41,60]. 180
181
Correlation between fluorescence and nanoSIMS using element labeling. The coupling
182
between fluorescence microscopy and nanoSIMS can be a powerful approach to unveil the 183
functional identity of a cell and organelles. This relies on targeted probing of DNA, RNA and 184
proteins by coupling fluorescent dyes to elements usually absent from cell’s natural composition, 185
such as halogens (fluorine, bromine), gold, and boron. A specific exogenous element (detectable 186
by nanoSIMS) can be associated/linked to fluorescent dyes, antibodies, or nanobodies, allowing 187
correlative microscopy between fluorescence in situ hybridization (FISH), immunocytochemistry 188
or click chemistry approaches with nanoSIMS [23,61,62]. For example, the nucleotide analogue, 189
bromo-deoxyurine (BrdU), which is incorporated into replicating DNA during cell division, can 190
be detected by fluorescence immunohistochemistry but also as bromine ions (e.g., 79Br, 81Br) by 191
nanoSIMS in the same cells [63]. Fluorine (19F) labelling of proteins using 19F-azide probe [64] or 192
by conjugation to nanobodies (e.g. GFP-like proteins and antibodies) can enable correlated 193
fluorescence and nanoSIMS imaging [65] (Figure 2). Similarly, 197Au can be conjugated to an 194
antibody to recognize cellular actin and synaptophysin proteins by coupled immunofluorescence 195
and nanoSIMS [66], while antibodies tagged with isotopically-pure elemental metal reporters (i.e. 196
lanthanides) have been utilized to image protein expression in human breast tumor tissue sections 197
[67]. Recently, boron linked to proteins or to nanobodies binding to proteins have been used for 198
simultaneous protein identification and elemental mapping by correlative fluorescence microscopy 199
and nanoSIMS [68]. These studies suggest that exogenous elements with a small mass and size are 200
12
suitable for probing DNA and proteins in the complex cellular environment and can be used in 201
correlated nanoSIMS studies. 202
203
Correlation between more than two subcellular imaging platforms. The combination of
204
multiple subcellular imaging platforms can provide a comprehensive view of the ultrastructure, 205
concentration and distribution of elements (macronutrients and metals) and isotopic ratios, and 206
molecules from a single region of interest in the cell (Figure 3). This can be performed by analyzing 207
different consecutive resin sections from the same cell on different platforms [12,13,57]. This 208
flexible strategy allows one to choose the required thickness and support (e.g. wafer, grid, Si 209
window) for each section, and detailed ultrastructure can be obtained with EM. Thus, the 210
morphological and different chemical features can be superimposed. Yet, collecting serial sections 211
of different thicknesses to target the same cellular region or organelle is a challenge. 212
213
Integrated correlative instruments. A correlative approach can be facilitated when
214
morphological and chemical information from exactly the same area can be acquired in the same 215
instrument. One of the best examples is TEM-EDS and EFTEM. The TEM offers the highest 216
possible resolution for both imaging and element analysis. Provided samples are thin (usually ~150 217
nm - 200 kV) and the elements of interest can be preserved, simultaneous structural and elemental 218
information can be obtained at the nanoscale (Figure 3) [69]. However, molecular information is 219
not available and absolute quantitation can be difficult. Using synchrotron X-rays nanoprobes, the 220
combination between X-ray phase contrast tomography and X-ray fluorescence microscopy can 221
provide the morphological information and quantification of elements, respectively (Figure 3). 222
This has been recently performed on a freeze-dried human phagocytic cell [16] and human red 223
blood cells infected with the malaria parasite Plasmodium falciparum [70]. An alternative to phase 224
contrast imaging is ptychography [71], which can be combined with XRF tomography to obtain 225
the 3D localization of elements in cells, such as bacteria in [72]. 226
New instruments that offer simultaneous morphological and molecular information are emerging 227
but are yet to be applied to biological specimens. For instance, the HIM-SIMS (Secondary Ion 228
Mass Spectrometry in the Helium-Ion Microscopy) can combine high-resolution morphological 229
images with elemental and isotopic maps from SIMS [73]. In contrast to EDS on an SEM, HIM-230
SIMS provides better detection limits for elements (including the very light ones) and 231
13
differentiation between isotopes. However, using HIM-SIMS for stable-isotope labelling 232
experiments will require a significant improvement of the mass resolution. Overall, the 233
combination of high-resolution secondary electron images and mass-separated sputtered ion 234
distributions has high potential to answer open questions in cell biology. 235
236
Image processing for multimodal correlative imaging. Upon acquisition on different imaging
237
platforms, micrographs need to be processed to correlate or even overlap information from the 238
same cellular region. Multimodal 2D microscopy requires registration algorithms that can analyze 239
the same region but at different fields-of-views and resolutions from images acquired with 240
different excitation probes (e.g. photons, electrons and ions) as well as different detectors. 241
Compared to monomodal images processing, more sophisticated approaches are needed for 242
multimodal images since the pixel-intensity of features is not comparable or do not even occur in 243
both images. The additional challenge in multimodal data sets is the shape of the object that might 244
be different because of preparation steps or different probing depths of the microscopes. 245
Distortions may also be introduced when subsequent sections, representing different depth layers 246
of the sample, are used for correlative imaging. In this context, the ImageJ-based software Correlia 247
has been recently developed for the registration of 2D-2D multi-modal microscopy data-sets 248
(available on request). 249
250
Perspectives and future challenges for multimodal subcellular imaging.
251252
Subcellular mapping metabolites in cells.
253
Visualization of the compartmentalized distribution of metabolites in cells is one of the most 254
promising research avenues in biology. Recently, laser-based ionization mass spectrometry 255
techniques have been successfully used in single-cell metabolomics profiling experiments, but the 256
lateral resolution precludes imaging subcellular chemistry [74]. Mapping metabolites at 257
subcellular level can be now envisioned with the revolutionary SIMS instrument Hybrid SIMS 258
(3D OrbiSIMS, IONTOF) that combines the speed and high lateral resolution imaging capabilities 259
of ToF-SIMS with unprecedented mass resolution (240K), mass accuracy (sub-ppm), dynamic 260
range (S/N ratio~105), and MS/MS capabilities of the Orbitrap Q-Exactive [75]. The instrument 261
has been used to map the distribution of lipids and neurotransmitters in the hippocampal region 262
14
of the mouse brain at the cellular and subcellular level. The 3D imaging capabilities were used 263
to visualizing the accumulation of amiodarone in single lung macrophage cells, and assessing 264
its toxic effect by correlating drug concentration with the levels of phospholipids and 265
cholesterol [75]. 266
267
Future improvements needed to probe cells in their native state and in four dimensions. The
268
future of chemical imaging largely relies in the development of cryo-analyses and associated 269
correlative workflows to allow multiscale chemical analysis of cells in their native state across 270
multiple instruments. Currently, cryo-analyses present limitations in regard to the suitability of 271
samples for cryo-preservation and their transfer between different platforms without ice 272
contamination. In most cases, frozen cells must be sectioned/milled in order to visualize the 273
interior. Future expansion in this area will require improvements in preparation of quality cryo-274
sections (e.g. cryo-FIB-SEM), development of cryo-enabled instrument platforms (e.g. 275
nanoSIMS), and the capability to transfer samples seamlessly between these. Additional 276
challenges associated to cryo-imaging are the low contrast of vitrified cells and possible 277
devitrification under irradiation from the probe (e.g. ions, X-rays). 278
Chemical information in 2D is insufficient to fully describe the compartmentalization of an 279
element/molecule throughout an entire cell, especially when information comes from a single thin 280
section (60-300 nm thickness) of a cell. Techniques to acquire 3D structural information at the 281
subcellular level are readily available (e.g. FIB-SEM) but it is difficult to couple these with 282
analytical information. Synchrotron-based coherent X-ray scattering techniques such as 283
holotomography or ptychography have both demonstrated constant improvements toward 284
ultrastructural 3D characterization of a cell architecture [76]. We therefore foresee a bright future 285
in the coupling between these techniques with X-ray fluorescence tomography for 3D elemental 286
imaging. 287
The down side of high-resolution chemical imaging is the low throughput, which precludes for 288
robust statistical analyses. We can expect that ultra-high-speed scanning strategy and highly 289
efficient detection will be the next steps to foster on the instrumentation side. For example, 290
extremely brilliant X-ray synchrotron source and high-rate scanning strategies become reality with 291
the upgrade of the synchrotrons, such as the European Synchrotron Radiation Facility (ESRF) [77]. 292
15
Finally, future developments need to integrate a biologically-relevant temporal dimension into the 293
correlative imaging workflow towards 4D imaging. Because probing elements and molecules of 294
live cells at the nanoscale level remain very challenging, there is a need to capture multiple 295
snapshots of a phenotypic state of a cell over time to follow and better understand dynamic cellular 296
processes following exposure to abiotic or biotic stress. One single snapshot may provide a biased 297
vision of the phenotypic response of a cell if imaging analysis occurs on the inappropriate 298
timescale. Temporal resolution can be obtained by the coupling with live imaging (fluorescent and 299
super resolution microscopy) and developing microfluidic devices [78], or rapid cryo-fixation 300
strategies [79]. For instance, dynamic fluorescent light microscopy can be rapidly followed by 301
cryo-immobilization in few seconds for CLEM studies thanks to new tools (e.g. CryoCapsule), 302
and could be extended to chemical imaging in the future [80]. In addition, recent advances in super-303
resolution fluorescence microscopy (e.g. Stimulated emission depletion - STED - microscopy) 304
[81] and future development of new fluorescent element-specific probes will potentially provide a 305
dynamic view of labile elements (e.g. Ca2+, Fe2+/3+, Zn2+) in live cells at 10-50 nm resolution [82]. 306
Correlation with chemical imaging will open new perspectives for bridging temporal and spatial 307
resolution [83]. 308
Thus, the development of time-resolved 3D subcellular imaging in cryo-conditions will be a major 309
breakthrough in cell biology to capture dynamic subcellular processes in a native-state cell. 310
311
Outstanding Questions
- Is it possible to preserve the native physiological state of a cell from sample preparation to subcellular imaging? How can structural and chemical preservation of the cell be carefully assessed and artefacts identified to avoid misleading results?
- Can we resolve the chemical landscape (composition and distribution of elements and molecules) of a cell with high spatial resolution, in three dimensions and over a relevant temporal scale? What would be the analytical workflow to implement for 4D subcellular imaging?
- What are the methodological and technological strategies to analyze the same subcellular region of interest across different subcellular imaging techniques?
- How can we include cryo-analysis in the workflow of correlative subcellular imaging, from sample preparation to obtain vitreous cells, to transfer and imaging across different platforms? Can it be applied to different types of cells from a tissue or isolated in culture or the environment?
16
- How can the throughput of chemical imaging techniques be increased to observe large numbers of biological samples and perform robust statistical comparisons?
- Can we enhance the mass and spatial resolution of SIMS imaging instruments in order to visualize a large number of different metabolites in the cell?
312
Concluding Remarks
313Subcellular chemical imaging techniques are constantly improving and becoming ever-more 314
powerful tools for quantitative visualization of elements, isotopes, and molecules in cells. 315
However, untangling their complex requirements and capabilities is a vital step in ensuring that 316
researchers can apply such methods to outstanding research questions and problems. With this, 317
appropriate sample preparation and suitable imaging platform(s) need to be selected according to 318
the sample, spatial resolution, and targeted elements/molecules. In this review, we have outlined 319
the principles of key analytical instrumentation, discussed strategies for sample preparation, and 320
highlighted the potential for correlative electron microscopy and chemical imaging to accumulate 321
structural and chemical information from a single region of a cell. Correlated morphological and 322
chemical imaging has the potential to spur a rapid expansion in different fields, such as cell 323
biology, biomedicine, ecophysiology, pharmacology, toxicology, biogeochemistry. In the near 324
future, we do not foresee a technique that would encompass all the capabilities to explore the 325
chemical/molecular/isotopic composition and ultrastructure of a cell. Thus, the development of 326
integrative studies and dedicated analytical correlative workflows, from sample preparation to 327
multimodal imaging and image processing, will be a major contribution towards a full 328
comprehension of the physiology of a cell at the subcellular level. 329
330
Glossary
- Chemical imaging: spatial characterization of the chemical composition of a sample (isotopes,
elements, molecules). This can be achieved by multiple high-resolution imaging platforms, using different physical processes to interrogate subcellular information (e.g. X-ray fluorescence, ionization)
17
- Chemical landscape: Composition and distribution patterns of elements, isotopes and
molecules in a sample (e.g. cell). Its visualization cannot be obtained with a single imaging platform but different techniques need to be used in a correlative way.
- Correlative electron microscopy and chemical imaging: workflow to prepare samples, obtain micrographs from different complementary imaging platforms, and overlap morphological and chemical (elements/molecules) information from the same region of a specimen.
- HybridSIMS: [Bi]n (n=1, 3, 5, 7) or [Ar]n (n~1000) gas-cluster ion source are used for analysis of large molecular ions. The OrbiTrap analyzer provide a MRP of ~10E5 that enables a precise compound identification.
- Multimodal imaging: Microscopy observations of the same sample using more than two imaging platforms to obtain complementary morphological and chemical information (e.g. light and electron microscopy, nanoSIMS and S-XRF).
-nanoSIMS: single-atomic Cs+ or O- primary ions are used for both sputtering and analysis, the ionized material is then analyzed by a Mattauch-Herzog mass spectrometer that allows for the parallel detection of max 7 masses. The high energy of the primary ions causes a strong fragmentation of molecules down to single-atomic ions allowing for quantitation of changes in isotopic composition.
- SIMS: secondary ion mass spectrometry whereby secondary ions are sputtered away from
the topmost layer of a sample by a focused primary ion beam and analyzed in a mass spectrometer. NanoSIMS, ToF-SIMS and HybridSIMS are SIMS imaging techniques with primary ion beams of different sources and energies, and with different mass spectrometers to probe elements, isotopes and small molecules.
- ToF-SIMS: pulsed [Bi]n (n=1, 3, 5, 7) or [Ar]n (n~1000) cluster ion sources are mainly used for analysis while Ar [n] cluster, Cs+ or O- can be used as sputtering sources. The use of cluster ions for analysis reduces the fragmentation upon impact, leading to the preservation of molecular species. The Time-of-Flight mass spectrometer allows the simultaneous detection of all masses.
- Vitreous cell: Frozen hydrated cell with amorphous ice (i.e. without crystals that can alter the ultrastructure and chemical composition of cells). Vitreous cell can be obtained using high-pressure freezing or plunge freezing machines.
18
- ray fluorescence microscopy (XRF): physical process consisting on the emission of
X-rays from a specimen following the excitation of core electrons of atoms; the analysis of the emitted X-rays allows the identification of the elemental content of the specimen. The excitation of electrons can be achieved by a beam of electrons, protons or photons.
- ray phase contrast tomography: Tomographic technique sensitive to refraction of X-rays in matter, leading to phase variations of the X-X-rays depending on the sample's electron density, and particularly adapted to reveal weakly absorbing features like those present in biological samples.
331 332
19
Figure
333
20
Figure 1
- Key figure. Outline of correlative multimodal subcellular imaging workflow335
including electron and chemical imaging. Individual cells can be isolated from a population in
336
a tissue, culture or in the environment, and observed in vivo using light/fluorescence microscopy 337
for dynamic and functional imaging. After sample preparation (fixation and sectioning/milling), a 338
cell can be analyzed by different high-resolution imaging platforms in a correlative way. Electron 339
microscopy can unveil detailed ultrastructure of the cell while chemical imaging platforms 340
(nanoSIMS, X-ray fluorescence, ToF-SIMS, Hybrid-SIMS) enable the visualization and 341
quantification of elements, isotopes and molecules at the subcellular level. Finally, image 342
processing allows the correlation between multimodal micrographs that contain complementary 343
information of the cell. This workflow still requires some methodological developments at 344
different steps, from sample preparation to image processing, in order to further understand the 345
metabolism and physiology of a cell at the nanoscale in its close-to-native state. 346
21 347
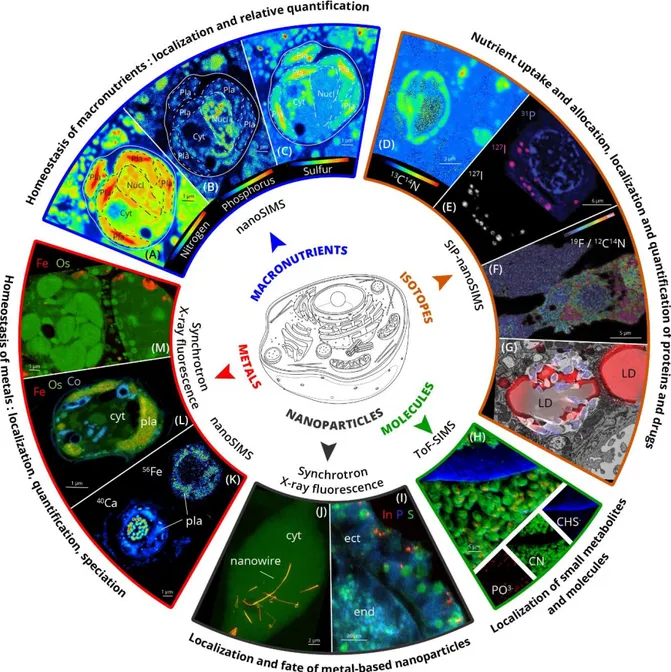
Figure 2.
The potential of chemical imaging to unveil the chemical landscape of a cell:348
composition and distribution of elements, isotopes and molecules at the nanoscale.
349
(A-B-C) NanoSIMS images showing the distribution of the macronutrients nitrogen (A; 12C14N-), 350
phosphorous (B; 31P-), and sulfur (C; 32S-) inside a microalgal cell. 351
(D) NanoSIMS image showing the uptake of 13C incorporated in proteins (13C14N) in cells after 352
incubation in 13C-labelled bicarbonate (SIP-nanoSIMS). 353
(E) NanoSIMS image acquired on macrophages treated with the drug Iodine-containing
354
amiodarone. The overlay of 31P- (blue) and 127I- (purple) secondary ions map provides 355
22
morphological information (localization of the nucleus) and shows specific localization of the drug 356
within the lysosomes. Reproduced with permission from [84]. 357
(F) Specific labeling of proteins for correlated fluorescence microscopy and nanoSIMS using
358
FluorLink–nanobody anti-GFP and direct immunostaining strategies. NanoSIMS image of 359
19F/12C14N ratio shows the presence of the targeted protein in specific cellular areas. Reproduced
360
with permission from [65]. 361
(G) Visualization of antibiotic in cells. Overlay of nanoSIMS and electron microscopy images
362
showing the accumulation of the antibiotic in lipid droplets (LD). The bromine-containing 363
antibiotic (bedaquiline) can be detected and semi-quantified by the nanoSIMS through the 79Br 364
ions (red signal). Reproduced with permission from [41]. 365
(H) ToF-SIMS images showing accumulation of phosphates (red, PO3−) in biofilm of algal cells 366
(green, CN−) growing in cotton (blue, CH4S−). Reproduced with permission from [47].
367
(I) Synchrotron X-ray Fluorescence image showing the distribution of indium phosphide-based
368
nanocrystals in a frozen section of the Hydra vulgaris. Nanocrystals (detected by indium X-ray 369
fluorescence, in red) are mainly internalized in the ectoderm layer (ect). The natural macronutrients 370
phosphorous (blue) and sulfur (green) provide the morphological context. Reproduced with 371
permission from [21]. 372
(J) Synchrotron X-ray Fluorescence image showing the presence of silver nanowires in a fibroblast
373
cell (S in green, and Ag in red). Yellow regions indicate colocalization of Ag and S inside the cell. 374
Reproduced with permission from [4]. Copyright 2019 National Academy of Sciences. 375
(K) NanoSIMS image showing the distribution of Ca (40Ca+) and Fe (56Fe+) in a microalga. 376
Calcium mapping unveils the overall morphology of the cells with high concentration in the 377
nucleus (nucl). Iron is mostly contained in the plastids (pla). 378
(L-M) Synchrotron X-Ray Fluorescence images showing the subcellular distribution and
379
quantification of the trace metals Fe (red) and Co (blue), and Os (green) in microalgal cells. 380
Abbreviations: Pla: plastid of microalgal cell; Cyt: cytoplasm; Nucl: nucleus; LD: Lipid droplet; 381
ect: ectoderm; end: endoderm. 382
383
23 385
Figure 3.
Examples of correlated electron microscopy and chemical imaging.
38624
(A) Correlation between electron microscopy (left images) and nanoSIMS (middle images)
387
showing the sulfur (32S-, upper image) and nitrogen (12C14N-, lower image) content in a microalgal
388
cell. Right images show the overlay of macronutrient mapping and ultrastructure obtained from 389
consecutive sections or the same section.Image courtesy of Charlotte Lekieffre. 390
(B) Correlation between scanning electron microscopy (SEM) and Synchrotron X-Ray
391
Fluorescence microscopy (S-XRF). SEM observation has been performed on the same cell section 392
after S-XRF analysis. S-XRF mapping of phosphorous and iron (green), and sulfur (red) unveils 393
numerous hotspots (one example highlighted by the yellow circle) where sulfur and iron are 394
colocalized in high concentration in the cell. 395
(C) TEM image (left) with corresponding EFTEM (Energy-Filtered Transmission Electron
396
Microscopy Fe map (right) showing aggregated ferritin molecules within a cell (courtesy Jeremy 397
Shaw and David Keays). Scale bar = 100 nm. 398
(D) Correlation between Scanning Electron Microscopy, ToF-SIMS and nanoSIMS showing the
399
cell ultrastructure, distribution of sulfur molecules (CHSN-, S-, HS-) and sulfur (32S-), respectively. 400
These multimodal images were acquired from consecutive thin sections. 401
(E) EM- Hybrid SIMS image showing the 3D distribution in a single cell of the drug amiodarone
402
(m/z 646, green) and biomolecules at m/z 157 (purple) and m/z 184 (green) (upper image). Lower 403
image obtained from the hybrid SIMS instrument shows that C24:1 sulfatides (m/z 888.62, green) 404
are localized to the corpus collosum. DNA base adenine (red, m/z 134.05), a nuclear marker, shows 405
that neurons are densely packed in the pyramidal layer and sparsely packed in the Stratum Oriens, 406
where phosphoinositol is located (m/z 241.01, blue). Figure adapted with permission from [75]. 407
(F) Direct correlation between X-ray phase contrast and X-ray fluorescence tomography on a
408
malaria-infected cell. The 3D mass density volume is obtained as after tomographic reconstruction 409
(on the left). Subsequent X-ray fluorescence scanning measurements were performed on the same 410
sample showing the 3D mass concentration volumes of iron, sulfur, and phosphorous (on the right). 411
Reproduced with permission from [70]. 412
413 414
25 415
Figure 4.
How to visualize metals in cells?416
Decision flowchart to guide users for probing metals in a single cell at high resolution and 417
sensitivity.. 418
26
Acknowledgements
419
J.D was supported by the LabEx GRAL (ANR-10-LABX-49-01), Pȏle CBS from the University 420
of Grenoble Alpes, and Défi X-Life grant from CNRS. The authors acknowledge the support and 421
use of resources from Instruct (a Landmark ESFRI project) and the ESRF for providing beamtime. 422
We are thankful for the use of the analytical facilities of the Centre for Chemical Microscopy 423
(ProVIS) at UFZ Leipzig, which is supported by European Regional Development Funds (EFRE— 424
Europe funds Saxony) and the Helmholtz Association.This research is also supported by EMBRC-425
France, whose French state funds are managed by the ANR within the Investments of the Future 426
program under reference ANR-10-INBS-02. We also thank Yannick Schwab for critically reading 427
the manuscript and suggesting improvements. We are grateful to colleagues for sharing 428 microscopy images. 429 430
References
4311 Salt, D.E. et al. (2008) Ionomics and the study of the plant ionome. Annual review of plant biology 432
59, 709–733 433
2 Hackett, M.J. et al. (2019) Elemental characterisation of the pyramidal neuron layer within the rat 434
and mouse hippocampus. Metallomics 11, 151–165 435
3 Veronesi, G. et al. (2016) Visualization, quantification and coordination of Ag + ions released 436
from silver nanoparticles in hepatocytes. Nanoscale 8, 17012–17021 437
4 Lehmann, S.G. et al. (2019) Crumpling of silver nanowires by endolysosomes strongly reduces 438
toxicity. Proceedings of the National Academy of Sciences 116, 14893–14898 439
5 de Boer, P. et al. (2015) Correlated light and electron microscopy: ultrastructure lights up! Nature 440
Methods 12, 503–513
441
6 Karreman, M.A. et al. (2016) Intravital Correlative Microscopy: Imaging Life at the Nanoscale. 442
Trends in Cell Biology 26, 848–863
443
7 da Cunha, M.M.L. et al. (2016) Overview of chemical imaging methods to address biological 444
questions. Micron 84, 23–36 445
8 Baker, T.C. et al. (2017) Recent advancements in matrix-assisted laser desorption/ionization mass 446
spectrometry imaging. Current Opinion in Biotechnology 43, 62–69 447
9 Lauwers, M. et al. (2013) An iron-rich organelle in the cuticular plate of avian hair cells. Current 448
Biology 23, 924–929
449
10 Cotte, M. et al. (2017) The ID21 X-ray and infrared microscopy beamline at the ESRF: status and 450
recent applications to artistic materials. J. Anal. At. Spectrom. 32, 477–493 451
27
11 Pushie, M.J. et al. Elemental and chemically specific x-ray fluorescence imaging of biological 452
systems. , Chemical Reviews, 114. (2014) , 8499–8541 453
12 Decelle, J. et al. (2019) Algal Remodeling in a Ubiquitous Planktonic Photosymbiosis. Current 454
Biology DOI: 10.1016/j.cub.2019.01.073
455
13 Kashiv, Y. et al. (2016) Imaging trace element distributions in single organelles and subcellular 456
features. Scientific Reports 6, 21437 457
14 Adams, M.S. et al. (2016) Copper Uptake, Intracellular Localization, and Speciation in Marine 458
Microalgae Measured by Synchrotron Radiation X ‑ ray Fluorescence and Absorption 459
Microspectroscopy. DOI: 10.1021/acs.est.6b00861 460
15 Ciccotosto, G.D. et al. (2014) Quantitation and localization of intracellular redox active metals by 461
X-ray fluorescence microscopy in cortical neurons derived from APP and APLP2 knockout tissue. 462
Metallomics 6, 1894–1904
463
16 Gramaccioni, C. et al. (2018) Nanoscale quantification of intracellular element concentration by 464
X-ray fluorescence microscopy combined with X-ray phase contrast nanotomography. Applied 465
Physics Letters 112,
466
17 Brown, K. et al. (2018) Intracellular in situ labeling of TiO2 nanoparticles for fluorescence 467
microscopy detection. Nano Research 11, 464–476 468
18 Fus, F. et al. (2019) Intracellular Localization of an Osmocenyl-Tamoxifen Derivative in Breast 469
Cancer Cells Revealed by Synchrotron Radiation X-ray Fluorescence Nanoimaging. Angewandte 470
Chemie International Edition 58, 3461–3465
471
19 Kapishnikov, S. et al. (2019) Mode of action of quinoline antimalarial drugs in red blood cells 472
infected by Plasmodium falciparum revealed in vivo. Proceedings of the National Academy of 473
Sciences DOI: 10.1073/pnas.1910123116
474
20 Sanchez-Cano, C. et al. (2019) Nanofocused synchrotron X-ray absorption studies of the 475
intracellular redox state of an organometallic complex in cancer cells. Chemical Communications 476
55, 7065–7068 477
21 Veronesi, G. et al. (2019) In Vivo Biotransformations of Indium Phosphide Quantum Dots 478
Revealed by X-Ray Microspectroscopy. ACS Applied Materials & Interfaces 11, 35630–35640 479
22 Hackett, M.J. et al. (2016) Chemical biology in the embryo: In situ imaging of sulfur biochemistry 480
in normal and proteoglycan-deficient cartilage matrix. Biochemistry 55, 2441–2451 481
23 Gyngard, F. and Steinhauser, M.L. (2019) Biological explorations with nanoscale secondary ion 482
mass spectrometry. Journal of Analytical Atomic Spectrometry 34, 1534–1545 483
24 Agüi-Gonzalez, P. et al. (2019) SIMS imaging in neurobiology and cell biology. Journal of 484
Analytical Atomic Spectrometry 34, 1355–1368
485
25 Malherbe, J. et al. (2016) A new RF plasma oxygen primary ion source on NanoSIMS for 486
improved lateral resolution and detection of electropositive elements at single cell level. Analytical 487
Chemistry DOI: 10.1021/acs.analchem.6b01153
488
26 Nuñez, J. et al. (2018) NanoSIMS for biological applications: Current practices and analyses. 489
Biointerphases 13, 03B301
28
27 Weng, N. et al. (2017) In situ subcellular imaging of copper and zinc in contaminated oysters 491
revealed by nanoscale secondary ion mass spectrometry. Environmental Science & Technology 492
DOI: 10.1021/acs.est.7b05090 493
28 Tsednee, M. et al. (2019) Manganese co-localizes with calcium and phosphorus in 494
Chlamydomonas acidocalcisomes and is mobilized in Mn-deficient conditions. Journal of 495
Biological Chemistry DOI: 10.1074/jbc.RA119.009130
496
29 Mayali, X. (2020) NanoSIMS: Microscale Quantification of Biogeochemical Activity with Large-497
Scale Impacts. Annual Review of Marine Science 12, 1–19 498
30 Musat, N. et al. (2016) Tracking microbial interactions with NanoSIMS. Current Opinion in 499
Biotechnology 41, 114–121
500
31 Stryhanyuk, H. et al. (2018) Calculation of single cell assimilation rates from sip-nanosims-501
derived isotope ratios: A comprehensive approach. Frontiers in Microbiology 9, 1–15 502
32 Berthelot, H. et al. (2018) NanoSIMS single cell analyses reveal the contrasting nitrogen sources 503
for small phytoplankton. The ISME Journal DOI: 10.1038/s41396-018-0285-8 504
33 Terrado, R. et al. (2017) Autotrophic and heterotrophic acquisition of carbon and nitrogen by a 505
mixotrophic chrysophyte established through stable isotope analysis. ISME Journal 11, 2022– 506
2034 507
34 He, C. et al. (2018) NanoSIMS imaging reveals unexpected heterogeneity in nutrient uptake by 508
brown adipocytes. Biochemical and Biophysical Research Communications 504, 899–902 509
35 Lekieffre, C. et al. (2018) Inorganic carbon and nitrogen assimilation in cellular compartments of 510
a benthic kleptoplastic foraminifer. Scientific Reports 8, 1–12 511
36 Volland, J.M. et al. (2018) NanoSIMS and tissue autoradiography reveal symbiont carbon fixation 512
and organic carbon transfer to giant ciliate host. ISME Journal 12, 714–727 513
37 Gibbin, E. et al. (2019) Vibrio coralliilyticus infection triggers a behavioural response and 514
perturbs nutritional exchange and tissue integrity in a symbiotic coral. ISME Journal 13, 989–1003 515
38 Martínez-Pérez, C. et al. (2016) The small unicellular diazotrophic symbiont, UCYN-A, is a key 516
player in the marine nitrogen cycle. Nature Microbiology 1, 16163 517
39 Pasulka, A.L. et al. (2018) Interrogating marine virus-host interactions and elemental transfer with 518
BONCAT and nanoSIMS-based methods. Environmental Microbiology 20, 671–692 519
40 Worrich, A. et al. (2017) Mycelium-mediated transfer of water and nutrients stimulates bacterial 520
activity in dry and oligotrophic environments. Nature Communications 8, 521
41 Greenwood, D.J. et al. (2019) Subcellular antibiotic visualization reveals a dynamic drug reservoir 522
in infected macrophages. Science (New York, N.Y.) 364, 1279–1282 523
42 Vanbellingen, Q.P. et al. (2015) Time-of-flight secondary ion mass spectrometry imaging of 524
biological samples with delayed extraction for high mass and high spatial resolutions. Rapid 525
Communications in Mass Spectrometry 29, 1187–1195
526
43 Benettoni, P. et al. (2019) Identification of nanoparticles and their localization in algal biofilm by 527
3D-imaging secondary ion mass spectrometry. Journal of Analytical Atomic Spectrometry DOI: 528
29 10.1039/C8JA00439K
529
44 Henss, A. et al. (2018) High resolution imaging and 3D analysis of Ag nanoparticles in cells with 530
ToF-SIMS and delayed extraction. Biointerphases 13, 03B410 531
45 Raina, J.-B. et al. (2017) Subcellular tracking reveals the location of dimethylsulfoniopropionate 532
in microalgae and visualises its uptake by marine bacteria. eLife 6, 1–17 533
46 Dowlatshahi Pour, M. et al. (2019) Mass spectrometry imaging as a novel approach to measure 534
hippocampal zinc. Journal of Analytical Atomic Spectrometry 34, 1581–1587 535
47 Osorio, J.H.M. et al. (2019) Investigation of architecture development and phosphate distribution 536
in Chlorella biofilm by complementary microscopy techniques. FEMS Microbiology Ecology 95, 537
1–10 538
48 Sämfors, S. et al. (2019) Localised lipid accumulation detected in infarcted mouse heart tissue 539
using ToF-SIMS. International Journal of Mass Spectrometry 437, 77–86 540
49 Passarelli, M.K. et al. (2013) Single-cell lipidomics: Characterizing and imaging lipids on the 541
surface of individual Aplysia californica neurons with cluster secondary ion mass spectrometry. 542
Analytical Chemistry 85, 2231–2238
543
50 Moore, K.L. et al. (2014) Combined NanoSIMS and synchrotron X-ray fluorescence reveal 544
distinct cellular and subcellular distribution patterns of trace elements in rice tissues. New 545
Phytologist 201, 104–115
546
51 Zhou, J. et al. (2011) Reproducibility and quantitation of amplicon sequencing-based detection. 547
The ISME Journal 5, 1303–1313
548
52 Perrin, L. et al. (2015) Evaluation of sample preparation methods for single cell quantitative 549
elemental imaging using proton or synchrotron radiation focused beams. J. Anal. At. Spectrom. 550
DOI: 10.1039/C5JA00303B 551
53 Das, S. et al. (2019) Manganese Mapping Using a Fluorescent Mn 2+ Sensor and 552
Nanosynchrotron X-ray Fluorescence Reveals the Role of the Golgi Apparatus as a Manganese 553
Storage Site. Inorganic Chemistry 58, 13724–13732 554
54 Carmona, A. et al. (2019) Mapping Chemical Elements and Iron Oxidation States in the Substantia 555
Nigra of 6-Hydroxydopamine Lesioned Rats Using Correlative Immunohistochemistry With 556
Proton and Synchrotron Micro-Analysis. Frontiers in Neuroscience 13, 1–12 557
55 Carmona, A. et al. (2014) Environmental manganese compounds accumulate as Mn(ii) within the 558
Golgi apparatus of dopamine cells: relationship between speciation, subcellular distribution, and 559
cytotoxicity. Metallomics 6, 822 560
56 Domart, F. et al. (2019) Correlating STED and synchrotron XRF nano-imaging unveils the co- 561
segregation of metals and cytoskeleton proteins in dendrites. Bioarchive DOI: 562
http://dx.doi.org/10.1101/810754 563
57 Sanchez-Cano, C. et al. (2017) Synchrotron X-Ray Fluorescence Nanoprobe Reveals Target Sites 564
for Organo-Osmium Complex in Human Ovarian Cancer Cells. Chemistry - A European Journal 565
23, 2512–2516 566
58 Clode, P.L. et al. (2009) In Situ Mapping of Nutrient Uptake in the Rhizosphere Using Nanoscale 567