Continuous Mixing of Chemical Batches to
Improve Cost, Cycle Time, and Process Control
By Julie Endress
B.S. Industrial Engineering, Purdue University, 1992 Submitted to the Sloan School of Management and the
Department of Mechanical Engineering
in partial fulfillment of the requirements for the degrees of Master of Science in Management
and
Master of Science in Mechanical Engineering at the
Massachusetts Institute of Technology June 1998
© 1998 Massachusetts Institute of Technology, All rights reserved
Signature of Author
Sloan School of Management "-nartment of Mechanical Engineering May 8, 1998 Certified by
Professor David Hardt, Thesis Advisor Department of Mechanical Engineering Certified by
Frofessor Roy Welsch, Thesis Advisor Sloan School of Management Accepted by
Lawrence S. Abeln, Director of Master's Program Sloan School of Management
Accepted by
Anthony T. Patera, Acting Chairman of the Graduate Committee Department of Mechanical Engineering
I' '/ o(a~:,
Continuous Mixing of Chemical Batches to Improve Cost, Cycle Time
and Process Control
By Julie Endress
Submitted to the Sloan School of Management and the Department of Mechanical Engineering on May 8, 1998 in Partial Fulfillment of the Requirements for the Degrees of
Master of Science in Management and
Master of Science in Mechanical Engineering
Abstract
Continuous mixing of chemical batches improves cost, cycle time and process control. Continuous mixing is a manufacturing strategy that provides new capabilities not possible from a batch process. In the case of photographic developer, the ability to repeatedly control the mixture ratio, to change the mixture ratio, and to control the quantity mixed will improve cost and process control over a batch process. Placing this capability in Assembly and pushing customization closer to the final product reduces
inventory and cuts the cycle time for matching components. This thesis proves the technical feasibility of continuous mixing of color developer through two-way and three-way mixing experiments on large-scale and small-scale mixing equipment. It provides data that indicates no practical difference in the sensitometric, rheological, or physical results of a film system with the developer made by the continuous mixing process
compared to the existing batch process. This thesis provides a recommended equipment design for new continuous mixing equipment to be used in Assembly and a financial analysis indicating the benefit of continuous mixing for Polaroid's international sites, Scotland and Mexico.
Thesis Advisors:
Professor Dave Hardt, Mechanical Engineering Professor Roy Welsch, Sloan School of Management
Acknowledgements
I would like to thank the Leaders for Manufacturing Program for the opportunity to be in such a positive learning environment for the past two years. This thesis would not have been possible without the structure of the program, the resources, and the support I received through LFM. A special thanks to my advisors, Dr. Dave Hardt and Dr. Roy
Welsch, for their guidance and advice.
I would also like to acknowledge a few key people from Polaroid: Ken Pickering,
Yolanda Larriu, Jeff Cohen, and Connie McGilvary. My experience with Polaroid was a success due largely to their interest and support in my internship, my thesis, the LFM program and me. In addition, I would like to acknowledge the many fruitful discussions with Manuel Jaime, my LFM colleague also interning at Polaroid in 1997.
This thesis is dedicated to my grandfather, Rodman R. Tatnall, who at age 91 is an inspiration to me still. His wisdom, wit, and love make me proud to be his
granddaughter.
I would also like to thank Pablo and my family who have provided me with never-ending love and support. Pablo, I am so glad we went through this together!
Table of Contents
INTRODUCTION AND OVERVIEW ... 11
1.1 RECOMMENDATION ... 12
1.2 CHAPTER SUMMARY ... .... .... ... ... 12
2. THE PRODUCT: POLAROID TECHNICAL AND INDUSTRIAL (T&I) FILM ... 14
2.1 NEGATIVE AND SHEET ... ... ... ... ... 15
2.2 DEVELOPER (REAGENT)... 15
2.2.1 Definition of Color Terms for Photography... 15
2.2.2 Purpose ofDeveloper in Achieving Color Balance ... ... 17
3. TH E EXISTING PRO CESS ... 19
3.1 ORGANIZATIONAL STRUCTURE ... ... 19
3.2 NEGATIVE VARIABILITY ... ... 21
3.3 DEVELOPER COMPENSATION THROUGH RECIPE DEVELOPMENT AND RECIPE SELECTION... 21
3.4 METHODS OF MEASUREMENT ... ... ... 24
3.4.1 Definition ofSensitometry ... ... 25
3.4.2 Definition of Physical Evaluation... ... 30
3.4.3 Definition ofRheology... ... 31
3.5 DESCRIPTION OF EXISTING BATCH PROCESS FOR MIXING DEVELOPER (REAGENT)... 33
3.6 MOTIVATION FOR IMPROVEMENT: COST, CYCLE TIME AND PROCESS CONTROL... 35
4. CONTINUOUS MIXING FOR IMPROVEMENT ... ... 38
4.1 DESCRIPTION OF CONTINUOUS MIXING... ... 38
4.1.1 Continuous Mixing Applied to Color Developer... 39
4.2 EXAMPLES OF CONTINUOUS MIXING AT POLAROID ... 40
4.2.1 Example of Continuous Mixing Equipment, Reagent Blend (RB) ... 40
4.2.2 Example of Continuous Mixing Equipment, Development In-line Blend (ILB) ... 41
4.3 EVALUATION OF CONTINUOUS MIXING AS DEVELOPER MANUFACTURING PROCESS ... 44
4.3.1 Quality of Continuous Mixing... .. .. ... 45
4.3.2 Cost of Continuous Mixing ... ... 46
4.3.3 Time for Continuous Mixing... ... 47
4.4 REMAINING UNCERTAINTIES WITH CONTINUOUS MIXING FOR COLOR DEVELOPER ... 49
4.4.1 Prove Low Product Performance Risk... ... 49
4.4.2 D em onstrate B enefits... ... 50
5. METHODOLOGY AND EXPERIMENTAL RESULTS FOR PROVING CONTINUOUS
MIXING OF COLOR DEVELOPER TO BE LOW RISK ... ... 52
5.1 QUALIFICATION OF THE RB FOR COLOR DEVELOPER ... ... 52
5.1.1 Experimental Design: Qualification of two-stream continuous mixing of color developer... 52
5.1.2 Experimental Results ofRB for Color Developer... ... 53
5.1.3 Summary ofExperimental Results ofRB for Color Developer ... 66
5.2 FEASIBILITY OF THREE-STREAM CONTINUOUS MIXING OF COLOR DEVELOPER ... 66
5.2.1 Experimental design: Three-stream Blend of Color Developer... 67
5.2.2 Experimental Results of Three-stream Continuous Mixing on the ILB... 68
5.2.3 Development of a Control for Response Surface Comparison ... 68
5.2.4 Summary of Three-stream Continuous Mixing... ... 72
5.3 IMPLEMENTATION OF CONTINUOUS MIXING ... ... 72
5.3.1 Results oflmplementation... ... 73
6. EQUIPMENT DESIGN AND FINANCIAL ANALYSIS LEADING TO RECOMMENDATION78 6.1 DESIGN OF THREE-STREAM CONTINUOUS MIXING EQUIPMENT FOR USE IN ASSEMBLY ... 78
6.1.1 Team Effort for D esign ... ... ... 78
6.1.2 Description of Continuous Mixing Equipment Design for Use in Assembly ... 78
6.2 FINANCIAL MODEL OF T&I CONTINUOUS MIXING OF DEVELOPER... 79
6.2.1 Results of Financial M odel ... 80
6.2.2 Background of Financial Model ... 81
6.3 RECOMMENDED STRATEGY ... 82
7. DISCUSSION AND CONCLUSION ... 84
7.1 SUMMARY OF ORGANIZATIONAL ISSUES... ... ... 84
7.1.1 Waltham Reagent Design Group ... ... 84
7.1.2 Waltham Reagent Manufacturing Group... ... ... 85
7.1.3 W altham A ssem bly G roup ... 85
7.1.4 Scotland Assembly Group... .. .. ... 85
7.1.5 W orldw ide team ... ... ... 86
7.2 CONCLUSION ... 86
R EFER EN C ES ... 88
Table of Figures
Figure 1. Components of peel apart instant film ... 14
Figure 2. Additive (red, green, blue) and subtractive (yellow, cyan, magenta) color wheels... 16
Figure 3. Three-axis representation of the additive and subtractive colors ... 17
Figure 4. Color wheel with range of developer compensation by manipulating two chemicals .. 18
Figure 5. A representation of the organizational structure for instant film ... 19
Figure 6. Process flow for developer compensation through recipe development or selection .... 22
Figure 7. Process flow for developer compensation through recipe selection... 24
Figure 8. Simple schematic of a sensitometer (light source, exposure modulator, and exposure plane) ... ... ... 25
Figure 9a. Characteristic sensitometry curves (H&D Curve) red, blue and green SPEED ... 27
Figure 9b. Characteristic sensitometry curves (red, blue and green) BALANCE ... 28
Figure 9c. Characteristic sensitometry curves (red, blue and green) DENSITY MAXIMUM and M IN IM U M ... ... ... 29
Figure 10. Sensitivity to density balance ... 30
Figure 11. Viscoelastic substances: Applied strain and resulting stress is out-of-phase by 5 ... 32
Figure 12. Strain sweep: Storage Modulus, Loss Modulus, Loss Factor... 32
Figure 13. Process flow for developer manufacturing ... ... 34
Figure 14. Variable and predictable cycle time portions of the process flow...35
Figure 15. Simple representation of a static mixer ... ... ... 38
Figure 16. Color wheel with example of simple continuous mixing ... 39
Figure 17. Three-way application of continuous mixing for color developer ... 40
Figure 18. RB (Reagent Blend) equipment schematic...41
Figure 19. ILB (In-line Blend) equipment schematic ... 42
Figure 20. Comparison of blending equipment capabilities ... ... 44
Figure 21. Functional requirements of developer manufacturing process ... 44
Figure 22. Experimental design, replications and mix ratios ... ... 53
Figure 23. Rheology control chart: Storage Modulus (10 blends within 2 sigma control limit). 54 Figure 24. Rheology Control Chart: Loss Factor (10 blends within 2 sigma control limit)...54
Figure 25. Table of two sample t-test for Loss Factor: Continuous mixing versus existing batch process ... ... ... ... 56
Figure 26. Boxplot of Loss Factor (normalized) for continuous mix versus existing process .... 56
Figure 28. Difference between control batch and continuous mixing (Blend #5) for red density
m axim um ... ... ... 60
Figure 29. Difference between control and continuous mixing (Blend #5) for blue density m inim um ... ... 60
Figure 30. Difference between control and continuous mixing (Blend #5) for green speed...61
Figure 31. Difference between control and continuous mixing (Blend #5) for blue balance...61
Figure 32. Difference between control and continuous mix (Blend #5) for red balance ... 62
Figure 33. Red, blue and green sensitometric curves; ... ... 64
Figure 34. Regression of blue balance versus chemical B levels for all blends, source batches and control batch... ... ... 65
Figure 35. Table of physical evaluation of blend #5 vs. control batch ... 66
Figure 36. Experimental design (Three-corner mixture): Three-stream blend (continuous m ixing) ... ... 68
Figure 38. Red Balance = 0.167 - 3.814*Chem B + 0.075*Chem R ... 69
Figure 39. Blue Balance = -0.20 + 30.0 * Chem. B ... ... 70
Figure 40. Red Balance = 0.173 + 0.119 * Chem. R ... 70
Figure 41. Blue and red response surface for experimental and production data ... 72
Figure 42. Box plot of blue balance for recipe #1, existing process and continuously mixed... 75
Figure 43. Box plot of blue balance for recipe #2, existing process and continuously mixed... 76
Figure 44. Box plot of blue balance for recipe #1, existing process and continuously mixed:... 77
Figure 45. Box plot of blue balance for recipe #2, existing process and continuously mixed... 77
Figure 46. Schematic of three-stream portable blending unit ... 79
Introduction and Overview
Today, manufacturing companies face ever increasing challenges. More demanding customer needs and expectations force companies to make changes just to stay in
competition. The cost, quality, and response time demands are intensifying. Polaroid, a company that led the instant photography industry years ago as a product innovator, did not need to focus on competition, supply chain design, or agile and flexible
manufacturing - but the external environment has changed. This thesis will address a particular manufacturing strategy that can help Polaroid beat the competition.
This work proves the technical feasibility and illustrates the business reasons for
continuous mixing of chemical batches of photographic developer. Continuous mixing of chemical batches is a manufacturing strategy that redesigns the internal supply chain and provides more flexibility. The strategy allows for the customization of the product closer to final assembly, rather than creating customized batches for inventory. This capability also allows for continuous control of the customization, again moving away from the one-time decision necessary in batch processing. Additional flexibility is gained by being able to continuously control quantity as well. The placement of this new
competence in assembly drastically reduces the cycle time for the customized matching of components, which results in reduced inventory carrying costs of other expensive components. The motivation for this project is to improve cost, cycle time and process control.
Once the technical feasibility is established, the business concerns are addressed. Several alternatives for implementing continuous mixing are generated and evaluated based on the financial and organizational impact. A review of the key organizational groups involved in the implementation is provided. A recommendation is provided for the implementation of a specific set of options for continuous mixing of color and black and white developer at Polaroid.
1.1 Recommendation
This work resulted in a recommendation for Polaroid to implement continuous mixing of color and black and white developer worldwide. Specifically, the largest return will be seen in the operation in the Vale of Leven, Scotland for both black and white and color developer. Polaroid in Enschede, Holland needs to cooperate in supplying the developer to assembly in the Vale of Leven. It is recommended that the Vale execute thorough testing of the equipment already purchased for this purpose before going into production.
The next highest return project is implementing continuous mixing of color developer at the Mexico site. Since this site is new to assembling color film, it is recommended that the Waltham, MA site be utilized to develop the expertise with new continuous mixing
equipment that would be used in assembly. A prototype unit should be purchased immediately to be used first with black and white developer in the 4X5 format assembly area in Waltham. If all of these recommendations are implemented successfully, Polaroid could realize over $600,000 in labor, material and inventory savings per year.
1.2 Chapter Summary
This thesis introduces the reader to the instant technical and industrial (T&I) film product in Chapter 2. Chapter 3 describes the existing process by first outlining the
organizational structure. Next it introduces negative variability, describes the component matching and developer compensation process, gives background about the existing chemical batch process, explains the key measurement systems for evaluating the film system, and summarizes the motivation for a change to the existing process. In Chapter 4, the proposed solution of continuous mixing is introduced and current examples of the
application of the technology are presented and described. This chapter provides a discussion of the functional requirements for continuous mixing and the remaining uncertainties for using this technology. Chapter 5 presents the experiments, results, analysis, and preliminary implementation data that prove the technical feasibility of continuous mixing of color developer. Chapter 6 outlines a proposed equipment design,
the financial model, and organizational observations which drive the final recommendations for the implementation of continuous mixing at Polaroid.
2. The Product: Polaroid Technical and Industrial (T&I) Film
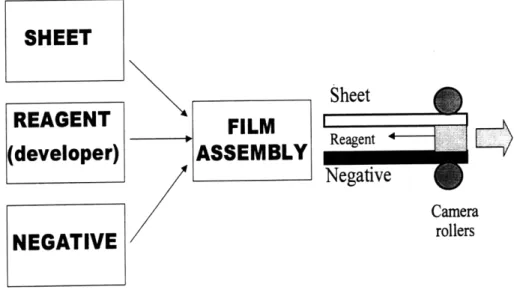
The Polaroid Technical and Industrial (T&I) Film division focuses on a commercial and professional market for instant film. There are both black and white and colorapplications. The three main components of the film are the negative, the sheet and the developer. The developer, a thick liquid chemical, is forced out of a small envelope and spread between the exposed negative and sheet by rollers as the user pulls the film from the camera as seen in Figure 1. This film is also referred to as peel apart film since the customer peels the negative apart from the sheet or image after pulling the film from the camera and waiting 60 seconds for it to develop.
SHEET
Sheet
REAGENT
FILM
I ReagentSheet
(developer)
ASSEMBLY
ReentNegative
Camera
NEGATIVE
rollersFigure 1. Components of peel apart instant film.
The T&I market and product line are different from the consumer market which Polaroid serves in that there are many more product offerings and several different formats for the film.
2.1 Negative and Sheet
The most costly component for color film is the negative because of its complex structural design and elaborate multi-layer continuous manufacturing process. The negative is also the most highly variable component in its photosensitive properties. The approach taken by Polaroid to adjust for the photosensitive variation in the negative is by adjusting the chemistry of the developer. The negative is categorized into groups based on its photosensitive performance and each group is then adjusted to target by a particular developer recipe. The process of matching negatives and developer recipes will be discussed in more detail in Chapter 3. The sheet is also manufactured by a continuous process and is quite similar from run to run and within run from a photographic
perspective. For this reason, much of the focus is placed on the negative and the sheet is considered a standard component.
2.2 Developer (Reagent)
A particular recipe of developer, which is a mixture of over two dozen different chemicals, has specific photosensitive and viscoelastic properties. The new color T&I film product has a unique developer design, different from any previous color developer, which is referred to commonly as reagent (these terms will be used interchangeably throughout this thesis). The new color developer was designed with the intention of manipulating two chemicals in particular that act linearly and nearly independently in the blue/yellow and red/cyan axes.
2.2.1 Definition of Color Terms for Photography
Color can be defined in terms of visible light waves. All light is comprised of various wavelengths which, when divided, provide a spectrum of color. The presence of all light waves simultaneously produces white light. As light wavelengths become more "pure," (meaning fewer of the various light wavelengths are present), we see color. The additive primaries are red, blue and green. As these colors mix, they produce all colors in the visible spectrum. As seen in Figure 2, the absence of red (or combination of blue and green) is cyan, the absence of blue (or combination of red and green) is yellow, and the absence of green (or combination of red and blue) is magenta. The additive color
method, also known as RGB, is used in technology like a television screen to produce all colors.
Red
Cyan
Magenta Yellow Green Blue
ed
Blue Green Yellow Magenta
Additive Color Wheel
Subtractive Color Wheel
Figure 2. Additive (red, green, blue) and subtractive (yellow, cyan, magenta) color wheels
In Figure 2 we also see the subtractive color wheel that is used in photography through the use of dyes. A color negative has three light sensitive layers (red, blue and green). As the red sensitive layer is exposed to a red object, a reaction occurs which traps the cyan dye in place. When the chemical developer is spread over the negative to transfer the image to the sheet, only the yellow and magenta dye will transfer or be released, thus producing a red image on the sheet.
The additive and subtractive color wheels can also be represented by a three axis diagram, as shown in Figure 3, that has a hexagon which connects one unit in each direction for a more quantitative representation of the color balance.
Mager
Cyan NZ _V, u, u) Red
Yellow Green
Figure 3. Three-axis representation of the additive and subtractive colors
For example, the dot shown in Figure 3 represents 2 units red, 0 units blue, and 0 units green. The target for a Caucasian fleshtone exposure would be slightly red and exactly balanced between blue/yellow and green/magenta.
2.2.2 Purpose of Developer in Achieving Color Balance
As mentioned above, a well designed developer in an instant Polaroid film system can be made more or less blue and more or less red by manipulating two chemicals. This capability is necessary to compensate for negative variability. It is a critical capability to adjust the photosensitive parameters so that the film system will be on target. The linear range of the two chemicals chosen as levers for the new color developer is sufficient to meet the needs within a negative run. The details of how the developer is designed and matched to the negative will be described in the chapter 3. Figure 4 provides a graphical example of the range within which the photosensitive characteristics of the negative can fall and still be easily compensated for by choosing the appropriate developer and adjusting just two chemicals. Otherwise, if the negative fell outside of this range, a new design would be needed for the developer.
Cyan
Figure 4. Color wheel with range of developer compensation by manipulating two chemicals
3. The Existing Process
3.1 Organizational Structure
Figure 5 shows a representation of the organizational structure for Polaroid's instant film. Reagent Manufacturing can be seen as part of the component side of the business. This group along with the Release and Reagent Design group act as a key interface to the Assembly area by being responsible for matching the components through developer recipe selection. Reagent Manufacturing is an especially important interface since the developer is actually produced by them and shipped to Assembly.
Integral
closely together to
match components
for assembly Product Flow of Developer toAssembly
Figure 5. A representation of the organizational structure for instant film. Developer produced by Reagent Manufacturing is shipped to Assembly.
Reagent Manufacturing: The Reagent Manufacturing division of Polaroid has two geographic locations, one in Waltham, Massachusetts which supplies both the Waltham T&I assembly area and the Mexico assembly plant. The other reagent manufacturing facility is in Enschede, Holland and supplies the Vale of Leven, Scotland. The Waltham
department runs like a small job shop with a total of about 10-15 processing technicians, and several product and process engineers. Their responsibilities include processing for development purposes as well as supplying assembly with production material. The
current process equipment consists of several small to medium sized chemical reactors which are between 30 and 50 years old and are used to process developer for both T&I and consumer products.
Release Department: The main Release Department is located in Waltham, in the same building as the Reagent Manufacturing area and very close to the Assembly area.
Typically, the role of the Release Department has been handled centrally in Waltham although there is a shift towards developing these skills at the Scotland and Mexico sites. The main mission of the Release Group is to determine the best developer recipe to be matched with a negative group. They work very closely with the Reagent Design group when necessary. This process will be discussed in more detail below.
Reagent Design: The Reagent Design group is also located in Waltham although in a separate building located within walking distance from the Reagent and Release areas. As will be discussed in more detail below, the mission of this group is to provide Reagent Manufacturing with a library (or range) of developer recipes which would meet the needs of the upcoming negative to be assembled.
T&I Assembly: The T&I Assembly division of Polaroid has three geographic locations. One is in Waltham, MA, another is in the Vale of Leven, Scotland, and the third is in Queretero, Mexico. Due to a recent re-organization, the Waltham site will be
significantly scaled down. The primary focus of the Waltham Assembly group was the small confirmation runs dictated by the Release group and the various film formats, which resulted in a job shop operation. At the time of this project, Waltham was staffed for two shifts, had several pod machines and several assembly machines for pack film as well as several other formats. A pod machine is used to pump developer from a tank and encapsulate it into a foil envelope to make individual pods. The pods are mated with
negative, sheet, and a few other minor components at the assembly machine for assembly of the film pack.
3.2 Negative Variability
The continuous process of manufacturing negative results in significant variation down the length of the sheet (down web) as well as across the width of the sheet (cross web). The typical run on the complex coating equipment can be as long as 3-4 days which introduces variation over time. Due to the long run, different lots of chemicals are introduced which also mark changes in the photosensitive characteristics of the negative. The spatial nature of a continuous coating process also drives variability within the negative.
The nature of the process also dictates that the negative have an extensive drying period during which the photosensitive characteristics change. With a mature product line, the drying or aging process would become predictable and testing done immediately after manufacturing would be reliable feed-forward data for determining the developer recipe. Unfortunately, for the new color negative, which is the focus of this thesis, the process had not been optimized and thus was much more difficult to handle with respect to designing and choosing the correct developer recipe.
This uncertainty around a moving target made developer design and recipe selection a very difficult process. To quickly ship product, it required a nimble developer
manufacturing area to support the constantly changing requests of recipes to match the negative groups. The operation needed to be able to produce many different recipes in small quantities.
3.3 Developer Compensation through Recipe Development and Recipe
Selection
A feed forward system is used to make film that meets the color balance target. The negative and sheet are tested, an aging curve is assumed and the critical path is determining the best developer recipe and manufacturing the developer. Extensive
matrix experiments are run by Reagent Design to build a model for recipe development. This model is used to help design more focused experiments that would meet the needs of
a particular negative run. Given the instability of the product design and the immaturity with this product in production, for a given negative run, the question would be asked,
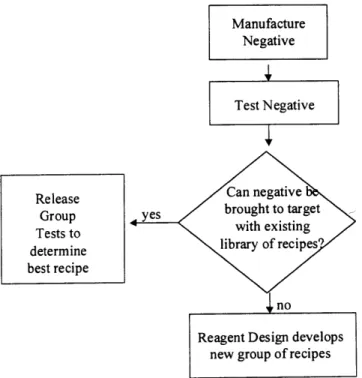
"Can it be brought to target with the current library of recipes that we have?" If not, extensive development work (small batches are made, tested and then scaled-up) would be initiated to create a new group of recipes to meet the needs of the negative. In the case that the current library was sufficient, the task would then belong to the Release Group to perform extensive testing and determine exactly which recipe is the best one to bring the negative group on target. This process flow can be seen in Figure 6.
Manufacture Negative
Test Negative
Release Can negative
Group yes brought to target
Tests to with existing
determine library of recipes?
best recipe
no
Reagent Design develops new group of recipes
Figure 6. Process flow for developer compensation through recipe development or selection
Because of some issues that the product can have under certain extreme environmental conditions, the negative design needed to be stabilized. As design changes were implemented, this often drove the need for new recipe development. The pressure to place only good product in the marketplace limited the time for development and highlighted some issues in Reagent Manufacturing. The process was painfully slow to
move from experimental development batches to full scale production of a new recipe. Scattered data showed some inconsistency in the photosensitive performance when scaling up batches. Reagent Manufacturing did not have the flexibility to change a recipe one day to the next if new information was obtained which dictated different needs.
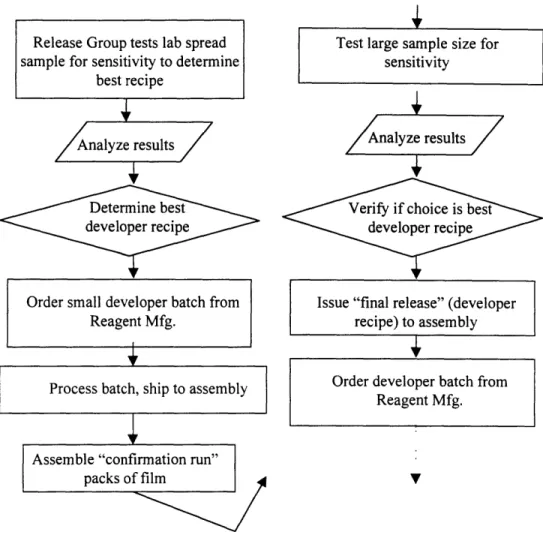
If the negative can be brought to target with the existing library of recipes, then the release group is chartered with identifying the correct recipe. In Figure 7, this process is outlined in more detail. The first step is to perform sensitometry tests on a small sample size of negative using lab spreads with various developer recipes. It is followed by an order being placed with Reagent Manufacturing to make a small batch of the developer chosen for a "confirmation" run. This "confirmation" run will assemble a diverse representation of the negative group with the developer chosen, the results are analyzed and then a "final release" is issued to assembly. With this "final release" assembly can then place orders with Reagent Manufacturing as desired to assemble with the particular negative group designated.
Test large sample size for
sensitivity
Analyze results
Verify if choice is best developer recipe
Issue "final release" (developer recipe) to assembly
Order developer batch from
Reagent Mfg.
Figure 7. Process flow for developer compensation through recipe selection
As seen from the several steps outlined in the process in Figure 7, even when the negative group can be matched with an existing developer recipe, it is still a fairly long process to make the recipe selection. This process also drives the need to order many small batches of developer, particularly for the "confirmation" runs.
3.4 Methods of Measurement
There are two main types of measurement that are used to evaluate the quality of instant film products with respect to developer. One is called sensitometry and refers to the photosensitive properties of the film system. The other are various physical
measurements which characterize the developer spreading process and the final visual qualities of the sheet and image. A more objective measurement of the viscoelastic
properties of the developer is used in the Reagent Manufacturing area. This measurement of Rheology is related to the spreading properties of the developer.
3.4.1 Definition of Sensitometry
Sensitometry is the measurement of the sensitivity of photographic materials. In practice, photographic materials are exposed to a known quantity and quality of radiant energy, developed under standard conditions and the densities resulting from exposures are measured. This section will introduce the instrumentation and materials used in
sensitometry as well as give an explanation of how to interpret the sensitometric results. The source of information for this section is credited to Alex Pendleton of Polaroid Corporation who documented and taught a Sensitometry Module for the Polaroid Imaging Science Seminar.
3.4.1.1 Instrumentation and Materials
Sensitometer
A sensitometer is an instrument for impressing on photographic material a series of precisely known graduated exposures. The two main parts are the light source and the exposure modulator. Typically a xenon bulb is used as the light source since it closely imitates daylight. The exposure modulator is often a colored glass wedge. The wedge is demarcated with gradual steps from being transparent to being opaque in either a neutral (gray) or fleshtone color. In Figure 8, a simple schematic of a sensitometer is presented.
Exposure Plane
Source
Modulator
Figure 8. Simple schematic of a sensitometer (light source, exposure modulator, and exposure plane)
Photographic Materials
The photographic materials used in sensitometry are usually of two forms: lab spreads or pack film. Lab spreads consist of three separate components: pre-cut negative, pre-cut sheet, and reagent pods. These three components are combined in the lab as opposed to a film pack that would have been assembled on the production line. Another important instrument is called the Mechanical Lab Roller (MLR). The rollers are used to spread the developer between the negative and sheet after the exposure has been made on the
negative in the sensitometer. This equipment is utilized to set different "gap" widths (the distance between the rollers) for testing outside of the nominal conditions.
A particular negative group and a particular reagent recipe are chosen as the control components to be tested in the lab with any new material. For example, as a new reagent batch is made and needs to be tested for sensitivity, it will be matched up with a control negative and compared to the previous batch of that reagent recipe.
Densitometer
A densitometer measures dye density and can detect spectral sensitivity to separate red, green, and blue. An automated system can read the density for many lab spreads or frames very quickly. The results are expressed in graphic form as curves and from the curves numerical values are derived which are used to specify the characteristics of the material.
3.4.1.2 Sensitometric Curves
The resulting curve from the densitometer readings are density of the developed image versus logarithmic exposure for red, blue and green. Hurter and Driffield [1] were pioneers in the theory of photographic processes and thus the characteristic sensitometry
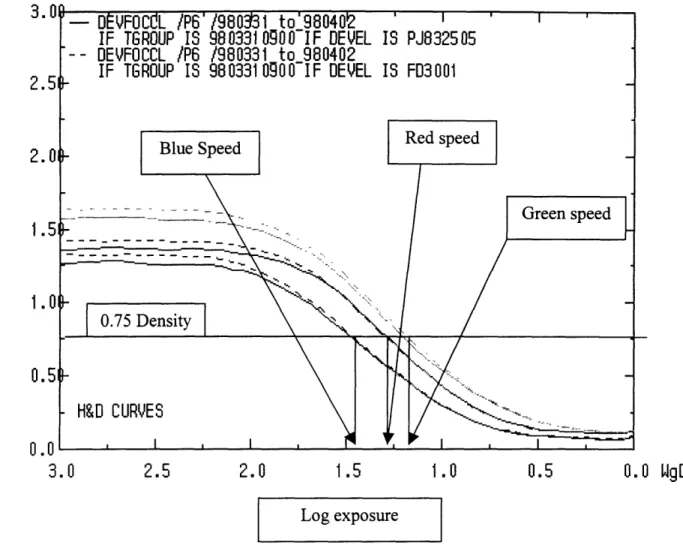
curves are often referred to as the H&D curves. Examples are provided in Figures 9a, b and c and show some of the various numerical parameters that are tabulated and used for analysis and comparison.
2.51 2.01 1.51 1.0 0.5
0.0
3.0
2.5 2.0 1.5 1.0 0.5 0.0 WgD Log exposureFigure 9a. Characteristic sensitometry curves (H&D Curve) red, blue and green SPEED
Speed: The exposure for a given color curve at 0.75 density intercept is an indication of the relative speed of the film. A higher value indicates that less exposure is necessary to achieve a given density.
Blue Balance Red balance
. 9 0.45 Density ' _
3.0 2.5 2.0 1.5 1.0 0.5 0.0 WgD
Log exposureg
Figure 9b. Characteristic sensitometry curves (red, blue and green) BALANCE
Balance: The exposure difference between the 0.45 intercept of the green curve from the red and blue curves is called color balance. This parameter indicates the hue of the print. For example, if the blue curve is faster than the green curve, it will have a blue hue. It
represents the difference in speed of the blue or red curve compared to the ----- --- --- - green curve.
--- 7 ~
0.0 3 I I I
3.0 2.5 2.0 1.5
Log exposure Figure 9c. Characteristic sensitometry curves (red, blue
MAXIMUM and MINIMUM
1.0
0.5and green) DENSITY
Maximum Density: The maximum density, read from the vertical axis, for each H&D curve (red, blue and green). This value represents the maximum dye transfer area of the print. It indicates how black the black parts of an image are.
Minimum Density: The minimum density, read on the vertical axis, for each H&D curve (red, blue and green). This value represents the minimum dye transfer area of the print. It indicates how white the white parts of an image will be.
3.4.1.3 Targets
The balance and speed targets are product specific and depend on a number of factors such as aging, and red, green and blue curve relationship, etc. For the color product that is the focus of this thesis, the following five metrics are closely monitored and have specification limits.
Red Density Maximum RDX Blue Density Minimum BDM
Green Speed GINT
Blue Balance B45D
Red Balance R45D
The typical balance targets for a fleshtone exposure is 0.0 blue balance and about 0.14 red balance. A strong emphasis is placed on the blue balance since this has historically been a highly variable parameter. To provide some perspective of the sensitivity to this parameter, Figure 10 outlines the perceptibility of the human eye to these numeric values.
Sensitivity to Density Balance
Experts will see 0.01 difference Experienced will see 0.02 difference Everybody will see 0.04 difference Figure 10. Sensitivity to density balance
Due to the variability from frame to frame in balance, the standard sample size has been set at six for this product and the mean is used for comparison and evaluation against specifications.
3.4.2 Definition of Physical Evaluation
3.4.2.1 Chemical Gap
There are many different types of tests that are done to assess the physical performance of the film system. One important test that is mostly dependent on the reagent spreading performance is Chemical Gap. Several frames of negative are weighed for a baseline and
are compared to several frames of negative which have been processed (reagent spread and the sheet removed). This is an estimate of the total amount of reagent chemical that is spread in the film system.
3.4.2.2 Visual Inspection
Another physical test is more subjective. Pictures of a solid color are taken and visually inspected to detect any defects in the final image which could be a result of "mottle", uneven spreading. This is related to the rheology of the reagent. Another defect detected by this method is "pod wash" which is related to a settling out of some of the chemical components in the reagent.
Incomplete coverage is another defect related to developer spreading that is found by visual inspection. As the name indicates, the developer has not been spread completely and thus the image does not develop evenly across the frame.
Goo stick is a term for remnants of developer being left on the surface of the sheet and not coming away when the negative is peeled apart. This is an artifact of the entire film system but is heavily dependent on the spreading characteristics of the developer. 3.4.2.3 Pod Weight
Pod weight is an objective measurement of the weight of the pod alone. This might imply inconsistency in the developer batch but more likely would indicate a malfunction in the podding machine.
3.4.3 Definition of Rheology
The source of information for this section, which provides a simple introduction to rheology, is credited to Dan Churella of Polaroid Corporation from documents and training that he provided. Rheology is the science of the flow and deformation of matter. There are two types of deformation: reversible and irreversible. Reversible deformation is elastic (material returns to original shape when stress is removed) and irreversible deformation is inelastic or permanent stress deformation. The reagent material is viscoelastic which refers to a combination of both elastic and inelastic behavior.
Viscoelastic fluids are "liquid-like" at low frequency and "solid-like" at high frequency. For viscoelastic substances like reagent, an applied sinusoidal strain results in a
sinusoidal stress which is out of phase by 8 as depicted in Figure 11. Applied strain: y(t) = Yo* sin cot
Yo
Resulting stress: r(t) = -o * sin (ot + 8)
8
t00 < 8 < 900
Figure 11. Viscoelastic substances: Applied strain and resulting stress is out-of-phase by 6
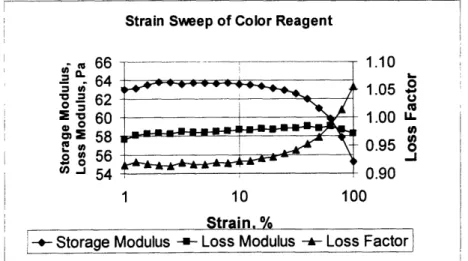
Figure 12 is a graph of the results from a dynamic rheological measurement called a strain sweep. The storage modulus, loss modulus and the loss factor are plotted against the logarithmic % strain from 1 to 100.
Strain Sweep of Color Reagent
c 66 1.10 S= 64 1.05 " 62 54 0.90 1 10 100 Strain, %
-- Storage Modulus -- Loss Modulus - Loss Factor
Storage Modulus: G' = stress / strain * cos 8
Represents the quantity of the strain energy reversibly stored in the material and recoverable. It characterizes the elastic behavior of the sample.
Loss Modulus: G" = stress / strain * sin 8
Represents the energy irreversibly given off by the material to the environment and thus lost. It characterizes the viscous behavior of the sample.
Loss Factor: tan 8 = G" / G'
Indicates the ratio between the amount of dissipated and stored energy and thus also between the viscous and elastic nature of the sample.
The storage modulus and the loss factor at 1% strain are the two parameters recorded and reviewed by engineers for batch release. Although customer specifications have not been developed for rheology, some correlation is known. If the storage modulus is too high, it correlates to a defect called mottle which is a result of the reagent not being spread smoothly.
3.5 Description of Existing Batch Process for Mixing Developer
(Reagent)
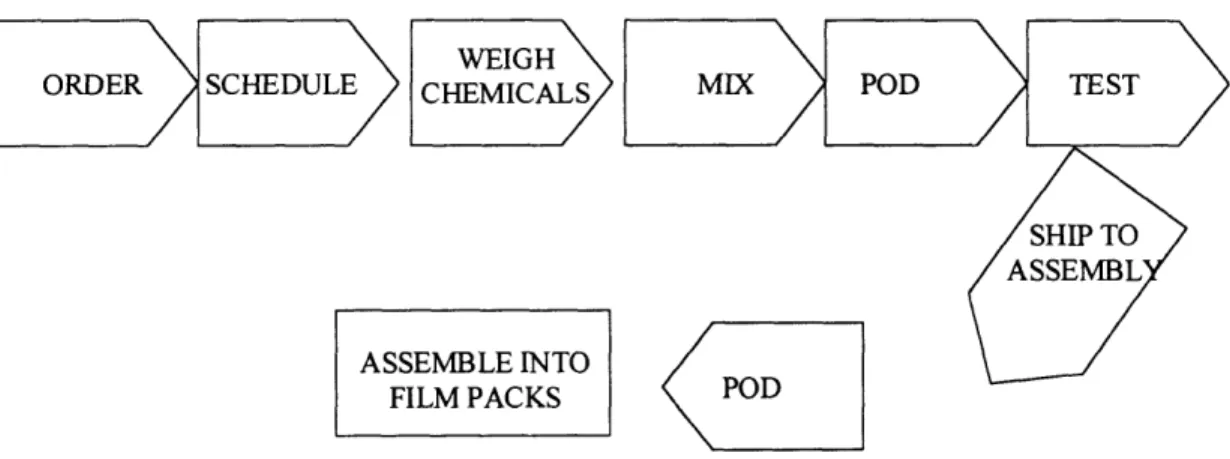
The process flow followed for manufacturing developer, once a recipe has been determined, is shown in Figure 13. Each step normally requires one day except for scheduling. The planner likes to have a one week lead time on orders. This step as well as many others are often rushed into a faster turn around to meet customer requests.
The first step is for the assembly planner to place an order for a set amount of a particular developer recipe with the reagent manufacturing planner. This order is scheduled for production and the first step by a process technician is to weigh out each of the chemicals in the recipe. This process is highly susceptible to error since it requires manual
handling of chemicals. Both liquid and hard to dissolve solid chemicals are weighed and added manually into the reactor. In some cases, very small quantities of a photosensitive chemical can have large effects.
The next step is to actually process the batch in a reactor, which requires about one shift to complete all mixing. Often the day after the batch is removed from the reactor, sample pods are made for testing. These pods are made on a pod machine that is located in the
Reagent Manufacturing area. Rheology and sensitivity testing are done and must be reviewed by the product engineer to determine whether the batch can be shipped to Assembly. Once in Assembly, the developer which resides in a large tank, is then podded and held until ready to be matched with the appropriate negative group for film
assembly.
WEIGH
ORDER SCHEDULE (CHEMICALS MIX POD TEST
SHIP TO ASSEMBL ASSEMBLE INTO
FILM PACKS POD
Figure 13. Process flow for developer manufacturing
As seen in Figure 14, the part of the process which has a highly variable cycle time is the developer recipe determination. The length of this process can vary significantly. Early in a product's life cycle this is a relatively long process. Elaborate experimental work must be completed to identify the developer recipe that brings the film system on target.
This is variable depending on whether the negative can be handled with the given pod library or if new design work must be completed. The driver of the long development time is related to the scaling up process. There is inconclusive data that suggests
different sensitometric results for the same ratio of chemicals used in a very small batch 34
and then scaled up for a large batch. The uncertainty in this scale up process causes additional batches to be processed, extensive testing to be completed before feeling confident, and risk associated with the first large scale batch processed.
Highly Variable Highly Predictable
Cycle Time Cycle Time
Negative
Testing cet i Order Schedul Make Test Ship Pod ~Assemble
Sheet
Figure 14. Variable and predictable cycle time portions of the process flow
In some cases the developer is being shipped internationally and thus the shipping adds significantly to the total cycle time of the film. The critical path of the cycle time for film production includes that shown in Figure 14. This means that if improvement could be made in any portion of this process, the impact would be in a shorter total cycle time for shipping film to the customer.
3.6 Motivation for Improvement: Cost, Cycle Time and Process Control
The newest color Technical and Industrial (T&I) film product has been in production for a few years although it is still undergoing design changes. It has faced difficulty in the field due particularly to the unpredictable performance under certain extreme
environmental conditions. The need to place good product into the marketplace in a timely manner has driven Polaroid to release negative into the developer compensation stage before it has sufficiently dried and stabilized in its photographic performance. As the negative properties continue to change, the developer needs also change. Thus the Reagent Manufacturing division, which supplies the developer, is faced with many changing requests and an increased need for flexibility.
There are several specific motivations for improvement of the current developer process. They fall into three main categories: cost, cycle time and process control. Outlined below is a summary of these issues that are based on the existing batch process.
Cost: The main cost driver is the number of batches produced. For the particular color product focused on in this thesis, the number of batches is related to the negative
variability and the number of negative groups designated. The recipe selection process requires a small batch for all "confirmation" runs. The requirement to make many batches results in high labor costs. The requirement to make small batches, results in poor yield and increased material costs. The gravity drip method for removing developer from the reactor results in a poorer percentage material yield for small batches than for large batches due to surface area. In addition, the need to make many different recipes, results in many development or test batches which again increase labor and material costs. Another small contributor to high costs is the inability to produce any amount desired. Since the reactor must be full in order to achieve proper mixing, the discrete reactor sizes result in discrete batch sizes and order quantities. This results in wasted material that is either "excess" developer or "excess" negative.
Cycle Time: The cycle time is long for the existing process. As shown in Figure 14, the cycle time can be broken into two sections, the recipe determination and the standard batch processing. Improvements in either section will result in improvements to the total cycle time for the production of instant color film. The variable aging process of the negative acts as a moving target for developer compensation efforts and thus presents a real challenge for cycle time improvements. But, if the developer compensation, and standard production process could be streamlined, it could be started only when the negative is stabilized and improve the efficiency of the overall process. The iterative process explained above for recipe determination, the lack of confidence in the accuracy in scaled up batches, and the attempt to adjust to a moving target exacerbates the cycle time problem.
Process Control: The capability of the current process to control the photosensitive chemicals is low because of the manual nature of the task and the difficulty in dissolving the chemicals. Since this is the key lever for control of the photographic performance of the film system, after the negative has been manufactured, it is very important for final film quality. Because of the borderline capability of the existing batch process, there is
4. Continuous Mixing for Improvement
The proposed solution to improve the cost, cycle time and process control of the existing batch process is to implement continuous mixing of developer at the assembly pod machine. This section will introduce the concept of continuous mixing, provide examples of how Polaroid is already using this technology, present alternatives for implementing continuous mixing and provide a detailed description of the merits and drawbacks of continuous mixing based on several functional requirements.
4.1 Description of Continuous Mixing
Continuous mixing is also referred to within Polaroid as blending and the terms will be used interchangeably throughout this thesis. The concept is to pump two or more streams of liquid through some type of mixing equipment at a certain rate with a homogenous substance being the final result. One example of mixing equipment would be a static mixer which consists of a line of pipe with many elements or fixed protrusions which cause turbulence and mixing of the material being forced through. Figure 15 shows a simple representation of a static mixer.
Lz~
zIz~
Figure 15. Simple representation of a static mixer
This type of process requires a stabilization period for full and steady flow rates to be achieved. Therefore, the initial material pumped through the system will be waste. After the flow has stabilized and particular ratios of flow rates are maintained, the final product will be a steady stream of a completely mixed substance which has the appropriate ratio of all streams being combined. In some cases, this method can be used when a chemical reaction is desired between the input sources. A more simple application is when no chemical reaction will occur and solely physical mixing is required.
There are limitations to the types of substances which can be successfully mixed using this method. The differences in viscosity and solubility are two examples of potential
limitations to successful mixing. For example, a challenging scenario would be to mix a highly viscous material with a water-like material. The particular pump selection, pipe size, static mixer choice, and controller method can be designed to meet the needs of a specific application. Other considerations are the input and output containers as well as the flow rate.
4.1.1 Continuous Mixing Applied to Color Developer
The most basic and simplified approach to using continuous mixing for color developer is to mix two batches that are almost identical. The only difference would be one chemical, such as the one mentioned before that is designed to manipulate the blue/yellow axis. Figure 16 shows the line between two source batches that have the same recipe except for the one chemical which strongly controls the blue balance. The X's are shown as
potential mix ratios but in actuality, any value along the line could be achieved by mixing. Source Batch 1 Magenta Blue Cyan Red Source Batch 2 Yellow Green
Figure 16. Color wheel with example of simple continuous mixing (source batch 1 & 2 mixed for any value on the line connecting the two)
A slightly more complicated use of continuous mixing for color developer would be to use three input streams from three source batches and manipulate two color axes. This example is shown in Figure 17 and now becomes a triangle of possible mixing options instead of a line.
Source
Batch 1 Blue
Magenta
Source
Mix region Batch 3
Cyan Red
Source Batch 2
Yellow Green
Figure 17. Three-way application of continuous mixing for color developer
4.2 Examples of Continuous Mixing at Polaroid
Polaroid has a long history of using continuous mixing or "in-line blending", as it is often referred to, in various capacities in negative and sheet manufacturing. This technology was considered in Reagent Manufacturing and pursued for black and white T&I products. For many years, Polaroid has also used a fairly complex continuous mixing system for the development of reagent.
4.2.1 Example of Continuous Mixing Equipment, Reagent Blend (RB)
A good example of continuous mixing equipment is the system referred to as the Reagent Blend or RB equipment which is located in Reagent Manufacturing in Waltham. The particular application that this equipment was designed for is mixing based on speed for black and white T&I developer. It has been used in production for a couple of years. Black and white developer is a good candidate for continuous mixing because it can be simplified into two input streams based on the photographic speed.
Figure 18, is a simple schematic of the RB equipment. As can be seen, it is designed to receive two input streams coming from large containers. The pumps were chosen
expecting similar viscosity substances at each input and a maximum of 10:90 ratio of flow rates. A PLC system is used to control the pump speeds based on flow rate read by magnetic flow meters. The system automatically switches the valves to waste or to an output container based on the stability and ratio of the flows. A PC based interface was developed for inputting the set points and for collecting process data as well as providing a visual status of the equipment while running. A static mixer is used to provide the mixing capability and the equipment was designed with the ability to add a third input source if desired. The RB system feeds into a large tank and is expected to operate at a total flow of four kilograms per minute.
REAGENT BLENDING SYSTEM
NITROGEN POD TANKT r NITROGEN TANK NITROGEN N &TANK
Figure 18. RB (Reagent Blend) equipment schematic
4.2.2 Example of Continuous Mixing Equipment, Development In-line Blend (ILB) The reagent development in-line blend system has been used at Polaroid for many years. This is a system that has assisted in the design and development of reagent and in testing new lots of chemicals. The ILB equipment is much more complex than the RB in that it has five major input streams and five small input streams (side streams). It also operates at much lower flow rates and feeds directly into a pod machine.
4.2.2.1 Reagent Design and Development
The system is capable of executing a complex design of experiments by injecting small amounts of five different side stream chemicals. A large factorial experiment is used to develop a model for future reagent design. This equipment is used by the Reagent Design group to design new developer recipes when a negative can not be compensated for with the existing pod library. The ILB hardware is shown in a simple schematic in Figure 19.
IN-LINE BLEND (ILB) SYSTEM
NITROGEN 7 POD' TANK N-/ K SC PT isc)! PT SC( PT -4-SC PT NITROGEN SYRINGE PUMP SYRINGE PUMP SYRINGEPUMP SYRINGE PUMP
Figure 19. ILB (In-line Blend) equipment schematic
4.2.2.2 Chemical Lot Checkout
Another use of the ILB is in comparing incoming inventory of raw materials to the old chemical lot. Many raw chemicals are purchased in large quantities for volume discounts as well as lot or batch consistency. Many months of production could be taken from one lot. To ensure no unpredicted change to the raw materials when a new lot is introduced to production, a process called "chemical lot checkout" is employed using the ILB. The old and new chemical lots are compared by mixing in a small amount to the base reagent via sidestreams or syringe pumps on the ILB. Using the ILB instead of the batch process greatly reduces the amount of developer that is used when doing a chemical lot checkout. 4.2.2.3 Pod Library Development, Instead of Scale Up
A third application of the ILB is in pod library development. Once design work has been completed to identify a set of recipes that are needed for production, usually the library is developed by ordering a 40 liter batch and then a 50 gallon batch. Instead, several
recipes of developer can be made by mixing at different ratios from two extreme endpoints. From these pods, testing can be done and a 50 gallon batch can be ordered, bypassing the 40 liter development batches. This application, although used
experimentally several times, was not the standard operating procedure for pod library development. As mentioned before, the main reason for not using this method is a lack of confidence in the sensitometrical scale-up to a large batch.
4.2.3.4 ILB Comparison to RB
The purpose and functionality of the RB equipment and the ILB equipment are different and this is outlined in Figure 20.
REAGENT BLEND (RB) IN-LINE BLEND (ILB)
Primary Purpose Production Development
Number of large streams Two Five
Total flow rate 4 kg/min 200 cc/min
Accuracy +/- 1% of total flow rate +/- 1% of total flow rate
Automation High Low
Control Method PID with a magnetic flow PID with a magnetic flow meter, adjusting pump meter, adjusting pump
speed speed
Developer (Reagent) Black and white only Color and black and white Figure 20. Comparison of blending equipment capabilities
4.3 Evaluation of Continuous Mixing as Developer Manufacturing
Process
This section evaluates and compares the option of continuous mixing to the existing batch process. The three main areas that are discussed are quality, cost and time, each having subcategories which are shown in Figure 21.
QUALITY COST TIME
Homogeneity Rate Flexibility: Different
Sensitometry Waste reagent types
Spreading Properties Reactor yield Responsiveness Temperature Insensitivity Pod tank / drum yield Different recipes Repeatability Susceptibility to mistakes Different chemical
Test runs movers
Order by the kilogram Cycle time for recipe Make by the kilogram determination
Investment Cycle time from recipe Efficiency (batch size) determination to
Labor production in assembly
Reactor usage
Scheduling time/labor Inventory; mgt. of invent.
4.3.1 Quality of Continuous Mixing
4.3.1.1 Homogeneity
The quality of the developer is certainly a top priority for Polaroid. Homogeneity is a concern for the quality of the developer made by continuos mixing. With continuous mixing, a time dependence is introduced that was not there with the batch process. The mixing that takes place in the reactors is extensive although very little mixing occurs from top to bottom. With the continuous mixing process, it is not expected that the homogeneity of the reagent would change.
4.3.1.2 Sensitometry
The continuous mixing process is expected to allow better control of the sensitometry than the batch process. The batch-to-batch variation can be reduced just by mixing two batches of the same recipe. The averaging effect will reduce the breadth of the
distribution. In addition, the source batches can be measured and their sensitometry can be taken into account when determining flow ratios. In the RB equipment for example, the flow ratio is automatically controlled by a feedback loop between the flow meters and the pump speeds. If the ratio of the two flows varies by more than a certain setpoint, then the equipment automatically switches to a purge tank and back again once stabilized. In contrast, the batch process is dependent on the manual addition of very small quantities of potent chemicals. These must be handled several times for weighing, dissolving and adding to the reactor which creates opportunities for error.
4.3.1.3 Spreading Properties
Spreading properties are another quality metric for developer which effects the total film performance. The rheology of the developer is effected by the amount of mixing and shearing that takes place. Continuous mixing equipment should be designed in a way that does not have a detrimental effect on the rheology.
4.3.1.4 Repeatability
Repeatability is a quality metric that is believed to be greatly improved by continuous mixing. The most focus is placed on the repeatability of the sensitometry. The batch
process is subject to a large amount of variation due to the manual nature, the length of time over which it takes to process and the lack of automated controls. Although continuously mixed developer will originate from the batch process, there will be more repeatable performance from the developer by making larger batches and mixing repeatedly.
4.3.2 Cost of Continuous Mixing
4.3.2.1 Rate
The rate of continuous mixing depends on the application of this method. If something like the RB equipment is being used and the final mixed developer resides in a tank, a fast rate can be achieved and a large amount of developer can be mixed in a fraction of the time it takes to make a batch. On the other hand, the concept of continuous mixing at the pod machine, a design like the ILB, requires the encapsulation of the developer immediately which limits the rate to about 20 times slower than the RB. An important point to note though is that this activity will occur regardless of whether the mixing is happening at the same time or not. In effect, the rate becomes an irrelevant or embedded factor for mixing at the pod machine.
4.3.2.2 Waste
There are many sources of waste in developer manufacturing and assembly. Continuous mixing should be able to address some of these, such as susceptibility to mistakes, and ordering by the kilogram (being able to match the amount needed for a particular negative group size). It is expected that the waste due to changing from one recipe to another in assembly at the pod machines is significant for the international sites. Continuous mixing at the pod machine will address that problem by merely needing to flush the system after setting a new flow ratio for a new recipe.
4.3.2.3 Investment
A significant capital investment was made several years ago for the RB equipment currently being underutilized. The main drivers for the high cost were systems
integration and software development. This system was design in-house and the software and controls portion was subcontracted to a local vendor.
On the other hand, the Vale of Leven in Scotland made a very modest investment in a simple, two stream version of the ILB equipment that could be used in assembly at a pod machine. This equipment was also designed in house but did not include any extensive
software or automated controls. At the start of this project, the equipment was not being used for production.
A cost analysis and exploration of design options was done to identify an appropriate investment range for new continuous mixing equipment and is presented in the final section.
4.3.2.4 Efficiency
Efficiency is another area where continuous mixing should be able to provide significant benefit. By utilizing continuous mixing, theoretically fewer large batches can be made which drastically reduces the labor, testing, scheduling and inventory management that is associated with each batch.
4.3.3 Time for Continuous Mixing
4.3.3.1 Flexibility
Flexibility refers to the ability to use the equipment for a different color product. This could be important for use in the future with new products that use a different developer design. It also could be considered retroactively for use with older products if it were deemed feasible to mix them successfully.
4.3.3.2 Responsiveness: Different developer recipes
The requirement responsiveness has many elements to it. One aspect is the time required to produce a different developer recipe. This could be as simple as changing the flow ratio and the waste incurred could be a function of the piping length and flow rates. This would be particularly true in the ILB type design. On the other hand, running a new