HAL Id: hal-00298740
https://hal.archives-ouvertes.fr/hal-00298740
Submitted on 24 Jul 2006HAL is a multi-disciplinary open access
archive for the deposit and dissemination of sci-entific research documents, whether they are pub-lished or not. The documents may come from teaching and research institutions in France or abroad, or from public or private research centers.
L’archive ouverte pluridisciplinaire HAL, est destinée au dépôt et à la diffusion de documents scientifiques de niveau recherche, publiés ou non, émanant des établissements d’enseignement et de recherche français ou étrangers, des laboratoires publics ou privés.
Estimation of flooded area in the Bahr El-Jebel basin
using remote sensing techniques
M. A. H. Shamseddin, T. Hata, A. Tada, M. A. Bashir, T. Tanakamaru
To cite this version:
M. A. H. Shamseddin, T. Hata, A. Tada, M. A. Bashir, T. Tanakamaru. Estimation of flooded area in the Bahr El-Jebel basin using remote sensing techniques. Hydrology and Earth System Sciences Discussions, European Geosciences Union, 2006, 3 (4), pp.1851-1877. �hal-00298740�
HESSD
3, 1851–1877, 2006 Estimation of Bahr-El-Jebel flood area by remote sensing M. A. H. Shamseddin et al. Title Page Abstract Introduction Conclusions References Tables Figures J I J I Back CloseFull Screen / Esc Hydrol. Earth Syst. Sci. Discuss., 3, 1851–1877, 2006
www.hydrol-earth-syst-sci-discuss.net/3/1851/2006/ © Author(s) 2006. This work is licensed
under a Creative Commons License.
Hydrology and Earth System Sciences Discussions
Papers published in Hydrology and Earth System Sciences Discussions are under open-access review for the journal Hydrology and Earth System Sciences
Estimation of flooded area in the Bahr
El-Jebel basin using remote sensing
techniques
M. A. H. Shamseddin1, T. Hata2, A. Tada3, M. A. Bashir2, and T. Tanakamaru2
1
Water Management and irrigation institute, University of Gezira, P.O. Box 20, Wad Medani, Sudan
2
Dept. of Food Systems and Field Sciences, Graduate School of Science and Technology, Kobe University, Nada, Kobe 657-8501, Japan
3
Faculty of Agriculture, Kobe University, Japan
Received: 26 April 2006 – Accepted: 22 May 2006 – Published: 24 July 2006 Correspondence to: M. A. Bashir ([email protected])
HESSD
3, 1851–1877, 2006 Estimation of Bahr-El-Jebel flood area by remote sensing M. A. H. Shamseddin et al. Title Page Abstract Introduction Conclusions References Tables Figures J I J I Back CloseFull Screen / Esc
Printer-friendly Version Interactive Discussion Abstract
In spite of the importance of Sudd (swamp) area estimation for any hydrological project in the southern Sudan, yet, no abroad agreement on its size, due to the inaccessibil-ity and civil war. In this study, remote sensing techniques are used to estimate the Bahr El-Jebel flooded area. MODIS-Terra (Moderate Resolution Imaging Spectrora-5
diometer) level 1B satellite images are analyzed on basis of the unsupervised classifi-cation method. The annual mean of Bahr El-Jebel flooded area has been estimated at 20 400 km2, which is 96% of Sutcliffe and Park (1999) estimation on basis of water bal-ance model prediction. And only, 53% of SEBAL (Surface Energy Balbal-ance Algorithm for Land) model estimation. The accuracy of the classification is 71%. The study also 10
found the swelling and shrinkage pattern of Sudd area throughout the year is following the trends of Lake Victoria outflow patterns. The study has used two evaporation meth-ods (open water evaporation and SEBAL model) to estimate the annual storage volume of Bahr El-Jebel River by using a water balance model. Also the storage changes due time is generated throughout the study years.
15
1 Introduction
Wetlands are a basic pillar for the earth ecosystem. However, wetlands subject to large variations, seasonally and annually (Travaglia et al., 1996). Flood protection, fisheries, groundwater recharge, moisture recycling, grazing and biodiversity are some of the main advantages of the wetlands. Moreover, wetlands are gets concerns also on 20
environmental studies, as it considered as a Methane gas source (Yoshiki, 1999). On the other hand, in term of evaporation process to atmosphere, wetlands may consider as wasting water source.
The swamp area in Southern Sudan is one of the largest wetlands in Africa (Shahin, 2002). Half of the White Nile water is lost in Bahr El-Jebel Swamp or Sudd areas 25
HESSD
3, 1851–1877, 2006 Estimation of Bahr-El-Jebel flood area by remote sensing M. A. H. Shamseddin et al. Title Page Abstract Introduction Conclusions References Tables Figures J I J I Back CloseFull Screen / Esc 1996; Sutcliffe et al., 1999; Waterbury, 2002; Mohamed, 2005). Sutcliffe and Park
(1999) have quoted the Newhouse (1929) description for Sudd area as “not a reservoir, where water stored, but a sink, where water wasted”. Also the swamp considered as a barrier or dam blocking the flow (Shahin, 2002). The recent shortfalls in Ethiopia (Blue Nile) and the population increase made the swamp area in southern Sudan under 5
focus (Howell et al., 1996). It goes without saying that, swampy area reclamation is considered as a potential water resource of Sudan and Egypt, about 6.0 milliard cubic meters of water will be saved for Sudan from the swampy area reclamation (Eldaw, 2003). Jonglei canal is one of the projects that aimed to reduce water losses in Sudd area (Sutcliffe et al., 1999; Howell et al., 1996; Waterbury, 2002; Mohamed, 2005). The 10
onset of civil war, however, stopped the completion of the canal construction; moreover, yet, the environmental impacts of Jonglei canal construction are controversial issues (Mohamed et al., 2005; Waterbury, 2002; Howell et al., 1996).
Many studies about the swampy areas evaporation amount have carried out (An-nex 1) (Sutcliffe et al., 1999; Mohammed et al., 2005), which were resulted in a confus-15
ing or a contradictory result. Hitherto, no broad agreement on evaporation estimation is reached. The fact may extract, however, from these evaporation estimation stud-ies is that many discrepancstud-ies were found on the swampy areas estimation and/or delineation. It goes without saying that, many techniques were used for swamp area estimation (see Mohamed et al., 2005; Sutcliffe et al., 1999; Travaglia et al., 1996). 20
The difficulties of swamp area estimation might be due to the inaccessibility of the area, the vast areas of swamp, and the complexity of the dynamic behavior of the swamp throughout the year (permanents and seasonal flooded areas), and the civil war that raged out as well. On the other hand, revising the literature of Africa’s conti-nent wetland estimation shows the estimation of African’s conticonti-nent wetlands still in an 25
infancy stage, (seehttp://www.fao.org/documents/), and the world’s wetland as well. The swamp area estimation is so important from hydrological, fishery, agricultural,
HESSD
3, 1851–1877, 2006 Estimation of Bahr-El-Jebel flood area by remote sensing M. A. H. Shamseddin et al. Title Page Abstract Introduction Conclusions References Tables Figures J I J I Back CloseFull Screen / Esc
Printer-friendly Version Interactive Discussion drological regime and the distribution of the vegetation of the flood plain are the key
point for any future development projects in the Southern Sudan region. Such under-standing now days can be achieved more easily, through using remote sensing and GIS techniques, especially nowadays, satellite sensors are advanced tremendously and can provides huge amounts of time series data, and free of charges as well. In 5
terms of Sudd water balance model, Sutcliffe and Park (1999) have mentioned that us-ing further satellite imagery will refine their models of the Sudd water balance (Sutcliffe et al., 1999).
This paper aimed to better understanding of the dynamic behaviors of Sudd areas throughout the year, to estimate the Sudd area, through using remote sensing tech-10
niques. Also the paper aimed to re-calculate the water balance model of the Sudd areas on the basis of time series satellite imagery analysis results.
2 Study area literature
The study area is located at the southern Sudan. The previous studies (Mohamed, 2005; Sutcliffe et al., 1999) have divided the area into three distinctive basins, Bahr 15
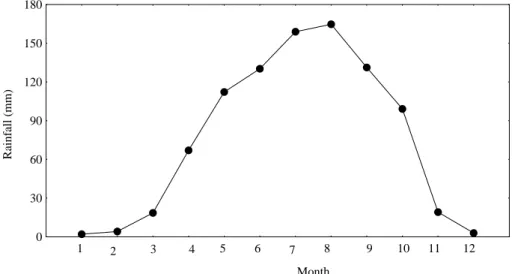
El-Jebel, Bahr Al Ghazal and the Sobat basin (Fig. 1). Meanwhile, the area between Bahr El-Jebel and Ghazal is questionable (Mohamed, 2005). In terms of topography, the area can be divided into three categories, the high lands (free flooded), the inter-mediate land (seasonally flooded), and the permanent swamp (always under water) (Howell, 1996). Table 1 shows the area normal annual means (1970–2000) of some 20
selected climatic elements (means of Juba, Wau and Malakal stations). Figure 2 shows the area monthly rainfall normal mean (on the basis of Juba, Wau and Malakal stations normal mean). It is obvious that the peak of the rainfall is in August, whereas, the dry period extends from November to March.
Away of the swamp and wetland definitions complexity, the word “swamp” in this 25
study refers to the three basins (above mentioned) swamps, whereas the word “Sudd” denote to Bahr El-Jebel swamp, only. Bahr El-Jebel River, which originates from Lake
HESSD
3, 1851–1877, 2006 Estimation of Bahr-El-Jebel flood area by remote sensing M. A. H. Shamseddin et al. Title Page Abstract Introduction Conclusions References Tables Figures J I J I Back CloseFull Screen / Esc Victoria, is the most complex of the Nile reaches because of the torrents during the
rainy season (Sutcliffe et al., 1999). About half of the White Nile River flow is lost in the Sudd area, because of evaporation. Table 2 shows the previous evaporation estimation of Sudd area. Howell (1996) stated that 88% increase of Bahr El-Jebel river flows resulted, only in a 50% increase in the White Nile outflows; coupled with a 5
130% increase in Sudd area (Howell et al., 1996). And due to this appreciated losses Jonglei canal has been proposed. Actually two third of the canal (260 km) has been accomplished, and due to civil war onset it has stopped (Howell, 1996; Waterbury, 2002).
This study concerns on Bahr El-Jebel river swamp area (6.5◦, 9.62◦N and 29.22◦, 10
32.0◦E) that located downstream of Mongalla where the river is a single channel with low stage (Shahin, 2002), up to the confluence of the White Nile with the Sobat river at Malakal town, where the White Nile outflows is measured. The slope is generally very flat (Mohamed et al., 2005), the soil has developed on recent alluvium, with a high bulk density and impermeability (Howell et al., 1996).
15
Due to the less channel capacities and the high flows, the excess flows of Bahr El-Jebel river leave through small channels and inundated large areas on both sides of the river and created the swamp. During the rainy season, the torrents have a contri-bution in swamp area extension as well. However the outflows of Victoria Lake provide the available power of Sudd extension (Tate, 2004; Sutcliffe, 1999). The swamp has 20
a vital role in the southern Sudan economy (i.e. grazing, fishery, etc.), hence any up-stream water constructions (i.e. storage) should consider the impacts of these projects at downstream level (i.e. swamp).
3 Materials and methods
HESSD
3, 1851–1877, 2006 Estimation of Bahr-El-Jebel flood area by remote sensing M. A. H. Shamseddin et al. Title Page Abstract Introduction Conclusions References Tables Figures J I J I Back CloseFull Screen / Esc
Printer-friendly Version Interactive Discussion 2005 (Appendix B), with a consideration of avoiding the cloud contamination. The
En-vironment for Visualizing Images processing system (ENVI 4.2) has used to extract, visualize and analysis the images. The images were georeferenced on basis of UTM projection and WGS-84 datum. A subset via region of interest (ROI) and layer stacking process was conducted. Due to lack of more ground truth data, the Isodata unsu-5
pervised classification techniques was used. The Isodata unsupervised classification calculates class means evenly distributed in the data space and then iteratively clus-ter the remaining pixels using minimum distance methods. To declus-termine the suitable classes’ number, a simple matrix error method was used. Four levels of verification were carried out for the study’s resulted images, which were, The NDVI values (us-10
ing the red and infrared MODIS bands (Appendix C)), the vegetation map for Jonglei area (1983), which provided by Howell (2002), Landsat ETM+ image with 30 m reso-lution for Sudd area (downloaded from Global Land Cover Facilities website, GLCF), and MODIS natural color images (bands 1, 4, 3), and bands 3, 6, 7 combination (see http://rapidfire.sci.gsfc.nasa.gov). The ENVI 4.2 change detection statistics method 15
was used to compile a detailed tabulation of changes between the resulted classifica-tion images on basis of initial and final states (two consecutively images.
Sutcliffe and Parks (1999) hydrological model for Sudd area was used to calculate the monthly storage changes, and monthly Bahr El-Jebel basin water balance:
∂V = {Q − q + A (R − E)} ∂t − r∂A (1)
20
Vi+1= Vi + Qi − qi− kVi(Ei − Ri) − kri(Vi+1− Vi) (2) Where V is volume of flooding, Q is inflow, q is outflow, R is rainfall, E is evaporation,
A is flooded area, and r is soil moisture recharge. For the initial storage volume, the
study assumed one meter depth. A comparison was made between the study water balance results and Sutcliffe and Park (1999) water balance results.
HESSD
3, 1851–1877, 2006 Estimation of Bahr-El-Jebel flood area by remote sensing M. A. H. Shamseddin et al. Title Page Abstract Introduction Conclusions References Tables Figures J I J I Back CloseFull Screen / Esc
4 Results and discussions
4.1 Sudd flooded area
According to the Lake Victoria water level, the previous studies have differentiated between two distinctive periods, before and after 1964, when the Lake Victoria has risen (Tate et al., 2004; Sutcliffe, 1999; Howell et al., 1996). Due to that raised the 5
Sudd area has trebled (Sutcliffe, 1999). However, after 1970 the estimated areas of flooding decrease fairly steadily (Shahin, 2002).
Table 3 shows the resulted monthly variations of Sudd area (Appendix D). The ratios between the study annual Sudd areas mean, the Sutcliffe’s and Park (water balance model prediction) and Mohamed’s (SEBAL) were 0.96 and 0.53, respectively. It’s obvi-10
ous that there is agreement between our results and Sutcliffe’s results. From Table 3, March, May, September and November monthly average area looks questionable, as its run out of the averages of the pre and post months. However, a quick glance to Table 4 shows that the trends of these months are coincide with the trends of the Lake Victoria average monthly outflows, which control the area of permanent swamp in the 15
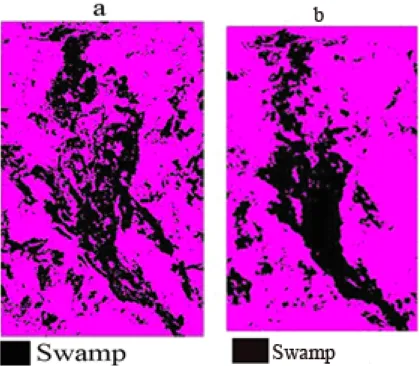
Sudd (Tate et al., 2004). It is worth mentioning here that the outflows from the Lake Victoria after the period of 1997–1998 show a decreased trend (Tate et al., 2004). The simple matrix error resulted in 71% classification accuracy. Figures 3a and b show examples of the resulted study classification images.
Figure 4 shows a comparison between Travaglia et al. (1996) Sudd wetlands area 20
(on the basis of AVHRR images, thermal inertia approach) and the results about Sudd flooded area for some selected months. As Travaglia area is wetland and the study area is flooded area, it is accepted that Travaglia results are higher than the study; however, the pattern is same, except in March.
HESSD
3, 1851–1877, 2006 Estimation of Bahr-El-Jebel flood area by remote sensing M. A. H. Shamseddin et al. Title Page Abstract Introduction Conclusions References Tables Figures J I J I Back CloseFull Screen / Esc
Printer-friendly Version Interactive Discussion 4.2 Sudd water balance
The study used two evaporation estimation methods to calculate the mean monthly Sudd ∂V/∂t . The first is Sutcliffe and Park open water evaporation (mean 1941–1970), and the second is SEBAL model evaporation estimation. The inflows and outflows inputs were extracted from Sutcliffe and Park (1999), (mean 1961–1983); the rainfall 5
input is the normal mean of the period 1970–2000. In both scenarios the area (A) input was the study Sudd flooded area results. Figure 5 shows the results of the two scenarios. It’s clear that from July to September there is agreement between the open water evaporation and SEBAL results, with a relative complete coincidence in August. However, in December, January, February, April, and May Sutcliffe results were more 10
close to the study open water evaporation method scenario. March and November months show the biggest differences between the three results (beginning and end of the rainfall period, respectively). In Fig. 5, the key term “Sutcliffe” refers to the storage changes that calculated by Sutcliffe and Park, on basis of open water evaporation (source Mohamed, 2005).
15
According to Fig. 6, it’s clear that there is abroad agreement between the study (open water evaporation scenario) and Sutcliffe and Park mean monthly storage volume, with a relative high difference in October, November and December. However, SEBAL sce-nario storage volume shows differences in April, June, October and December. On basis of open water evaporation and SEBAL model evaporation estimation, the mean 20
annual storage volume were 23.0 and 21.7 (Gm3), respectively. The both results were over than Sutcliffe and Park results on basis of open water evaporation (21.1 Gm3).
Figures 7 and 8 show comparisons between the mean monthly storage volumes of the Study and Sutcliffe and Park, for the years 2002 and 2004, respectively. The year 2002 shows a higher storage volume for all months, relatively to Sutcliffe and Park 25
storage volume, however, the opposite holds true for the year 2004, except in the last three months.
HESSD
3, 1851–1877, 2006 Estimation of Bahr-El-Jebel flood area by remote sensing M. A. H. Shamseddin et al. Title Page Abstract Introduction Conclusions References Tables Figures J I J I Back CloseFull Screen / Esc
5 Conclusions and recommendations
Remote sensing techniques were used to estimate the swamp (Sudd) area. The tech-niques is considered as the most effective method for swamp area estimation or/and delineation; however, cloud contamination is the main obstacle.
The study found that the annual mean Sudd flooded area is 20 400 km2, which is 5
96% of Sutcliffe and Park estimation (1999), and 53% of Mohamed (2005) estimation. However, the swelling and shrinkage of Sudd area is following the trend of Lake Victoria outflow patterns. The annual storage change using open water evaporation estimation shows a coincidence in some months, however, using SEBAL model evaporation esti-mation shows also a coincidence in some months (especially at the peak of the rainfall 10
period).
Using the open water evaporation estimation with the Sudd flooded area (that re-sulted from the study) in the Sudd water balance model for calculating the annual storage volume produced 23.0 (Gm3), while the SEBAL model produced 21.7 (Gm3). Both results are higher than the Sutcliffe and Park annual storage volume mean (21.1 15
Gm3).
The link between the Sudd hydrology and vegetation study is recommended using remote sensing with fine resolution. Instead of assuming a linear relation between the Sudd area and storage volume a detailed study is required.
Acknowledgements. The research upon which this paper is based was supported in part by
20
the Grants-in-Aid (No.16405031) for Scientific Research from the Japan Society for the Promo-tion of Science (JSPS). The research was also supported in part by JSPS AA Science Platform Program. The data used in the study were acquired as part of the NASA’s Earth-Sun System Division and archived and distributed by the Goddard Earth Sciences (GES) Data and Informa-tion Services Center (DISC) Distributed Active Archive Center (DAAC). The authors also are
25
HESSD
3, 1851–1877, 2006 Estimation of Bahr-El-Jebel flood area by remote sensing M. A. H. Shamseddin et al. Title Page Abstract Introduction Conclusions References Tables Figures J I J I Back CloseFull Screen / Esc
Printer-friendly Version Interactive Discussion References
Abdelhadi, A. W., Bashir, M. A., Farah, S. M., and Hata, T.: Implications of late sown irrigated grain sorghum on productivity and water management, Sudan J. Agric. Res., 6, 1–10, 2006. Eldaw, A. K.: Sudan water Resources: Challenge and future perspectives, Water harvesting and Future of development in Sudan, conference, Friendship Hall, Khartoum, Sudan, 2003.
5
ENVI user’s Guide : ENVI version 4.0, September Edition, Research System Inc. (RSI), 2003. Howell, P. P. and Allan, J. A.: The Nile, sharing a scarce resource, An historical and
techni-cal review of water management and of economitechni-cal and legal issues: Howell & M. Lock: The control of the swamps of the southern Sudan: Drainage Schemes, local effects and environmental constraints on remedial development, 243–279, Cambridge University Press,
10
1996.
Mohamed, Y. A.: The Nile Hydroclimatology: Impact of the Sudd Wetland. PhD Dissertation, Delft University of Technology, Netherland, 2005.
Mohamed, Y. A., Saveniji, H. H. G., Bastiaanssen, W. G. M., and Van den Hurk, B. J. J. M.: New Lessons on the Sudd hydrology learned from remote sensing and climate modeling,
15
Hydrol. Earth Syst. Sci. Discuss., 2, 1503–1535, 2005.
Mohamed, Y. A., Van den Hurk, B. J. J. M., Saveniji, H. H. G., and Bastiaanssen,, W. G. M.: Impact of the Sudd wetland on the Nile hydroclimatology, Water Resour. Res., 41, W08420, 2005.
Shahin, M.: Hydrology and Water Resources of Africa, Water Science and Technology Library,
20
Kluwer Academic Publishers, Dordrecht/ Boston/ London, 2002.
Sutcliffe, J. and Parks, Y. P.: The Hydrology of the Nile, IAHS Special Publication no. 5, IAHS Press, Institute of Hydrology, Wallingford, Oxfordshire OX10 8BB, UK, p. 33, and 57–87, 1999.
Tate, E., Sutcliffe, J., Declan, C., and Farquharson, F.: Water Balance of Lake Victoria: Update
25
to 2000 and Climate change Modeling to 2100, Hydrol. Sci. J., 49(4), 563–574, 2004. Travaglia, C., Kapetsky, J. M., and Righini, G.: A Methodology for Monitoring Wetlands for
Fisheries Using NOAA AVHRR LAC Thermal Data, 1996.
Waterbury, J.: The Nile Basin, National Determinants of Collective Action, Yale University Press, New Haven and London, 139–149, 2002.
30
Yamagata, Y.: Advanced remote sensing Techniques for monitoring Complex Ecosystems: Spectral Indices, Unmixing, and Classification of wetlands, Research Report from the
Na-HESSD
3, 1851–1877, 2006 Estimation of Bahr-El-Jebel flood area by remote sensing M. A. H. Shamseddin et al. Title Page Abstract Introduction Conclusions References Tables Figures J I J I Back CloseFull Screen / Esc
HESSD
3, 1851–1877, 2006 Estimation of Bahr-El-Jebel flood area by remote sensing M. A. H. Shamseddin et al. Title Page Abstract Introduction Conclusions References Tables Figures J I J I Back CloseFull Screen / Esc
Printer-friendly Version Interactive Discussion
Table 1. The Sudd normal means of some selected climatic elements.
Temperature (◦C) Relative humidity (%) Sunshine (%) Piche evaporation (mm)
28.0 55 62 8.03
HESSD
3, 1851–1877, 2006 Estimation of Bahr-El-Jebel flood area by remote sensing M. A. H. Shamseddin et al. Title Page Abstract Introduction Conclusions References Tables Figures J I J I Back CloseFull Screen / Esc
Table 2. Evaporation amount estimation in Sudd area.
sources Evaporation mm/yr Butcher (1938) 1533 Mojahid (1948) 2400 Suctcliff (1999) 2150 Mohamed (2005) 1636 Source: Mohamed (2005)
HESSD
3, 1851–1877, 2006 Estimation of Bahr-El-Jebel flood area by remote sensing M. A. H. Shamseddin et al. Title Page Abstract Introduction Conclusions References Tables Figures J I J I Back CloseFull Screen / Esc
Printer-friendly Version Interactive Discussion
Table 3. Monthly mean Sudd area (1000 km2) for the period 2001–2005.
Month Jan Feb Marrch April May June July Aug Sep Oct Nov Dec Average Area 20.9 18.9 21.5 17.1 22.6 18.0 21.5 25.0 18.0 24.7 15.6 20.4 20.4
HESSD
3, 1851–1877, 2006 Estimation of Bahr-El-Jebel flood area by remote sensing M. A. H. Shamseddin et al. Title Page Abstract Introduction Conclusions References Tables Figures J I J I Back CloseFull Screen / Esc
Table 4. Monthly mean Lake Victoria outflows (106m3) for the period 1961–1990.
Month Jan Feb March April May June July Aug Sep Oct Nov Dec Average Outflow 3056 2811 3146 3099 3331 3276 3314 3242 3073 3120 2955 3073 37497
HESSD
3, 1851–1877, 2006 Estimation of Bahr-El-Jebel flood area by remote sensing M. A. H. Shamseddin et al. Title Page Abstract Introduction Conclusions References Tables Figures J I J I Back CloseFull Screen / Esc
Printer-friendly Version Interactive Discussion
Table A1. The previous evaporation studies for Sudd area.
Sources Average Sudd area (Gm2) Evaporation mm/yr Method
Butcher (1938) 7.2 1533 Papyrus in water tank,
a real photo, and water balance
Hurst and Black 8.3 – –
Mijahid (1948) – 2400 Lysimeter
Sutcliffe and Park (1999) 21.1 2150 Penman formula and Water balance
Yasir (2005) 38.0 1636 Remote sensing and SEBAL
HESSD
3, 1851–1877, 2006 Estimation of Bahr-El-Jebel flood area by remote sensing M. A. H. Shamseddin et al. Title Page Abstract Introduction Conclusions References Tables Figures J I J I Back CloseFull Screen / Esc
Table B1. List of MODIS images acquisition dates (Julian day).
2001 2002 2003 2004 2005 25 26 11 9 4 36 46 42 36 41 46 67 90 55 61 84 84 127 80 130 146 99 255 103 313 129 292 110 331 163 330 126 345 241 342 297 272 362 318 346 327 361
HESSD
3, 1851–1877, 2006 Estimation of Bahr-El-Jebel flood area by remote sensing M. A. H. Shamseddin et al. Title Page Abstract Introduction Conclusions References Tables Figures J I J I Back CloseFull Screen / Esc
Printer-friendly Version Interactive Discussion
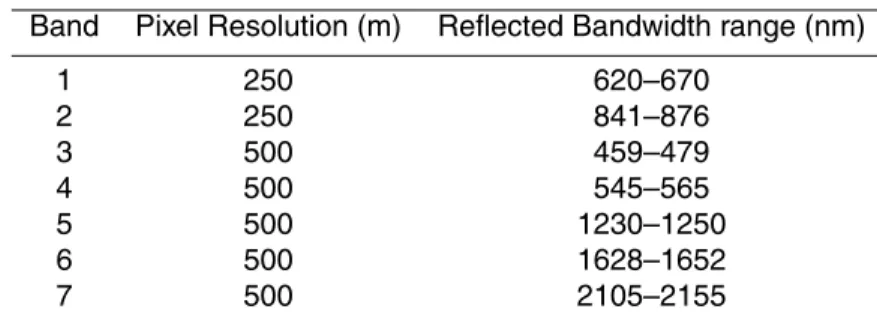
Table C1. List of MODIS bands used.
Band Pixel Resolution (m) Reflected Bandwidth range (nm)
1 250 620–670 2 250 841–876 3 500 459–479 4 500 545–565 5 500 1230–1250 6 500 1628–1652 7 500 2105–2155 Source:http://synergyx.tacc.utexas.edu/DataUsersGuide/MODISbands.html
HESSD
3, 1851–1877, 2006 Estimation of Bahr-El-Jebel flood area by remote sensing M. A. H. Shamseddin et al. Title Page Abstract Introduction Conclusions References Tables Figures J I J I Back CloseFull Screen / Esc
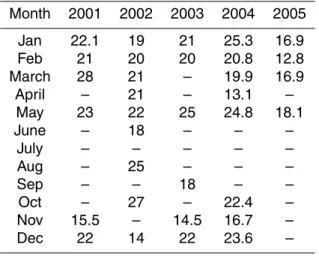
Table D1. Variation of monthly Sudd area.
Month 2001 2002 2003 2004 2005 Jan 22.1 19 21 25.3 16.9 Feb 21 20 20 20.8 12.8 March 28 21 – 19.9 16.9 April – 21 – 13.1 – May 23 22 25 24.8 18.1 June – 18 – – – July – – – – – Aug – 25 – – – Sep – – 18 – – Oct – 27 – 22.4 – Nov 15.5 – 14.5 16.7 – Dec 22 14 22 23.6 –
HESSD
3, 1851–1877, 2006 Estimation of Bahr-El-Jebel flood area by remote sensing M. A. H. Shamseddin et al. Title Page Abstract Introduction Conclusions References Tables Figures J I J I Back CloseFull Screen / Esc
Printer-friendly Version Interactive Discussion
HESSD
3, 1851–1877, 2006 Estimation of Bahr-El-Jebel flood area by remote sensing M. A. H. Shamseddin et al. Title Page Abstract Introduction Conclusions References Tables Figures J I J I Back CloseFull Screen / Esc 0 30 60 90 120 150 180 Month Rainfall (mm) 1 2 3 4 5 6 7 8 9 10 11 12
HESSD
3, 1851–1877, 2006 Estimation of Bahr-El-Jebel flood area by remote sensing M. A. H. Shamseddin et al. Title Page Abstract Introduction Conclusions References Tables Figures J I J I Back CloseFull Screen / Esc
Printer-friendly Version Interactive Discussion
HESSD
3, 1851–1877, 2006 Estimation of Bahr-El-Jebel flood area by remote sensing M. A. H. Shamseddin et al. Title Page Abstract Introduction Conclusions References Tables Figures J I J I Back CloseFull Screen / Esc 0 10 20 30 40 50 Month Area (1000 km 2 )
Jan Mar Apr Sep Dec
Study Travaglia
Fig. 4. A comparison between Sudd wetland area (Travaglia et al., 1996), and Sudd flooded
HESSD
3, 1851–1877, 2006 Estimation of Bahr-El-Jebel flood area by remote sensing M. A. H. Shamseddin et al. Title Page Abstract Introduction Conclusions References Tables Figures J I J I Back CloseFull Screen / Esc
Printer-friendly Version Interactive Discussion −2 0 2 4 Month Storage changes 1 2 3 4 5 6 7 8 9 10 11 12 Study Sutcliffe SEBAL
HESSD
3, 1851–1877, 2006 Estimation of Bahr-El-Jebel flood area by remote sensing M. A. H. Shamseddin et al. Title Page Abstract Introduction Conclusions References Tables Figures J I J I Back CloseFull Screen / Esc 0 7 14 21 28 35 Month Storage volume (Gm 3 ) 1 2 3 4 5 6 7 8 9 10 11 12 Study Sutcliffe SEBAL
Fig. 6. A comparison between the study, Sutcliffe and SEBAL model storage volume (V) for
HESSD
3, 1851–1877, 2006 Estimation of Bahr-El-Jebel flood area by remote sensing M. A. H. Shamseddin et al. Title Page Abstract Introduction Conclusions References Tables Figures J I J I Back CloseFull Screen / Esc
Printer-friendly Version Interactive Discussion 0 5 10 15 20 25 30 Month Storage volume (Gm 3 )
Jan Feb Mar Apr May Jun Aug Oct Dec
Study Sutcliffe
Fig. 7. A comparison between the study monthly storage volumes and Sutcliffe and Park
HESSD
3, 1851–1877, 2006 Estimation of Bahr-El-Jebel flood area by remote sensing M. A. H. Shamseddin et al. Title Page Abstract Introduction Conclusions References Tables Figures J I J I Back CloseFull Screen / Esc 0 5 10 15 20 25 30 Month Storage volume (Gm 3 )
Jan Feb Mar Apr May Oct Nov Dec
Study Sutcliffe
Fig. 8. A comparison between the study monthly storage volume and Sutcliffe and Park storage