HAL Id: hal-01669560
https://hal.archives-ouvertes.fr/hal-01669560
Submitted on 9 May 2018
HAL is a multi-disciplinary open access
archive for the deposit and dissemination of
sci-entific research documents, whether they are
pub-lished or not. The documents may come from
teaching and research institutions in France or
abroad, or from public or private research centers.
L’archive ouverte pluridisciplinaire HAL, est
destinée au dépôt et à la diffusion de documents
scientifiques de niveau recherche, publiés ou non,
émanant des établissements d’enseignement et de
recherche français ou étrangers, des laboratoires
publics ou privés.
The Dependence of Galaxy Clustering on Stellar-mass
Assembly History for LRGs
Antonio Montero-Dorta, Enrique Perez, Francisco Prada, Sergio
Rodriguez-Torres, Ginevra Favole, Anatoly Klypin, Roberto Cid Fernandes,
Rosa Gonzalez-Delgado, Alberto Dominguez, Adam Bolton, et al.
To cite this version:
Antonio Montero-Dorta, Enrique Perez, Francisco Prada, Sergio Rodriguez-Torres, Ginevra Favole,
et al.. The Dependence of Galaxy Clustering on Stellar-mass Assembly History for LRGs. The
Astrophysical journal letters, Bristol : IOP Publishing, 2017, 848, pp.L2. �10.3847/2041-8213/aa8cc5�.
�hal-01669560�
OBSERVATIONAL EVIDENCE OF GALAXY ASSEMBLY BIAS
Antonio D. Montero-Dorta1, Enrique P´erez1, Francisco Prada1, Sergio Rodr´ıguez-Torres2,3, Ginevra Favole4, Anatoly Klypin5, Roberto Cid Fernandes6, Rosa Gonz´alez-Delgado1, Alberto Dom´ınguez7, Adam S. Bolton8,
Rub´en Garc´ıa-Benito1, Eric Jullo9 & Anna Niemiec9 Draft; April 4, 2018
ABSTRACT
We analyze the spectra of 300,000 luminous red galaxies (LRGs) with stellar masses M∗ & 1011M
from the SDSS-III Baryon Oscillation Spectroscopic Survey (BOSS). By studying their star-formation histories, we find two main evolutionary paths converging into the same quiescent galaxy population at z ∼ 0.55. Fast-growing LRGs assemble 80% of their stellar mass very early on (z ∼ 5), whereas slow-growing LRGs reach the same evolutionary state at z∼ 1.5. Further investigation reveals that their clustering properties on scales of∼1–30 Mpc are, at a high level of significance, also different. Fast-growing LRGs are found to be more strongly clustered and reside in overall denser large-scale structure environments than slow-growing systems, for a given stellar-mass threshold. Our results imply a dependence of clustering on stellar-mass assembly history (naturally connected to the mass-formation history of the corresponding halos) for a homogeneous population of similar mass and color, which constitutes a strong observational evidence of galaxy assembly bias.
Keywords:methods: numerical – surveys – galaxies: formation – galaxies: evolution – galaxies: haloes – large-scale structure of universe.
1. INTRODUCTION
Luminous red galaxies (LRGs) are broadly considered a homogeneous galaxy population, both in terms of color and stellar mass. They are predominantly old and qui-escent, and their star formation histories (SFHs) resem-ble that of a passively-evolving galaxy population (e.g., Eisenstein et al. 2003; Maraston et al. 2009; Tojeiro et al. 2012; Pacifici et al. 2016). They are also known to reside at the center of massive dark-matter halos, and are con-sidered excellent tracers of the large-scale structure (LSS) of the Universe (e.g., Postman & Lauer 1995; Eisenstein et al. 2005; White et al. 2011; Anderson et al. 2014; Rodr´ıguez-Torres et al. 2016).
On the other hand, results from cosmological simu-lations indicate that the clustering properties of dark-matter halos depend not only on halo mass but also on their formation epoch and accretion history (e.g., Gao et al. 2005; Wechsler et al. 2006; Gao & White 2007; Wang et al. 2011; Sunayama et al. 2016). There are rea-sons to believe that this assembly bias manifests itself on the galaxy side as well, so that the clustering signal
1Instituto de Astrof´ısica de Andaluc´ıa (CSIC), Glori-eta de la Astronom´ıa, E-18080 Granada, Spain; [email protected]
2Instituto de F´ısica Te´orica, (UAM/CSIC), Universidad Aut´onoma de Madrid, Cantoblanco, E-28049 Madrid, Spain
3Campus of International Excellence UAM+CSIC, Canto-blanco, E-28049 Madrid, Spain
4European Space Astronomy Center (ESAC), 3825 Villanueva de la Ca nada, Madrid, Spain
5Astronomy Department, New Mexico State University, Las Cruces, NM, USA
6Departamento de F´ısica-CFM, Universidade Federal de Santa Catarina, C.P. 476, 88040-900, Florian´opolis, SC, Brazil
7Grupo de Altas Energ´ıas, Universidad Complutense, E-28040 Madrid, Spain
8National Optical Astronomy Observatory (NOAO), 950 North Cherry Ave., Tucson, AZ 85719, USA
9Laboratoire d’Astrophysique de Marseille - LAM, Universit´e d’Aix-Marseille & CNRS, UMR7326, F-13388 Marseille, France
and the properties of galaxies in the LSS are influenced by the accretion history of their host halos (e.g. Yang et al. 2006; Hearin & Watson 2013; Zentner et al. 2014; Hearin et al. 2015, 2016; Miyatake et al. 2016). A con-sensus, however, is yet to emerge, since previous works could be affected by differences in halo/stellar mass be-tween galaxy samples and/or contamination by satellite galaxies (see, e.g., Paranjape et al. 2015; Lin et al. 2016; Zu & Mandelbaum 2016; Dvornik et al. 2017).
Here we analyze the SFH and clustering properties of more than 300,000 LRGs at 0.50 < z < 0.60, drawn from the Baryon Oscillation Spectroscopic Survey (BOSS, Dawson et al. 2013) of the SDSS-III (Eisenstein et al. 2011). Although these galaxies are already quiescent at these redshifts, we search for evidence of a diverse mass-growth history that could manifest itself in differences in their clustering signal. The BOSS LRG sample is ad-vantageous in that it maps a galaxy population of sim-ilar stellar mass (M∗ & 1011M ), which is mostly
com-prised by central galaxies (only ∼10% of satellites) of massive groups and clusters (see, e.g., White et al. 2011; Rodr´ıguez-Torres et al. 2016).
This letter is organized as follows. The data and sam-ple selection are described in Section 2. The determina-tion of SFHs for LRGs is addressed in Secdetermina-tion 3. Our clustering measurements are presented in Section 4. Fi-nally, in Section 5, we discuss the implications of our results and summarize the main conclusions of our work. Throughout this paper, we adopt a cosmology with ΩM = 0.307, ΩΛ= 0.693 and H0= 100h km s−1 Mpc−1
with h = 0.678 (Planck Collaboration et al. 2014), and use AB magnitudes (Oke & Gunn 1983).
2. DATA AND SAMPLE SELECTION
We use galaxy spectra and photometric data from the Twelfth Data Release of the SDSS (DR12, Alam et al. 2015), which is the final release of SDSS-III/BOSS. We focus on the official data set for cosmological
2 MONTERO-DORTA ET AL. ments within the collaboration, the BOSS DR12 LSS
cat-alog (see Alam et al. 2015). This catcat-alog incorporates a detailed treatment of angular incompleteness and a vari-ety of systematics that could potentially affect the target density of spectroscopically-identified galaxies. We re-strict our analysis to the CMASS (for “Constant MASS”) sample, containing ∼900,000 LRGs within the nominal redshift range 0.4 < z < 0.7. For a detailed description of the BOSS survey, see Dawson et al. (2013).
In order to maximize stellar-mass completeness and minimize selection effects, we exclude galaxies outside the redshift range 0.5 < z < 0.6. Below z ∼ 0.5, the red sequence is severely incomplete due to the CMASS color-color cuts. Above z∼ 0.6, the contamination from bluer objects in the sample increases significantly (see Leau-thaud et al. 2016; Montero-Dorta et al. 2016 for more information on completeness and selection effects). Blue objects within our selected redshift range 0.5 < z < 0.6 are further removed by imposing the color cut g−i > 2.35 (see Masters et al. 2011; Maraston et al. 2013; Favole et al. 2016). Our final LRG parent sample comprises a to-tal of 305,741 LRGs, with stellar masses M∗>1011M ,
over an effective area of 9376 deg2.
We complement the BOSS data with photometric and morphological information extracted from the Data Re-lease 3 (DR3) of the DECam Legacy Survey (DECaLS)1.
DECaLS is an optical survey that will image 6700 deg2to
a photometric depth of r = 23.9, i.e.,∼ 1.5 mag deeper than the SDSS imaging. The DR3 covers a disjoint foot-print of 4200 deg2, observed in all three g, r, z SDSS
filters. DECaLS photometric and morphological infor-mation have been retrieved for∼20% of our parent sam-ple, i.e., ∼55,000 galaxies.
3. THE STAR FORMATION HISTORY OF LRG
SFHs and stellar masses for the parent LRG sample are determined using the starlight code (Cid Fernan-des et al. 2005). starlight fits a spectrum in terms of a non-parametric linear combination of a number of single stellar population models (SSPs) from a base span-ning different ages and metallicities. An important ad-vantage of starlight resides in its flexibility in terms of accommodating for any physically-plausible shape for the SFHs.
The base used in this work contains 319 SSPs drawn from the Charlot & Bruzual CB 2007 library2, where
five metallicity values of 0.0004, 0.004, 0.008, 0.02 and 0.05 are considered (Z = 0.02). These models assume a
Chabrier (2003) initial mass function (IMF). Ages range from 1 Myr to either 7.5 Gyr (using 63 age bins) or 8.0 Gyr (using 64 age bins), depending on the redshift of the galaxy (only ages smaller than the age of the Universe at the corresponding redshift are considered). Each spec-trum is fitted in the rest-frame wavelength range 3000-5930 ˚A. starlight outputs a population vector whose components express the fractional contribution of each base component to the observed continuum at a reference wavelength of 4450 ˚A; the corresponding mass fractions are also given. Throughout this work, the mass fractions used to compute the stellar mass growth are corrected for the mass lost by stars during their evolution. However,
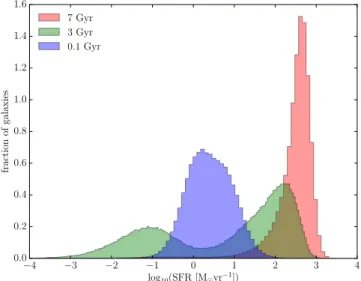
1http://legacysurvey.org/decamls/ 2http://www.bruzual.org/∼gbruzual/cb07 4 3 2 1 0 1 2 3 4 log10(SFR [M yr 1]) 0.0 0.2 0.4 0.6 0.8 1.0 1.2 1.4 1.6 fraction of galaxies 7 Gyr 3 Gyr 0.1 Gyr
Figure 1. The distribution of the logarithm of the SFR, in units of M yr−1, in three different snapshots of galaxy-frame look-back time, centered at 0.1, 3 and 7 Gyr, respectively. The distributions have been normalized to unit area. The 3-Gyr snapshot is used in this work to define two different LRG populations, with measured SFR above and below 2 M yr−1, respectively (see text).
0 1 2 3 4 5 6 7 8
galaxy-frame lookback time [Gyr] 0 100 200 300 400 500 SF R [M yr 1] SFR3 < 2 M yr 1(fast-growing) SFR3 2 M yr 1(slow-growing) 0.6 1 1.5 2 3 5 10 redshift 0.2 0.4 0.6 0.8 1.0 stellar mass gro wth
Figure 2. Average SFHs (solid) and stellar mass growths (dashed) illustrating the two different evolutionary channels for the fast- and slow-growing LRG populations, as defined using the SFR at 3 Gyr galaxy-frame look-back time. The corresponding redshift is shown for reference.
the mass fractions used to compute the star formation rates (SFRs) employ all the mass turned into stars and are therefore not corrected for this evolutionary effect. For the IMF adopted, the total mass turned into stars is ∼1.93 times the current mass in stars. Finally, dust is accounted for using a foreground screen model and a Cardelli et al. (1989) reddening law.
In Figure 1, we show the SFR, in units of M yr−1,
for the parent sample in 3 different snapshots of galaxy-frame look-back time3 (t
back). These snapshots are
cen-tered at 0.1 Gyr (tback < 0.1 Gyr), 3 Gyr (2.5 Gyr
< tback <3.5 Gyr) and 7 Gyr (6.5 Gyr < tback < TU niv;
3 The age is measured retrospectively from z = 0.55, i.e., 5.5 Gyr ago.
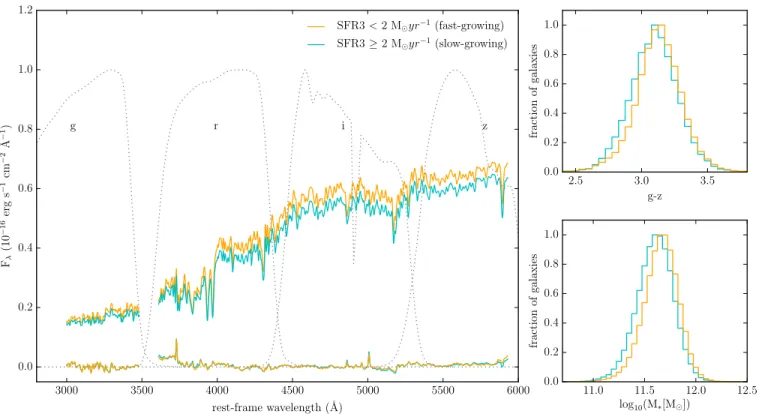
3000 3500 4000 4500 5000 5500 6000 rest-frame wavelength (˚A) 0.0 0.2 0.4 0.6 0.8 1.0 1.2 F (10 16 erg s 1cm 2˚ A 1) g r i z SFR3 < 2 M yr 1(fast-growing) SFR3 2 M yr 1(slow-growing) 11.0 11.5 12.0 12.5 log10(M⇤[M ]) 0.0 0.2 0.4 0.6 0.8 1.0 fraction of galaxies 2.5 3.0 3.5 g-z 0.0 0.2 0.4 0.6 0.8 1.0 fraction of galaxies
Figure 3. Left: Average rest-frame spectra for the fast- (SFR3 < 2 M yr−1) and the slow-growing (SFR3 > 2 M yr−1) LRG populations. In the background, the griz SDSS photometric bands blueshifted by a factor (1 + z) are shown for reference. The residuals after continuum subtraction are provided at the bottom of the plot. From left to right, the following emission lines are visible: [OII] doublet, Hγ, Hβ, [OIII] doublet. Right (upper): g− z color from DECaLS for the two LRG populations. The small shift in the median of both distributions confirms the redder shape of the average spectrum for fast-growing LRGs. Right (lower): The distribution of stellar masses for both populations. Fast-growing LRGs are∼ 0.06 dex more massive than slow-growing LRGs.
where TU niv is the age of the Universe). Hereafter, the
corresponding SFRs will be named SFR0.1, SFR3 and SFR7, respectively. Figure 1 shows a narrow distribu-tion for SFR7, the initial star formadistribu-tion (SF) burst, and a bimodal distribution for SFR3, with a fraction of LRGs showing signs of mild SF activity while the re-maining population appears already quiescent. Note that for∼ 20% of the sample, the measured SFR3 is strictly equal to 0, since the corresponding “age components” are not needed to fit the spectra. The bimodality ob-served at 3 Gyr look-back time disappears later on, as the distribution of SFR0.1 indicates.
We use the bimodal distribution found for SFR3 as a distinctive SFH feature to define two different types of LRGs. Galaxies with SFR3 < 2 M yr−1 (49% of the
sample) are named “fast-growing” LRGs, whereas ob-jects with SFR3≥ 2 M yr−1 (51%) are dubbed
“slow-growing” LRGs. This classification naturally defines two slightly different evolutionary pathways to quiescence, as Figure 2 shows. Here, the average SFH along with the av-erage stellar mass growth as a function of look-back time is displayed for both populations. Fast-growing LRGs experience a very prominent initial burst, where most of the SF takes place. They form 80% of their mass within approximately the first Gyr, i.e., at z & 5. For slow-growing LRGs, the initial burst is slightly less pow-erful, and they experience an episode of SF at ∼ 3 Gyr (z ∼ 1.5). Figure 2 shows a slower stellar-mass growth for these galaxies: they form∼ 50% of their mass within the first Gyr, but it takes them more than 4 Gyr to reach
80% growth. It is important to bear in mind that these differences in SFH are detectable but small, in light of the known uncertainties in stellar population modeling.
It is noteworthy that the existence of multiple paths to quiescence for massive red galaxies has been extensively discussed in the literature (see, e.g., Fritz et al. 2014; Pacifici et al. 2016; Henriques et al. 2016). Evidence of recent SF activity, indicating small deviations from purely-passive evolution similar to those reported here, are well documented (e.g., Tojeiro et al. 2012; Fritz et al. 2014; Citro et al. 2016).
Fast- and slow-growing LRGs present small but notice-able differences in several other properties. This is illus-trated in Figure 3. In the left-hand panel, the average spectra for both populations is presented in rest-frame. Fast-growing LRGs are slightly redder than their slow-growing counterparts. This difference is also noticeable and consistent with the g−z color distribution displayed in the top-right panel of Figure 3. Here, we use DECaLS photometry for our crossmatched sample of∼55,000 ob-jects. The difference in the median g− z color between fast- and slow-growing LRGs is 0.041 mag. Both pop-ulations contain emission-line objects, as the residuals after continuum subtraction in the left-hand panel of Fig-ure 3 demonstrate. However, no significant difference in emission-line properties has been detected between sam-ples.
Importantly, our LRG classification has little impact on stellar mass, as shown in the bottom-right panel of Figure 3. Fast-growing LRGs are on average slightly more massive than their slow-growing counterparts, but
4 MONTERO-DORTA ET AL. 0 10 20 1 10 100 %diff s[Mpc] 0 20 40 60 80 100 120 140 160 180 cross-correlation s 2ξ sc (s )[Mp c 2] 0 20 40 1 10 100 %diff s[Mpc] 20 40 60 80 100 120 140 160 180 log10M∗> 11.70 auto-correlation s 2ξ( s) [Mp c 2] 1 10 100 s[Mpc] 1 10 100 s[Mpc] log10M∗> 11.50 1 10 100 s[Mpc] 1 10 100 s[Mpc] log10M∗> 11.00 SFR3<2 M yr−1(fast-growing) SFR3≥2 M yr−1(slow-growing)
Figure 4. Clustering properties of LRGs for different stellar-mass thresholds. Top: From left to right, the monopole of the redshift-space 2D correlation function (auto-correlation) for the fast- and the slow-growing LRG populations in cumulative stellar mass bins of log10M∗(M ) > 11.7, 11.5, and 11, respectively. Bottom: The cross-correlation between each of the LRG populations and the entire parent sample, for the same cumulative stellar-mass bins. In both panels, the relative difference between the two functions is shown in the subplots. Error bars are computed using a set of BOSS DR12 MultiDark-Patchy mocks. Fast-growing LRGs are∼ 20% more clustered and reside in overall denser environments on all scales below∼ 30 Mpc.
only by 0.058 dex (as measured from the median values). This difference is small considering the uncertainties in the determination of stellar masses. We have checked that the stellar masses computed using starlight for the BOSS CMASS sample are consistent with previous estimates from the Granada FSPS (Ahn et al. 2013), Portsmouth (Maraston et al. 2013) and Wisconsin PCA (Chen et al. 2012) galaxy products.
As expected, slow-growing LRGs present also younger stellar populations at z = 0.55; the flux-weighted mean age is 2.92 Gyr, as compared to 3.30 Gyr for fast-growing systems. A detailed study on the stellar population prop-erties of CMASS LRGs obtained using the starlight code is currently in preparation. In addition, a morpho-logical analysis of LRGs using DECaLS will be presented in Favole et al. (in prep.). In this regard, no significant differences in terms of morphology have been found be-tween fast- and slow-growing LRGs. We anticipate that 83% of the sample is well described by a De Vaucouleurs light profile. The remaining fraction follows either an exponential or a composite profile.
4. CLUSTERING ANALYSIS
The clustering properties of the two LRG populations discussed in Section 3 have been analyzed using the two-point correlation function (2PCF). The 2PCF is defined as the excess probability, compared with that expected
for a random distribution, of finding a pair of galaxies at a given separation. We focus here on the monopole of the 2D correlation function in redshift-space, ξ(rp, π),
where s =√r2
p+ π2 (rp is the perpendicular component
to the line-of-sight and π is the parallel component). We use the Landy & Szalay (1993) estimator to compute this function. Random catalogues 20 times larger than our data samples are employed. For a detailed description of this procedure, see Rodr´ıguez-Torres et al. (2016).
The top panel of Figure 4 displays the monopole of the redshift-space correlation function for the fast- and slow-growing LRG populations in cumulative stellar-mass bins of log10M∗(M ) > 11, 11.5, and 11.7.
Com-pleteness in stellar mass is greater than 80% for the latter, as measured from the stellar mass function of the CMASS LRG sample (see Rodr´ıguez-Torres et al. 2016). Errors on these estimates are computed using a set of BOSS DR12 MultiDark-Patchy mocks (Kitaura et al. 2016). Figure 4 shows that the amplitude of the monopole for fast-growing LRGs is ∼ 20% larger than that of the slow-growing population, on scales between ∼1 and 30 Mpc, independently of the stellar-mass thresh-old adopted. This result is statistically significant at a ∼5-σ level at ∼ 15 Mpc, according to our error estimates. A zoom-in on the correlation function at small scales (s≤ 5 Mpc) for the intermediate mass bin is provided in Figure 5. This figure demonstrates that the amplitude of
0 20 40 5 1 %diff s[Mpc] 50 10 log10M∗> 11.50 ξ( s) SFR3<2 M yr−1(fast-growing) SFR3≥2 M yr−1(slow-growing)
Figure 5. The monopole of the redshift-space 2D correlation function (auto-correlation) on small scales for the fast- and the slow-growing LRG populations in the cumulative stellar mass bin log10M∗(M ) > 11.5. Error bars are computed using a set of BOSS DR12 MultiDark-Patchy mocks. Fast-growing LRGs have ∼ 20% stronger clustering amplitude on scales s & 1 Mpc. In-creasing level of noise makes it difficult to measure the correlation function reliably on even smaller scales, although the data are con-sistent with the same trend even below 1 Mpc.
clustering is systematically larger for fast-growing LRGs down to scales of ∼1 Mpc, or even below.
A dependence of the clustering signal on stellar mass is noticeable in the top panel of Figure 4, as expected, since more massive LRGs are hosted by larger dark-matter ha-los (see Rodr´ıguez-Torres et al. 2016). Yet, when the sample is split in fast- and slow-growing LRGs for a given stellar-mass threshold (equivalent to a given halo-mass threshold, see Behroozi et al. 2013), we observe a clear dependence of the spatial distribution of LRGs (and hence of their dark-matter halos) on their SFHs.
As mentioned in Section 3, fast- and slow-growing LRGs have very similar stellar-mass distributions, with a median difference of only ∼ 0.06 dex. In order to quantify the effect of these stellar-mass differences on the clustering signal shown in Figure 4, we have car-ried out two separate tests (100 realizations each). In the first test, we impose the stellar-mass distributions of both LRG populations to be exactly the same, by ran-domly removing galaxies from each subsample. In the second test, we randomly generate pairs of subsamples having the same stellar-mass distribution as each of the LRG populations, but now independently of their SFHs. Results from the first test show that the difference in the clustering amplitude decreases slightly, but remains significant within the uncertainties (∼ 15%), after the stellar-mass dependence has been removed. This sug-gests that an additional parameter, related to the SFH (or to the stellar-mass assembly history), is necessary to explain the differences seen in Figure 4. The second test confirms this hypothesis, since the amplitude for the two sets of randomly-generated LRG populations differ in less that 5% when the dependence on SFH is removed. These tests rule out the possibility that stellar mass is responsible for the difference seen in the clustering prop-erties of fast- and slow-growing LRGs, which constitutes a clear manifestation of galaxy assembly bias.
In short, we find that fast-growing LRGs are more tightly clustered than their slow-growing counterparts, and that this effect is not due to the small stellar-mass
differences found between the two populations. In order to further determine whether fast-growing LRGs reside in denser LSS environments, we compute and compare the cross-correlation between each LRG population and the entire sample. Results are displayed in the bottom panel of Figure 5, for the same stellar-mass bins discussed above. The amplitude of the cross-correlation function is ∼ 10% larger at scales between ∼1 and 30 Mpc for fast-growing LRGs, in all stellar-mass bins, which confirms that these galaxies live in overall denser environments than slow-growing systems.
5. DISCUSSION AND CONCLUSIONS
The stellar-population analysis of LRGs presented in this work shows two main evolutionary channels converg-ing into the same quenched population at z = 0.55: fast-growing LRGs assemble the majority of their stellar mass very early on, while the remaining population experience a slower growth. Although the differences in SFH are rel-atively small, the two populations have significantly dif-ferent clustering amplitudes (∼ 20%) at scales between ∼1 and 30 Mpc, in the sense that fast-growing LRGs are found to be more strongly clustered than their slow-growing counterparts. Fast-slow-growing LRGs are also found to reside in overall denser LSS environments.
The observed difference in the clustering amplitude, at two-halo term scales of ∼5-30 Mpc, reveals a halo-bias ratio of ∼ 10%, which is of the order of the expected bias dependence on halo concentration (or halo formation time), for a given halo mass (see Wechsler et al. 2006; Hearin & Watson 2013; Hearin et al. 2016).
We have checked that the differences in the clustering amplitude cannot be explained by small differences in stellar mass between the two populations. Our results thus support the hypothesis of galaxy assembly bias, which states that the clustering and properties of galax-ies depend, not only on the mass of their host halos, but also on their accretion history. In terms of halo-galaxy modeling, age-distribution-matching techniques have succeeded in reproducing the clustering of red and blue galaxies separately, at fixed halo mass (Hearin & Watson 2013; Hearin et al. 2014). Similar results have been obtained using “decorated” halo occupation models (Hearin et al. 2016). Yet, no previous study has focused on a homogeneous galaxy population of similar stellar mass, such as LRGs. Our results are unique in that they present the first direct link between clustering and the stellar-mass assembly history of massive galaxies. A de-tailed modeling of our clustering results including age-matching in the halo abundance age-matching prescription and weak-lensing constraints will be presented in a forth-coming paper.
Our results are consistent with previous works that show that massive red galaxies at z . 1 become quies-cent more rapidly in denser environments, which implies that the overall quenching efficiency depends on the de-velopment of large-scale structure (see, e.g., Peng et al. 2010; Darvish et al. 2016; Faisst et al. 2017; Henriques et al. 2016 for discussion).
The observational evidence of galaxy assembly bias re-ported in this work has fundamental implications for the modeling and interpretation of LSS galaxy survey data that use galaxy clustering to extract cosmological infor-mation from the underlying matter-density field.
6 MONTERO-DORTA ET AL.
ACKNOWLEDGMENTS
ADMD, FP, SRT, GF and AD acknowledge support from the Spanish MICINNs Consolider-Ingenio 2010 Pro-gramme under grant MultiDark CSD2009-00064 and MINECO grant AYA2014-60641-C2-1-P. RGD, EP, and RGB are supported by MINECO grants AYA2016-77846-P and AYA2014-57490-AYA2016-77846-P and Junta de Andaluca AYA2016-77846- P12-FQM-2828. We acknowledge the support of the IAA Computing Center staff for the use of the IAA-CSIC computing grid, where all the starlight fits have been performed. A.D. thanks the support of the Juan de la Cierva program from the Spanish MEC.
Funding for SDSS-III has been provided by the Alfred P. Sloan Foundation, the Participating Institutions, the National Science Foundation, and the U.S. Department of Energy Office of Science. The SDSS-III web site is http://www.sdss3.org/.
REFERENCES
Ahn, C. P., Alexandroff, R., Allende Prieto, C., et al. 2013, ArXiv e-prints, arXiv:1307.7735
Alam, S., Albareti, F. D., Allende Prieto, C., et al. 2015, ApJS, 219, 12
Anderson, L., Aubourg, ´E., Bailey, S., et al. 2014, MNRAS, 441, 24
Behroozi, P. S., Wechsler, R. H., & Conroy, C. 2013, ApJ, 770, 57 Cardelli, J. A., Clayton, G. C., & Mathis, J. S. 1989, ApJ, 345,
245
Chabrier, G. 2003, PASP, 115, 763
Chen, Y.-M., Kauffmann, G., Tremonti, C. A., et al. 2012, MNRAS, 421, 314
Cid Fernandes, R., Mateus, A., Sodr´e, L., Stasi´nska, G., & Gomes, J. M. 2005, MNRAS, 358, 363
Citro, A., Pozzetti, L., Moresco, M., & Cimatti, A. 2016, A&A, 592, A19
Darvish, B., Mobasher, B., Sobral, D., et al. 2016, ApJ, 825, 113 Dawson, K. S., Schlegel, D. J., Ahn, C. P., et al. 2013, AJ, 145, 10 Dvornik, A., Cacciato, M., Kuijken, K., et al. 2017, ArXiv
e-prints, arXiv:1703.06657
Eisenstein, D. J., Hogg, D. W., Fukugita, M., et al. 2003, ApJ, 585, 694
Eisenstein, D. J., Zehavi, I., Hogg, D. W., et al. 2005, ApJ, 633, 560
Eisenstein, D. J., Weinberg, D. H., Agol, E., et al. 2011, AJ, 142, 72
Faisst, A. L., Carollo, C. M., Capak, P. L., et al. 2017, ArXiv e-prints, arXiv:1703.09234
Favole, G., McBride, C. K., Eisenstein, D. J., et al. 2016, MNRAS, 462, 2218
Fritz, A., Scodeggio, M., Ilbert, O., et al. 2014, A&A, 563, A92 Gao, L., Springel, V., & White, S. D. M. 2005, MNRAS, 363, L66 Gao, L., & White, S. D. M. 2007, MNRAS, 377, L5
Hearin, A. P., & Watson, D. F. 2013, MNRAS, 435, 1313 Hearin, A. P., Watson, D. F., Becker, M. R., et al. 2014, MNRAS,
444, 729
Hearin, A. P., Watson, D. F., & van den Bosch, F. C. 2015, MNRAS, 452, 1958
Hearin, A. P., Zentner, A. R., van den Bosch, F. C., Campbell, D., & Tollerud, E. 2016, MNRAS, 460, 2552
Henriques, B. M. B., White, S. D. M., Thomas, P. A., et al. 2016, ArXiv e-prints, arXiv:1611.02286
Kitaura, F.-S., Rodr´ıguez-Torres, S., Chuang, C.-H., et al. 2016, MNRAS, 456, 4156
Landy, S. D., & Szalay, A. S. 1993, ApJ, 412, 64
Leauthaud, A., Bundy, K., Saito, S., et al. 2016, MNRAS, 457, 4021
Lin, Y.-T., Mandelbaum, R., Huang, Y.-H., et al. 2016, ApJ, 819, 119
Maraston, C., Str¨omb¨ack, G., Thomas, D., Wake, D. A., & Nichol, R. C. 2009, MNRAS, 394, L107
Maraston, C., Pforr, J., Henriques, B. M., et al. 2013, MNRAS, 435, 2764
Masters, K. L., Maraston, C., Nichol, R. C., et al. 2011, MNRAS, 418, 1055
Miyatake, H., More, S., Takada, M., et al. 2016, Physical Review Letters, 116, 041301
Montero-Dorta, A. D., Bolton, A. S., Brownstein, J. R., et al. 2016, MNRAS, 461, 1131
Oke, J. B., & Gunn, J. E. 1983, ApJ, 266, 713
Pacifici, C., Kassin, S. A., Weiner, B. J., et al. 2016, ApJ, 832, 79 Paranjape, A., Kovaˇc, K., Hartley, W. G., & Pahwa, I. 2015,
MNRAS, 454, 3030
Peng, Y.-j., Lilly, S. J., Kovaˇc, K., et al. 2010, ApJ, 721, 193 Planck Collaboration, Ade, P. A. R., Aghanim, N., et al. 2014,
A&A, 571, A16
Postman, M., & Lauer, T. R. 1995, ApJ, 440, 28
Rodr´ıguez-Torres, S. A., Chuang, C.-H., Prada, F., et al. 2016, MNRAS, 460, 1173
Sunayama, T., Hearin, A. P., Padmanabhan, N., & Leauthaud, A. 2016, MNRAS, 458, 1510
Tojeiro, R., Percival, W. J., Wake, D. A., et al. 2012, MNRAS, 424, 136
Wang, J., Navarro, J. F., Frenk, C. S., et al. 2011, MNRAS, 413, 1373
Wechsler, R. H., Zentner, A. R., Bullock, J. S., Kravtsov, A. V., & Allgood, B. 2006, ApJ, 652, 71
White, M., Blanton, M., Bolton, A., et al. 2011, ApJ, 728, 126 Yang, X., Mo, H. J., & van den Bosch, F. C. 2006, ApJ, 638, L55 Zentner, A. R., Hearin, A. P., & van den Bosch, F. C. 2014,
MNRAS, 443, 3044