DEVELOPMENT OF A REPRESENTATIVE VOLUME ELEMENT OF LITHIUM-ION BATTERIES FOR THERMO-MECHANICAL INTEGRITY
RICHARD LEE HILL, SR
B.S. Mechanical Engineering and Mathematical Sciences United States Naval Academy, 2001
Submitted to the
DEPARTMENT OF MECHANICAL ENGINEERING
MASSACHUSETTS INSTITUTE OF TECHNOLOGY
JUL 2 9 2011
LIBRARIES
ARCHIVES
In Partial Fulfillment of the Degrees of NAVAL ENGINEER
and
MASTER OF SCIENCE IN MECHANICAL ENGINEERING at the
MASSACHUSETTS INSTITUTE OF TECHNOLOGY June, 2011
© 2011 Richard Hill. All rights reserved
The author hereby grants to MIT permission to reproduce and to distribute publicly paper and electronic copies of this thesis document in whole or in part in any medium now known or hereafter created.
Signature of Author: '6__Z_"_ _
Department of Mechanical Engineering May 6, 2011
Certified By:
Tomasz Wierzbicki Professor of Applied Mechanics Thesis Supervisor
Accepted By: V
David E. Hardt Ralph E. and Eloise F. Cross Professor of Mechanical Engineering Chair, Department Committee on Graduate Students
DEVELOPMENT OF A REPRESENTATIVE VOLUME ELEMENT OF LITHIUM-ION BATTERIES FOR THERMO-MECHANICAL INTEGRITY
By
RICHARD L. HILL, SR
Submitted to the Department of Mechanical Engineering on April 4, 2011 in Partial Fulfillment of the Requirements for the Degrees of Naval Engineer and Master of Science in Mechanical Engineering
ABSTRACT
The importance of Lithium-ion batteries continues to grow with the introduction of more electronic devices, electric cars, and energy storage. Yet the optimization approach taken by the manufacturers and system designers is one of test and build, an approach that nearly every other industry has long abandoned. A computational model is required to reduce the expensive build-test cycle and allow safer, cheaper batteries to be built. The path to building this computational model will involve many different processes and one of those processes dictates the homogenizing of the interior of the battery casing by treating the interior as a homogenized Representative Volume Element. This study explains this process and outlines a procedure for the development of this particular model for both cylindrical and prismatic / pouch cells.
Over twenty different mechanical tests were performed on fully-discharged cylindrical and pouched / prismatic lithium-ion batteries, in casings and without casings under multiple loading conditions. These included lateral indentation by a rod, axial compression, through-thickness compression, in-plane unconfined compression, in-plane confined compression, hemispherical punch indentation and three-point bending. Extensive testing on the battery cell and jelly roll of 18650 lithium ion cylindrical cell, combined with the use of analytical solutions to estimate material properties of the cell, yielded the development of a finite element model. It was found that the suitably calibrated model of high density compressible foam provided a very good prediction of the crash behavior of cylindrical battery cell subjected to high intensity lateral and axial loads.
For the prismatic / pouch cell, the measured load-displacement data allowed calculation of the individual compression stress-strain curves for the separator, the active anode and cathode materials. The average stress-volumetric strain relation was derived from averaging the properties of individual layers as well as from direct measurement on the bare cell. This information was then used as an input to the FE model of the cell. The model was composed of shell elements representing the Al and Cu foil and solid elements for the active material with a binder lumped together with the separator. Very good correlation was obtained between LS-Dyna numerical simulation and test results for the through-thickness compression, punch indentation and confined compression. Closed form solutions were also derived for the latter three problems which helped explain the underlying physics and identified important groups of parameters. It was also demonstrated that a thin Mylar pouch enclosure provided considerable reinforcement and in
some cases changed the deformation and failure mechanism.
This paper reports on the results generated for the Li-ion Battery Consortium at MIT.
Thesis Supervisor: Tomasz Wierzbicki Title: Professor of Structural Mechanics
Table of Contents
1. Introduction and Overview of Lithium-Ion Battery Literature ... 7
2. Specific Requirements for Naval Batteries ... 14
3. Identifying Issues with Battery Design / Safety... 17
4. Mechanical Characterization of the Representative Volume Element (RVE)... 18
5. Description of the Testing Program on Typical Cylindrical Batteries...22
5.1 Determination of Shell Casing Properties... 22
5.2 Lateral Indentation of the Cell (with Endcaps) by a Rigid Rod... 24
5.3 Compression of the Cell (no Endcaps) between Two Plates ... 25
5.4 A xial C rush of the C ell...26
6. Description of the Testing Program on Prismatic / Pouch Batteries... 28
6.1 Description of Experiments and Details of Results ... 28
6.2 Compression of the Pouched Cell between Two Plates... 32
6.3 Lateral Indentation of the Cell by a Hemispherical Punch ... 34
6.4 Unconfined Axial Crush of the Cell in the Width and Length Direction ... 35
6.5 Confined Compression Test of the Cell in the Width Direction... 38
6.6 Three Point Bending Test of a Medium-Sized Cell...40
7. Derivation of Closed Form Solutions for Cylindrical and Prismatic / Pouch Batteries... 43
7.1 Analytical Solution of Lateral Crush by Rigid Cylinder ... 43
7.2 Analytical Solution for the Crush Behavior of an Empty Shell...43
7.3 Analytical Solution for the Complete Cell (Outer Shell + Jelly Roll)...45
7.4 Analytical Comparison of Prismatic / Pouch Cell in the Thickness Direction ... 48
7.5 Punch Indentation of a Prismatic / Pouch Cell... 50
7.6 Confined Compression of a Prismatic / Pouch Cell... 52
7.7 Three-point Bending of a Prismatic / Pouch Cell ... 53
8. Numerical Simulation of Axial and Lateral Loads on Batteries ... 55
8.1 Finite Element Modeling of Cylindrical Cells ... 55
8.2 Validation of the Cylindrical Model... 55
8.3 Lateral Compression of the Prismatic / Pouch Cell ... 58
8.4 Punch Indentation Test of the Prismatic / Pouch Cell... 58
8.5 Confined Compression Test of the Prismatic / Pouch Cell... 61
9. Application to the Crush Loading of Battery Modules with a Metal Housing ... 63
10. Conclusions and Recommendations ... 65 R e feren ce s ... 6 7
Acknowledgements
The author thanks the following individuals for their assistance in completing this thesis:
Professor Tomasz Wierzbicki for his direction and guidance on this project. His leadership was
the key into turning a brief idea into a successful Lithium-Ion Consortium at MIT.
Dr. Elham Sahraei for her collaboration in writing the three academic papers from which my
thesis derives. Her Finite Element Analysis modeling formed the backbone of our work.
Meng Luo for all of his assistance in the Impact and Crashworthiness Lab.
List of Figures
Figure 1 Photograph of an 18650 Lithium-ion cell cross-sectioned longitudinally... 7
Figure 2 SEM image showing layer of positive and negative electrodes in an 18650 lithium-ion cell...8
Figure 3 Schematics of the four most common form factors for lithium-ion cells ... 10
Figure 4 Photograph of a cross section of the 18650 Lithium ion cylindrical wound cell ... 11
Figure 5 Small and Medium Lithium-Polymer Pouch Batteries... 12
Figure 6 Multi-scale model of the battery pack spanning five orders of magnitude... 19
Figure 7 The concept of Representative Volume Element ... 21
Figure 8 Endcaps removed, an empty 18650 shell casing, and a fractured dogbone specimen ... 23
Figure 9 True stress-strain curve from 18650 shell casing ... 24
Figure 10 Photograph of crushed cell by rigid rod and the measured load-displacement curve ... 25
Figure 11 Sequence of crushing during the lateral crush test ... 26
Figure 12 Measured load-displacement curve for three apparently identical tests ... 26
Figure 13 Sequence of crushing during the axial crush test... 27
Figure 14 M easured load-displacement of three axial crushes ... 27
Figure 15 Pouch Cell with M ylar Cover Removed... 28
Figure 16 B are Pouch C ell U nrolled... 30
Figure 17 Cross-section View of a Small Lithium-Polymer Cell... 31
Figure 18 Measured Load-Displacement of Lateral Compression of a Bare and Pouch Cell ... 32
Figure 19 Experimental Stress-Volumetric Strain Curve for Bare and Pouched Cells ... 33
Figure 20 Engineering Stress Strain for Load-Displacement Curve of Cathode, Separator, and Anode.... 34
Figure 21 Load-Displacement Curve for Hemispherical Punch Indentation with Photos of Cell ... 35
Figure 22 Fixture Plates for Length and Width Compression of Cells...36
Figure 23 Load-displacement Response of Bare and Pouched Cells Compressed in Width Direction...36
Figure 24 Load-displacement Response of Bare and Pouched Cells Compressed in Length Direction...37
Figure 25 Photographs of Column Buckling in the Length Direction ... 38
Figure 26 Fixture with Battery for Confined Compression Test in the Width Direction ... 38
Figure 27 Axially Compressed Lithium-Ion Battery and High Density Aluminum Honey Comb ... 39
Figure 28 Stress Strain Curve for Confined vs Unconfined Compression in the Width Direction ... 40
Figure 29 Setup and Deformation Sequence of a Three-point Bending of a Battery with Pouch ... 41
Figure 30 Setup and Deformation Sequence of a Three-point Bending of a Bare Battery without Pouch.41 Figure 31 Measured Load-displacement Curves of Pouch and Bare Cells Subject to 3-pt Bending...42
Figure 32 Comparison of FE simulation and closed form soln for an empty shell loaded by a rigid rod .. 44
Figure 33 Finite Element vs Analytical Solution for Lateral Compression of an Empty Shell...45
Figure 34 Assumed geometrical model of the indentation process ... 47
Figure 35 Yield stress versus volumetric strain of the jelly roll ... 48
Figure 36 Analytical vs Experimental Load-Displacement Curve for Punch Indentation of Bare Battery 52 Figure 37 Graphs Showing the Interfacial Slip in Beam with Monotonic and Reverse Curvature ... 54
Figure 38 The unreformed FE model of 18650 battery cell... 55
Figure 39 Rigid rod indentation test versus simulation ... 56
Figure 40 Lateral compression between two plates ... 57
Figure 41 Energy absorption versus the crush distance in an axially loaded cell...57
Figure 43 Deformation and Load-Displacement History of the Cell for Punch Indentation Simulation.... 60 Figure 44 Comparison of Hemispherical Punch Test with the Simulation...60 Figure 45 Confined Compression of the Cell in Width Direction with Multiple Buckles...62 Figure 46 Load Displacement Curve from Confined Compression Test Compared with the Simulation.. 62 Figure 47 Stress-Strain of the Cylindrical vs Rectilinear Battery Compressed in Thickness Direction...63 Figure 48 Prototype of Plane-Strain Compression of Pouched Batteries with Adjustable Confinement ... 64 Figure 49 Toyota Prius Hymotion battery pack and battery module ... 66
1. Introduction and Overview of Lithium-Ion Battery Literature
Today's Lithium-ion batteries are building blocks of very complex systems. Whether the final system is a laptop or an electric vehicle or a United States Naval ship, the desired battery packs are assembled from a system of modules, each of which typically contains a protective, tight sheet metal casing around them. Each module can be further broken down into an array of individual cells whose composition differs in the electrodes and separator from one manufacturer to another. A computed axial tomography (CT) scan through the symmetry plane of the cylindrical cell is shown in Figure 1 below:
Figure 1 Photograph of an 18650 Lithium-ion cell cross-sectioned longitudinally showing the crimp and seal assembly.
There are three interrelated aspects of battery design: electrochemistry, thermal management, and mechanical integrity. The electromechanical process begins at the level of the electrode/separator assembly and most of the advances and closely-guarded secrets of the energy storage capacity are in the composition of the active electrode material with binder. Independent of exact chemistry, all Lithium-ion batteries are built in the same way: as a layered structure consisting of a negative electrode (commonly referred to as the anode), a positive electrode (commonly referred to as a cathode), a polyolefin separator between the active material of binder and electrolyte, and current collectors for both electrodes. While thicker coatings enable higher energy storage, thinner coatings enable higher power capability. A SEM
Figure 2 Scanning electron microscope image (back-scattered election contrast) showing one layer of the positive and negative electrodes in an 18650 lithium-ion cell: 1. Negative electrode coating (graphite powder),
2. Negative electrode current collector (copper foil), 3. Separator (polyethylene/polypropylene film), 4. Positive electrode coating (LiCoO2 powder), 5. Positive electrode current collector (aluminum foil) (Courtesy
of Q. Horn)
While electrical and thermal integrity are equally vital, the design elements they represent change quickly as the battery chemistries evolve. Until battery safety is optimized at the chemistry level, safe handling will continue to rely on mechanical enclosures (shell casing) as well as the protective module and pack enclosures. As most of the strength in a battery pack or module comes from the individual cells, it becomes the most critical component in the process of the advancing Lithium-ion battery safety. This mechanical enclosure calls for the development of a computational model of an individual cell as it remains the least studied but most vital aspect of safety for electric cars. Mechanical integrity is indispensible for electrical integrity and guards against electric short circuit. Full scale 50 mph rear impact tests of an HEV performed by Lim et al (2008) proved that the peak acceleration of the battery pack reached 125g's (1). Such a pulse of a sustained duration of 25-50 ms could cause severe damage to the outer shell and electrical connections, dislodging individual cells from their resting points and further damaging the internal contacts of individual cells. Ultimately this could result in internal electrical connections being broken inside one or more battery cell resulting in a short circuit. The subsequent "thermal runaway" would then produce exceedingly high temperatures, smoke, fire, and potential explosions. The resulting high pressure inside an affected cell could result in end caps being blown off carrying this damage sequence to the neighboring cells and further spreading the catastrophic damage. While the solution to this problem continues to be pursued at the level of electrochemistry research, the protective metal casing of individual cells as well as the battery pack containment vessel remains the vital safety barrier needed to provide the requisite mechanical integrity. Several authors reported on the very severe abuse of a battery cell in the form of local intrusion by a nail, for example Otsuki et al (2006), Nguyen and Taylor (2004), Ashtiani (2009) (2; 3; 4). In most cases, the short circuit resulted in a violent event of sparks, smoke, and explosions.
General information on trends and developments in the battery industry can be found in the proceedings of the International AABC and EVS conference series. Although there is widespread agreement that crash safety of the battery pack is an important issue, very few concrete results have made their way to the open literature. This situation becomes more evident when studying recent papers published in the Journal of Power Sources. Most of the articles report on advances on electrochemistry and it is difficult to find a paper on mechanical properties of the jelly roll (interior of the battery cell) leading to the build-up of a computational model. While that there have been several efforts to model mechanical behavior of batteries in the elastic range (Zhang et al 2007 and 2008, Chen et al 2006, Golmon et al 2009) (5; 6; 7),
elastic analysis itself provides no clues about failure of internal and external components of battery cells, including failure of the separator leading to short circuit. It is hoped that the present research will contribute to the quest to place battery structural/electrical integrity on a firm theoretical and computational ground. A general procedure will be outlined on the development of a constitutive and computational model for both a cylindrical cell and a prismatic cell. It will be shown that an average homogenized property of a battery cell combined with a constitutive model of high density foam can be determined through a combination of physical testing and closed form solutions.
Anatomy of a Lithium Ion Cell
In its simplest form a battery is an electrochemical energy storage device that converts stored chemical energy into electrical energy. Independent of chemistry, all batteries consist of a negative electrode, a positive electrode, a separator, electrolyte, and current collectors for both electrodes. In a lithium-ion battery, these components are:
* Negative electrode (anode) active particles (graphite) with binder and electrolyte
* Positive electrode (cathode) active material (transition metal oxide or phosphate (LiCoO2
most common)) with binder and electrolyte
* Polyolefin separator: nano-porous polyethylene/polypropylene film " Negative electrode current collector: copper foil
* Positive electrode current collector: aluminum foil
* Electrolyte: LiPF6 dissolved in a solution of organic carbonates
When a Lithium-ion cell is charged and discharged, Lithium-ions (Li') shuttle between the negative and positive electrodes as it diffuses into and out of the crystal lattice of the active materials. One of the more common chemistries is offered below:
anode reaction: LiC6 -+ Li+ + 6C + e~
To reduce the diffusion distances of the ions, the active material format most commonly utilized is powder. This powdered active material is coated onto the foil current collectors with the coating thickness optimized for the battery's energy and power capability. Thicker coatings enable higher energy storage while thinner coatings enable higher power capability.
To make a Lithium-ion cell, alternating layers of positive electrodes, negative electrodes and separator are stacked or wound onto an electrode assembly. The electrode assembly is then placed into a container that is sealed to prevent oxygen and moisture ingress as well as electrolyte egress. The shape of the container and its material define the "form factor" of the cell. The four most common form factors for lithium-ion cells are cylindrical, prismatic, coin and pouch, which are shown schematically in Figure 3 below. a Liquid electrolyte C Gelcan Seratnr-Separator lectrolyte Carbon C-Cell can 1 3-4.1 W,~U~~s~ao Sepa ator Al Mesh bd b7+Plastic electrode electrolyte (Catode)
Carbon Plastic electrolyte
Separator Plastic electrode
.isi (Anode)
Cu mesh
Cell can
Figure 3 Schematics of the four most common form factors for lithium-ion cells: a. cylindrical, b. coin, c. pouch (also referred to as "polymer"), and d. prismatic (wound prismatic shown) (Tarascon and Armand,
2001) (8).
The most commonly manufactured Lithium-ion form factor is the cylindrical 18650 cell. The number
"18650" refers to the cell size, which is 18 mm in diameter and 65 mm in length. The 18650 has a
spiral-wound electrode assembly (commonly referred to as a "jelly-roll") that is encased in a metal can (usually steel), and closed by crimping the steel can around the seal assembly. Photographs of a cross-sectioned, commercially available 18650 cell (with crimp/seal assembly) were shown earlier in Figure 1. The microstructure of the wound electrode assembly within a Lithium-ion 18650 cell can be examined by cross-sectioning the Lithium-ion cell in an axial orientation. The high magnification, scanning electron
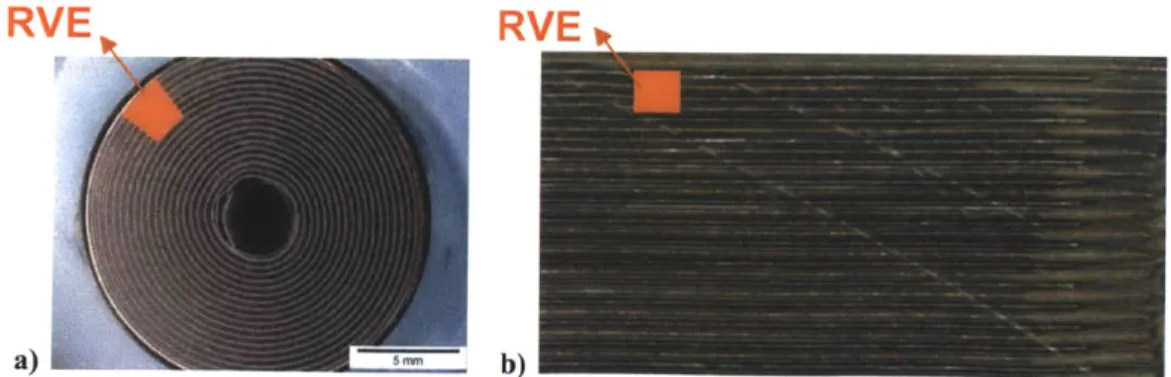
microscope image of this cross-section cell was shown earlier in Figure 2, where the electrode coatings, current collectors and separator are clearly visible. The first order constitutive model of the cylindrical cell is described later in this paper. A tight winding process combined with considerable constraints in the radial and axial direction offered by the shell casing resulted in a relatively isotropic response of the jelly roll. It was then possible to model the battery by introducing a concept of the Representative Volume Element, RVE, shown in Figure 4a and 4b.
In addition to the model of the cylindrical cell, an attempt was also made to develop a computational model of the prismatic and/or pouch batteries. A common feature of the prismatic / pouch batteries is that the electrode/separator assembly is stacked instead of wound, Figure 4b below. Equally important is that the typical length dimension is much larger than the thickness. For example, one commercially available pouch battery is 5 mm thick, 30 mm wide and about 60 mm length. The actual dimensions are not important; it is the length-to-thickness ratio that matters. The prismatic batteries can be considered as multi-layered anisotropic thick plates. The pouch batteries are sealed inside a flexible, thin plastic or aluminum cover while the prismatic batteries are housed inside a more-rigid plastic or metal container. Because of large unsupported area, the cladding offers considerable resistance in some loading directions and very little in others. This type of "form factor" is prone to delamination and buckling. The buckling strength of the cell compressed in the width and length direction is relatively low due to the lack of shear and/or tension forces transmitted between individual layers. The prismatic/pouch batteries do not resist compressive loads as a monolithic plate but instead as a loose collection of thin plates with some random interactions. There is a very interesting duality in the behavior of such structures. They are highly anisotropic at the micro scale. They are isotropic at the size of the representative volume element. The whole cell is then structurally anisotropic.
RVE_
RVEb
a) S b)
Figure 4 Photograph of a cross section of the 18650 Lithium ion cylindrical wound cell (a) and typical stacked profile (b) of a prismatic/pouch cell
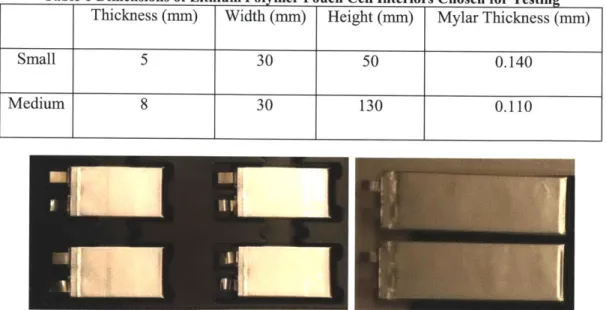
Unlike prismatic or cylindrical cells which contain a sheet-metal casing, pouch cells utilize a thin lightweight covering which allows a more flexible cell. For the purposes of mechanical modeling, the prismatic and pouch batteries will be represented identically in this report. For this study, the 18650 cell was chosen to represent the cylindrical category and two types of pouch cells were chosen to represent prismatic/pouch:
Table 1 Dimensions of Lithium Polymer Pouch Cell Interiors Chosen for Testing Thickness (mm) Width (mm) Height (mm) Mylar Thickness (mm)
Small 5 30 50 0.140
Medium 8 30 130 0.110
Figure 5 Small and Medium Lithium-Polymer Pouch Batteries
Two new parameters are controlling the deformation process: the length scale and amount of lateral through-thickness constraints. In this paper an insight into mechanical performance is gained by physical testing (section 3), model development (section 4) and numerical simulation (section 5). The presented mechanical model of cylindrical cells and prismatic batteries are indispensible tools for the weight-efficient and safe design of batteries. Such models are currently absent in the open literature.
The exact mechanical properties of lithium-ion batteries subjected to various types of loading depend on the "form factor". This form factor is determined by the particular arrangement of the electrode/separator assembly which may be wound, forming a cylindrical shape, or stacked, creating a prismatic shape. All batteries, both cylindrical and prismatic/pouch, possess the same fundamental components of coated anodes and cathodes sandwiched by layers of separator. The anode typically has a coating of graphite in a binder while the cathode is coated by metal oxide with a binder. As the separator is very thin (0.01 mm) and weak compared to the strengths of aluminum/copper foil of the electrodes, it contributes little to the overall strength of the individual cells. This present paper reports the test program and model development of cylindrical and prismatic/pouch batteries which are created by rolling or stacking individual layers of electrode/separator.
Typical laboratory tests require cutting relatively small specimens from larger blocks in order to fit standard fixtures and to avoid exceeding the limits of testing equipment. Instead of cutting specimens into rectilinear shapes, which by itself poses a formidable problem, the pouch batteries already possess the ideal dimensions for laboratory tests. Unlike prismatic or cylindrical cells which contain a sheet-metal casing, pouch cells utilize a thin covering (typically Mylar) which allows a more flexible cell due to the less rigid, lightweight shell.
2. Specific Requirements for Naval Batteries
The United States Navy uses many different types of batteries, from alkaline disposables to the long-preferred reliable, rechargeable Pb-acid which is now transitioning to Absorbed Glass Matt, to NiCd to NiMH and now Li-ion. Lithium-ion's very flat discharge profile offers the best battery from a volumetric and gravimetric power density standpoint. As a disadvantage, Lithium-ion is potentially more dangerous than other chemistries due to flammable electrolyte, fuel, and lithium metal formations.
Lithium-ion battery chemistries continue to advance rapidly. The power densities offered greatly expand the current design scope of power storage, offering more kW-hours of energy at a smaller weight and volume penalty as compared to traditional lead acid batteries. Additionally, as shown by the table below, these newer chemistries such as LiFePO4 offer cycle lives that may be ten times more than that of the
Sealed Lead Acid (SLA).
Table 2: Comp rison Between Different Battery Types (9)
Cost based on
Energy Cycle Environ- cycle life x wh
Chemistry Voltage Density Working Temp Life Safety mental of SLA
Sealed lead acid 2.0V > 35 wh/kg -20 to 40 deg C >200 Safe Not good I
Nickel Cadmium 1.2V > 40 wh/kg -20 to 50 deg C >1000 Safe Bad 0.7
Nickel Metal
Hydride 1.2V > 80 wh/kg -20 to 50 deg C > 500 Safe Good 1.2- 1.4
Unsafe without
LiMnxNiyCozO2 3.7V > 160 wh/kg -20 to 40 deg C > 500 PCB or PCM, OK 1.5 - 2.0
better than LiCo Unsafe without
LiCoO2 3.7V > 200 wh/kg -20 to 60 deg C > 500 PCB or PCM OK 1.5 -2.0
LiFePO4 3.2V > 120 wh/kg 0 to 60 deg C > 2000 Safe Good 0.15-0.25
Lead also continues to grow as an environmental concern. By removing the lead in favor of the newer Lithium-ion chemistry a safer, more environmentally-friendly substitute is realized, further reducing disposal and hazardous-material handling costs. These significant environmental costs are difficult to estimate in the design stage and good designs will strive to minimize their use before construction.
LiCoO2 (lithium polymer) represents a sizeable portion of the pressure-tolerant battery market. These batteries are incredibly power-dense and are very safe by the use of an installed Protection Circuit Module (PCM) or Protection Circuit Board (PCB) which prevents the batteries over-charging or over-discharging. However, these batteries come at a significant price increase compared to SLA.
LiFePO4 represents a relatively new battery discovered in 1996 that has the preferred characteristics of low cost, non-toxic, high energy capacity, and good thermal and electrochemical performance. The low electrical conductivity experience initially has been recently overcome (10) and this new blend has rapidly entered mass-production by numerous major corporations such as DeWalt, GM, Daimler, Cessna, and BAE Systems.
Recent problems with Lithium-ion have further underscored the need for a cautious testing and acceptance program. One example is the Advanced Seal Delivery System (ASDS). The ASDS was a long-range submersible capability to deliver special operations forces for clandestine missions. ASDS provides improved range, speed and payload, and habitability for the crew and a SEAL squad. ASDS will be carried to its designated operational area by a host ship, a specially configured SSN-688 Class submarine. ASDS will also be air transportable by either C-5 or C-17 aircraft. A total of six ASDS will be built for USSOCOM. This manned dry interior battery-powered submersible is managed by the NAVSEA PMS 395 Deep Submergence Directorate and developed by Northrop-Grumman Ocean Systems. A component of Northrop Grumman's Baltimore, Md.-based Electronic Sensors and Systems Division, Oceanic Systems employs approximately 700 people engaged in designing, producing, testing and supporting some of the world's most sophisticated undersea systems. A detailed design and manufacturing development contract was awarded in FY 1994. The program suffered several setbacks even before the fire that ravaged the ASDS vehicle. As is happening to most U.S. Navy ship programs, the ASDS "vehicle" was behind schedule and far over cost projections. The vehicle was completed in 2001 by Northrop Grumman's Ocean Systems in Annapolis, Maryland, and was "conditionally" accepted by the Navy. In 2003 it was assigned to SEAL Delivery Vehicle Team 1 at Pearl Harbor. The craft suffered major problems with its propulsor, electrical system, and batteries. (Its original zinc batteries were replaced with lithium-ion batteries.) Because of these and other problems, plus cost increases, in 2006 the U.S. Special Operations Command -- sponsor of the program -- and the Navy cancelled the procurement of the five planned additional vehicles. The lithium-ion batteries were being charged, with the craft on shore when the fire erupted on 9 November 2008 and burned for six hours. According to Christopher P. Cavas, writing in Navy Times newspaper, "firefighters sealed the ASDS to put out the fire and continued to hose it down for several hours to cool hot spots. The mini-sub remained sealed for more than two weeks before the hatch was opened." (11) The Navy estimates repairs to the 60-ton craft would cost $237
million, or $180 million more than the craft's operating budget, and take nearly three years to complete. "Competing funding priorities ... prevent the command from repairing the ASDS," said U.S. Special Operations Command (USSOCOM) in a statement released July 24. There are no plans to fix the ASDS in the future, said USSOCOM spokesman Lt. Cmdr. Fred Kuebler. (11) While the problems could have been caused by a simple malfunction, the range of damage is overwhelming.
3. Identifying Issues with Battery Design / Safety
The US Navy is concerned with the safety of any type of battery. One concern of any battery is battery venting. In normal venting the battery allows a controlled release of a cell's electrolyte through the designed venting mechanism. Cell defects or abuse may result in venting that may be too high for the installed vent, resulting in an unplanned release of internal pressure by ejecting some or all of the internal components into the environment which may release:
a. flammable organic material
b. LiPF6 which reacts with water to produce hydrofluoric acid (HF)
c. Carbon either as carbon or water reactive lithiated graphites d. LiNiCoO2 or lithiated oxides and heavy/transition metals e. Metal foils and fragments (copper or aluminum)
f. Methane, hydrogen, carbon monoxide (electrolytic decomposition products)
Ventings may also be accompanied by smoke, sparks, and or flames. Typical mistreatment of batteries includes:
a. physical abuse such as crushing, puncturing, or burning b. overcharging due to electronics failure
c. exposure of battery to inapprorpriate environment (high heat or water immersion of an unsealed battery)
d. short circuit or abnormally high rate of discharge e. improper use of or incorrect batteries used in an item
As a result of these concerns, the US Navy has stringent testing procedures designed to test batteries in a full range of environments and abuse scenarios. While this is undoubtedly better than the industries' limited battery of tests, it is nonetheless a slow, methodical and costly process. What is needed is a computational model built from accepted test methods that allows rapid development and feedback. In turn, these models will allow a full understanding of the risk to personnel, equipment, and host platforms.
4. Mechanical Characterization of the Representative Volume Element
(RVE)
This thesis proposes the method of building constitutive and computational models of the lithium-ion battery from the smallest constituents of a jelly roll (aluminum and copper electrode collectors, anode and cathode active material and the separator) through surrounding shell casing, assembly of individual cells into modules and all the way to the entire battery pack. Development of such a multi-scale model will require a complex system of many different types of tests, complex calibration procedures, validation and finite element implementation.
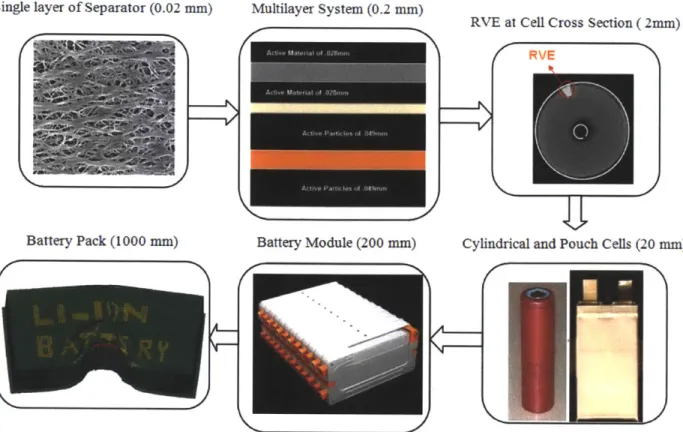
The conceptual flow chart explaining how the model will be built is shown in Figure 6 below. The model spans five orders of magnitude in length. The development of each higher level model draws from the analytical, numerical and experimental results obtained from the preceding level. The order in which the levels interact with one another depends on the specific application. If the objective is to study the effect of initial existing or nucleated flaws on thermo-mechanical integrity, the order of interactions will be from top down beginning with the large battery pack. The same will apply for the optimization procedure.
If, on the other hand the crash safety is of concern, then one would track down Table 1 from bottom up, starting with the smallest component of the separator. A crash event produces high deceleration (125 g), as well as possible intrusion into the battery pack. This can lead to a multitude of different failure modes of the interior of the battery pack. The outer shell could also be severely damaged and cracked, spot-welded electrical connections between the cells and the nickel current collector plates can be broken, and the individual cells could be dislodged from their resting position. Then the cells can interact and crush against each other causing further damage to the internal components of individual cells, including tearing of the separator. This would result in a short circuit, and the subsequent shut off of a battery or the "thermal runaway", leading to exceedingly high temperatures, smoke, fire, and potential explosions. The resulting high pressure inside an affected cell could also result in end caps being blown off causing possible damage to the neighboring cells and further spread the catastrophic damage.
Single layer of Separator (0.02 mm) Battery Pack (1000 mm)
-V
Battery Module (200 mm) Multilayer System (0.2 mm)A-Figure 6 Multi-scale model of the battery pack spanning five orders of magnitude
This multi-disciplinary multi- scale and multi material research effort should be divided into four stand-alone projects. Each project will have its own objective, statement of work and set of deliverables. All projects will have five major ingredients:
e Theoretical framework e Tests for model identification e Finite element implementation * Validation
e Applications
List of Proposed Projects
Project 1 Development of a Constitutive and Computational Model of the Electrode/Separator Assembly
Task 1.1 Modeling of individual layers and the electrode/separator assembly Task 1.2 Testing program on 0.02-0.2 mm scale
RVE at Cell Cross Section ( 2mm) RVE
Task 1.3 Finite element implementation and development of users' subroutines in LS-Dyna and ABAQUS
Project 2 Development of a Homogenized Model of Entire Battery Cell
Task 2.1 Representative Volume Element (RVE) and averaging procedure Task 2.2 Testing program on cylindrical and prismatic battery cells
Task 2.3 Modeling fracture of shell casing including end caps and spot-welds Task 2.4 Determination of Mechanical Properties of the Battery Interior (Jelly Roll) Project 3 Industrial Applications (with active participation of industrial sponsors)
Task 3.1 Prediction of the electrical short circuit and battery thermal runaway under various loading conditions through numerical simulation.
Task 3.2 Study of failure of electrode/separator during the charging/discharging cycles.
Task 3.3 Quantification of the advantages of cylindrical vs. prismatic battery design from the point of view of thermo-mechanical integrity.
Project 4 Optimization of Individual Cells and the Battery Pack for Minimum Weight and Crash Safety
Task4.1 Optimization at the level of the electrode/separator assembly (choice of the binder, strength of interface between various layers, alloy thickness of electrodes)
Task 4.2 Optimization at the level of a battery cell (with active participation of industrial sponsors) (Choice of material and thickness of shell casing, design of end caps and safety valves, cylindrical versus rectangular configuration)
Task 4.3 Optimization at the level of the battery pack (effect of supporting trays, properties of cooling agent, magnitude of cooling gaps, choice of sheet metal, design of brackets, attaching the battery pack to the car body)
This paper details the results of task Task 2.1 Representative Volume Element (RVE) and averaging procedure which is only one step in the complicated task of optimizing batteries for robust mechanical design.
Task 2.1 Representative Volume Element (RVE) and averaging procedure
A practical solution to FE modeling of the cell is to employ much larger homogenized elements, referred to as RVE elements. Such an element would comprise 5 to 10 windings so that the size of an element will be on the order of 2x2x3 mm, see Fig. 10a. The total number of solid elements representing a single cylindrical cell would then become about 5000. The number of RVE elements in a large prismatic cell will be 50,000, which remains manageable.
RVE
b)
a)
Figure 7 The concept of Representative Volume Element reduces substantially the size of the FE model (a) Full model, and a quarter model of the battery cell discretized by large RVE homogenized elements for core
winding (b)
Direct Averaging Procedure Having determined mechanical properties of all constituents of the electrode assembly in Project 1, a macroscopic, homogenized model of the actual material will be developed. Following the work by Sahraei et al (2010) the stresses in the RVE will be averaged under the prescribed uniform strain or displacement at the prescribed boundaries (12). For that purpose a separate subroutine in LS Dyna and Abaqus will be developed. Then, numerical simulation of the local response of the core winding will be determined for different conditions of loading. On that basis a relationship between average stresses and strains will be obtained in a finite or incremental form. The direct averaging
5.
Description of the Testing Program on Typical Cylindrical Batteries
Only fully discharged cells were tested in the MIT Impact and Crashworthiness Lab to minimize environmental hazards. Few special labs with atmospheric hoods are able to test charged, even very small, Lithium-ion cells. Larger cells charged to full capacity would require special testing facilities that could withstand massive thermal events. Such test facilities are operational at Naval Surface Warfare Center Crane, IN and are also under construction in Germany. The MIT test program was conducted both with and without endcaps as the uncapped batteries allowed observations to be conducted of the compressed jelly roll throughout the full range of tests. Hazardous controls consisted of testing only completely
discharged cells and then tightly controlling any spilled electrolyte.
5.1 Determination of Shell Casing Properties
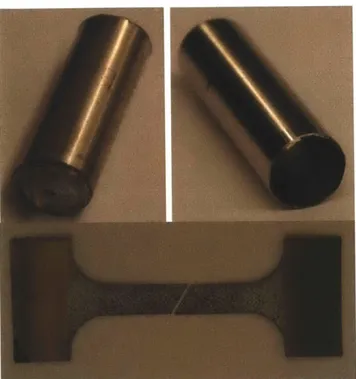
The plastic properties of the shell casing were not obtained from the manufacturer, but rather, determined from our own tests. The manufacturing process for battery casings consists of deep drawing of cans from rolled steel sheets. Both the rolling and drawing processes introduces some amount of anisotropic properties which, while normally pronounced in aluminum, is typically less important in steels. Therefore the material is taken as being isotropic and therefore, the tests in only one direction are sufficient. Tensile tests were performed on dogbone specimens cut from the shell casing. To create dogbone specimens, the endcaps were removed from 18650 cells. The positive terminal endcap was removed by a tubing cutter which evenly removed the endcap. The negative side, however, required the use of a cutting tool on the ninety degree edge of the endcap. After cutting away that edge, the endcap could then be removed exposing the jelly roll. Neither method damaged the jelly roll. Then the jelly rolls were gently removed and the casing was cleaned (see Figure 8 below).
Figure 8 Endcaps removed (left), an empty 18650 shell casing (right), and a fractured dogbone specimen (bottom)
Now the empty casing was cut lengthwise and unrolled. Care was taken to unroll the empty casing which exhibited a great deal of springback. Only the essential amount of stress was applied to unroll the specimen for cutting into a dogbone shape. The final shape of the dogbone specimen was cut using a waterjet by placing the thin shell casing between two thicker plates of steel to keep it flat. Double-sided tape was also used to aid in maintaining it flat for the waterjet.
Digital Image Correlation (DIC) was used to measure local strain. Load-displacement was measured using an MTS 200 kN Universal Test Machine with a 10 kN load cell.
Figure 9 True stress-strain curve from 18650 shell casing
From the above true stress-strain curve (Figure 9), the average flow stress of the shell casing was estimated to be ao = 500MPa. This value is important in the analytical solution of the shell casing which will be discussed in the next section.
5.2
Lateral Indentation of the Cell (with Endcaps) by a Rigid Rod
One of the standard destructive tests of batteries consists of pressing the battery with a rigid lateral indenter. For the purposes of this paper the indenter was chosen as a rigid rod of diameter 12.2mm which is approximately 2/3 of the diameter of the cell. During the test the battery cell wrapped tightly around the rod and the endcaps rotated and lifted slightly from the bottom plate (see Figure 10 below).
True Stress-Strain
-0.01 9E-17 0.01 0.02 0.03
Figure 10 Photograph of crushed cell by rigid rod (above) and the measured load-displacement curve (below)
The measured load-displacement curve of the test is shown in Figure 10. One can observe two phases of the crushing process. In the first phase there is almost a parabolic increase in resistance up to about 8mm crush distance. After that some other complex phenomenon takes place and the crushing strength remains more or less flat.
5.3
Compression of the Cell (no Endcaps) between Two Plates
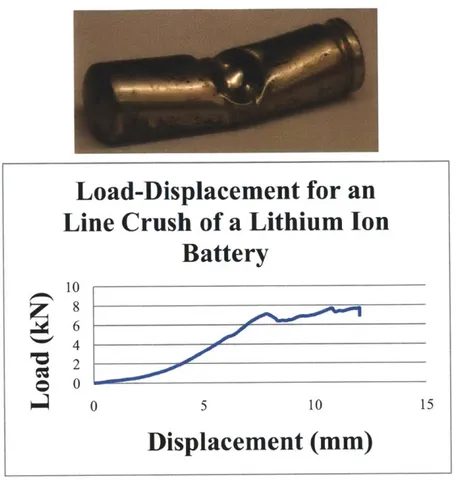
For the remaining two types of tests, the endcaps were removed to allow full observation of the jelly roll during crushing. Additionally, this prevented the endcaps from acting as bulkheads which would resist the crushing motion and for which no easy analytical solution exists. A photographed sequence of the deformation mode of the cross-section of the cell is shown in Figure 11 below. Individual windings which form two flat plates joined by two half-cylinders are easily distinguished. The core support initially provides support but initial compression flattens it and the later photographs missing the core support validate this. The measured load-displacement curve is shown in Figure 12 below.
Load-Displacement for an
Line Crush of a Lithium Ion
Battery
10 8-0 0 0 5 10 15Displacement (mm)
Figure 11 Sequence of crushing during the lateral crush test
Three tests were performed, establishing repeatability. A comparison of the measured load-displacement curve is shown below in Figure 12. Up to 7mm crush distance the results are nearly identical.
Figure 12 Measured load-displacement curve for three apparently identical tests
5.4
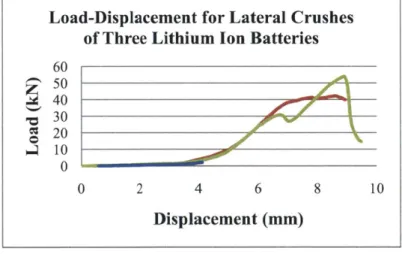
Axial Crush of the Cell
In the axial direction three tests were run with all endcaps removed to minimize hydraulic buildup of the electrolytic fluid which could have resulted in a rupture prematurely ending the test. The slight disparity between the tests may indicate that the batteries are still sealing against the test surface during the crush. Axial crush tests required the use of a retention device which prevented a shear type of crush mode. In this particular test the retention device was a 3/4" inner diameter washer further milled to the outside
Load-Displacement for Lateral Crushes
of Three Lithium Ion Batteries
60 50 40 PC 30 '00r N--1 20 0 04 10 0 2 4 6 8 10Displacement (mm)
dimension of the cylindrical cell. This washer, once affixed to the fixture, prevented side-movement of the cell during compression. The sequence of the deformation mode is shown below in Figure 13. Axi-symmetric folds are shown initiating at one end of the cell. Then a phase of progressive fold formation occurs followed by the development of folding at the center of the cell. This behavior is fully consistent with the results of other investigations where cylinders filled with polyurethane and aluminum foam were subjected to axial crush (13; 14; 15; 16; 17).
Figure 13 Sequence of crushing during the axial crush test
Three tests were performed showing very good repeatability (Figure 14). This concludes the experimental portion of the cylindrical batteries. Additional graphs not used in the report are provided in the attached Appendix.
Figure 14 Measured load-displacement of three axial crushes Load-Displacement for Axial Crushes of Three
Lithium Ion Batteries
14 12 10 8 V 6 4 H 2 0 0 5 10 15 20 2 Displacement (mm) 25
6. Description of the Testing Program on Prismatic / Pouch Batteries
Like the cylindrical tests, only fully discharged cells were tested in the MIT Impact and Crashworthiness Lab to minimize environmental hazards. Typical laboratory tests require cutting relatively small specimens from larger blocks in order to fit standard fixtures and to avoid exceeding the limits of testing equipment. Instead of cutting specimens into rectilinear shapes, which by itself poses a formidable problem, it was decided to work on pouch batteries which already possess the ideal dimensions for laboratory tests. Unlike prismatic or cylindrical cells which contain a sheet-metal casing, pouch cells utilize a very thin covering which allows a more flexible cell. For the present study that is aimed at developing general testing and modeling procedures, the choice of a particular manufacturer is unimportant. All batteries, both cylindrical and prismatic/pouch, possess the same fundamental components of coated anodes and cathodes sandwiched by layers of separator. The anode typically has a coating of graphite in a binder while the cathode is coated by metal oxide with a binder. The sizes of the commonly available pouch batteries which were chosen for this paper were detailed earlier in Table 1 and Figure 5.
Both small and medium batteries tested were wrapped tightly by a Mylar casing. Mylar sheets have a relatively low elastic modulus of 3-4 GPa but a tensile strength of approximately 180 MPa. This relatively strong casing contributed significantly to the strength of the entire cell. Therefore half of the tests were performed on as-received batteries in the enclosing pouch and half bare with this Mylar cover removed, as shown in Figure 15 below. While only fully discharged cells were tested in the MIT Impact and Crashworthiness Lab to minimize environmental impact, hazardous controls further consisted of tightly controlling any spilled electrolyte.
Figure 15 Pouch Cell with Mylar Cover Removed
6.1 Description of Experiments and Details of Results
1. Compression of the Pouched Cell Between Two Plates 2. Lateral Indentation of the Cell by a Hemispherical Punch
3. Unconfined Axial Crush of the Cell in the Length and Width Direction 4. Confined Compression Test of the Cell in the Width Direction
5. Three-Point Bending Test of a Medium-Sized Cell
In all cases, the output of the experiments consisted of the measured load-displacement curve and photographs of the sequenced deformation. The Digital Image Correlation (DIC) available in the lab was not utilized in this preliminary round of tests. In future experiments the DIC will be particularly valuable in determining local displacement and strains. All tests were performed on an MTS load frame with either 10 kN or 200 kN load cells depending on the loading direction. The crosshead speed was chosen to vary between 0.5 and 3 mm/min. Testing of batteries under higher strain rates is the subject of future research.
Figure 16 Bare Pouch Cell Unr< towing Alternating Layers of Anode and Cathode Plates Adhered to Separator
In order to take thickness measurements of individual components, the small pouch battery was disassembled by removing the Mylar pouch, Figure 16 above. The coated anodes and cathodes were easily disconnected from the polymeric separator, similar to a stack of cards. The active particle with binder was firmly adhered to the metallic foils. Altogether, there were 20 individualized copper anode plates, 18 double-sided coated aluminum plates, and 4 single sided coated aluminum plates, all separated by over 46 cell-sized layers of continuous separator. The thickness of the individual copper and aluminum plates was measured by washing away the active coating using a solvent in a vent hood. The thickness of the coated current collectors was measured both individually and as a stack and by dividing the stack height by the number of plates. Both methods gave near identical results. All data gathered is presented below in Table 3 and further illustrated by Figure 17 below.
Active Material of 0.028m.m Sprtro ___________Separator of Active Particles of 0.049mm 0.013mm Active Particles of 0.049mm Separator of £ * * * 0.013mm
Active Material 0o28r 0.013mm
Active Material of 0.028mrn iSeparator of
0.013mm Active Particles of 0.049nmm
Active Particles of 0.049mm
Figure 17 Cross-section View of a Small Lithium-Polymer Cell
In order to keep the battery brand anonymous, it was decided to perform all measurements directly in the lab rather than requesting the data from the manufacturer. Future experiments could benefit from the time-savings of using manufacturer-supplied data.
measured calculated All measurements in mm length width thickness thickness
Cu anode double-coated 50 30 0.117 0.116
Al cathode single coated 50 30 0.056 0.055
Al cathode double-coated 50 30 0.080 0.079
Separator 51.8 32 0.013 0.021
Copper foil 50 30 0.025
-6.2 Compression of the Pouched Cell between Two Plates
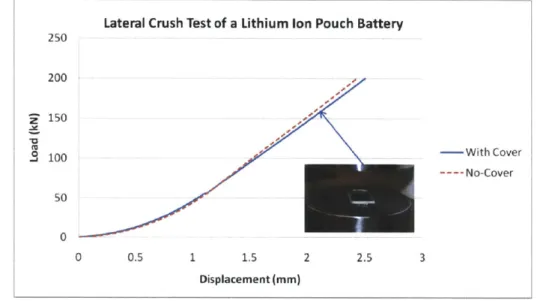
Two batteries, one bare cell and one cell contained in the original Mylar pouch, were subjected to lateral compression of up to approximately one-half of the thickness. The recorded load displacement relationships are shown in Figure 18 below.
Lateral Crush Test of a Lithium Ion Pouch Battery 250 200 150 . 100 -With Cover ---- No-Cover 50 0 0 0.5 1 1.5 2 2.5 3 Displacement (mm)
Figure 18 Measured Load-Displacement of Lateral Compression of a Bare and Pouch Cell
At this crush distance, the force level is near the load-limit of the 200 kN MTS testing machine. In both cases, the electrolyte was squeezed from the cells which allowed for a volumetric change. The porosity of the active particles could be as high as 60% with the voids typically filled with electrolyte. Even though precise measurements were not taken, no visible increase in the lateral dimension of the specimen was observed. This suggests a very low Poisson ratio of the cell material for which a model of compressible foam could be used in the first approximation. In other words an almost uni-axial strain state was created in the tests. It is seen that the pouch cover provides some constraint to the deforming material so that the resulting force-level is slightly higher. It is seen that Mylar casing contributes very little in this lateral compressive direction. From the raw data on a bare cell shown in Figure 18 above the relationship between stress and volumetric strain was extracted, where the volumetric strain uses an engineering measurement. This data is presented below in Figure 19.
160 -Test 140 -- Parabolic Fit 120 M 100 20 0-0 0.2 0.4 0.6 VolStrain
Figure 19 Experimental Stress-Volumetric Strain Curve for Bare and Pouched Cells
The above measured relation between the stress and the average engineering strain provides the basis for subsequent numerical simulation. In addition to the average through-thickness properties, the strength of individual components was measured by performing compression tests of the stacks of identical current collectors (one stack each of aluminum and copper) and separator. The measured load-displacement curves of the individual components are shown below in Figure 20. The determination of the strains of individual components from the displacement and thickness measurements is described in Section 4. 1. An interesting method of determining the cohesive and friction constants of the Coulomb-Mohr model of electrode material from the nano-indentation tests was developed in Gannuau et al 2006 (18). Also, a fascinating procedure to measure the elastic properties of the electrode active material under different percentages of charge was reported in Deshpande et al 2010 (19). The accuracy of the present measuring technique does not allow the precise determination of the elastic modulus, which is important in
Figure 20 Engineering Stress Strain for the Load-Displacement Curve of Cathode, Separator, and Anode
6.3 Lateral Indentation of the Cell by a Hemispherical Punch
For this experiment the radius of the hemispherical punch was chosen to be R=6.35mm, which is comparable to the thickness of the cell. It is thought that such geometry represents a more realistic scenario of a foreign-object intrusion into a battery. The measured load-displacement relation for bare and pouched cell is shown in Figure 21 below.
Engineering Stress-Strain for the Indvidual
Components of the Li-ion Battery
140000 120000 100000 80000 -Copper Anode 60000 -Separator 40000 -Aluminum Cathode 20000 0 0 0.5 1 1.5 Strain (mm/mm)
Figure 21 Measured Load-Displacement Curve for Hemispherical Punch Indentation (left) with Photographs of Damaged Cell (right)
There was little difference between the force level of pouched and bare cells. Bare batteries allowed observation of the interior over the experiment. During the test, a progressive fracturing and delamination of subsequent layers was observed. At the punch travel of approximately 3mm, the load dropped indicating internal failure. Upon inspection there was a clear hole punched through a sizeable portion of the thickness of the cell. It was difficult in this test to detect the actual onset of first rupture of the separator which would have caused an electrical short-circuit and possible thermal events. Future tests of partially discharged batteries will allow detection of a voltage drop which will indicate the exact point of electrical short-circuit. The indentation test of the bare cell produced a progressive delamination, circumferential buckling, and rising of the individual layers. The test of the cell confined by the pouch did not exhibit this phenomenon. The results of the punch indentation test were used for validation of the constitutive model developed during the lateral compression test.
6.4 Unconfined Axial Crush of the Cell in the Width and Length Direction
Again, both bare and pouched cells were tested in the wide-column buckling configuration. Compression tests in the width and length direction will be described separately. These axial crush tests required the use of a retention device which prevented the cells from sliding to the side. Providing this was an aluminum plate with a rectangular groove machined to the thickness of the cell, Figure 22 below. In this type of test dramatic differences in force levels were noticed for the bare versus pouched cells.
Load-Displacementfor a 0.5" Diameter
Punch Test of a Lithium Ion Pouch Battery
10 8 Z6 d 4 - Pouched 2 - ' Bare 0 0 1 2 3 4 5 6 Displacement (mm)
Figure 22 Fixture Plates for Length and Width Compression of Cells
Compression in the Width Direction. As shown by Figure 23 below, the cell with the outside Mylar cover underwent nearly linear compression like a perfect column up to a force magnitude of 250N followed by a sudden compression/shear buckling after which most of the strength was lost. In contrast, the bare battery followed a non-linear pre-buckling path for which the maximum load was only 80N after which a "plastic" hinge-mechanism developed leading to a decaying post-failure response. The displacement to peak load curve was different in both cases. Some delamination was observed in the bare column. Altogether the strength of the pouched battery was six times greater than that of the bare battery.
Load-Displacement for the Width
Buckling of a Lithium Ion Pouch
Battery
0.3 0.25 0.2 0.15 0. Pouched -- Bare 0.05 0 1 2 3 4 Displacement (mm)Compression in the Length Direction. The sequence of events was similar to the previous case; however, there was almost an order of magnitude smaller pre-buckling modulus, as shown in Figure 24 below.
Load-Displacementfor a Length Buckling
Test of a Lithium Ion Pouch Battery
0.18 0.16 0.14 - 0.12 z :. 0.1 0.08 - Pouched -' 0.06 0.04 - - Bare 0.02 0 0 0.5 1 1.5 2 2.5 3 Displacement (mm)
Figure 24 Load-displacement Response of Bare and Pouched Cells Compressed in the Length Direction
The buckling of the bare battery also produced a very visible delamination along the plane of symmetry of the cross-section, as shown by Figure 25 below. While the buckling of the bare vs. pouched battery initially follows the same curve for the length buckling, the bare battery buckled much earlier, as evidenced in Figure 24 above. The results of the above test provide an important clue to the successful design of the compression tolerance cells by choosing a suitable type of outside casing such as Mylar, plastic, aluminum, plastic, composite, steel, etc.
Figure 25 Photographs of Column Buckling in the Length Direction
6.5 Confined Compression Test of the Cell in the Width Direction
Only bare cells were tested in a special fixture shown in Figure 26 below.
tI
6
=4-Figure 26 Fixture with Battery for Confined Compression Test in the Width Direction, before and after Test, with Cover Plate Removed
Great care was taken in tightly fitting the fixture around the cell to minimize extrusion of cell material between adjoining faces of the fixture. The maximum travel of the punch was 13mm. Electrolyte was observed to leak quite early in this test, indicating that the change in volume was partially due to escaping electrolyte from the porous media. Initial runs with the device gave erroneous data which was later attributed to the friction developed by the tightly fitting plate. This was resolved by the use of spacers, lubricant, and re-maching surfaces for tighter clearances. Subsequent tests on an empty fixture resulted in negligible amounts of friction developed.
A considerable force of up to 60kN was reached during this test. Further pressures would have resulted in extrusion of cell material. A photograph of the cross-section of the battery corresponding to the maximum punch travel is also shown in Figure 27 below. At this stage, short wavelength buckles develop in an analogy of Euler column buckling on elastic foundation. The number of buckles along the length is 16. It would appear that the layers at the center of the battery have buckled first and subsequently brought the entire cross-section of battery into wave-like deformation. Similar deformation patterns were observed under compression of high-density honeycomb, Baker et al (18).
Figure 27 Internal Buckling and Delamination in the Axially Compressed Lithium-Ion Battery (left), and High Density Aluminum Honey Comb (right), Baker et al, 1998
The load-displacement data was converted into stress-strain curves and compared to the one generated from the lateral compression. The stress-strain curve is shown below in Figure 28. In both cases the state of strain was almost uni-axial and therefore, the comparison reveals the contribution of the aluminum and copper foil to the response of the system. In the lateral compression, the layers of the foil are normal to the loading direction and therefore do not contribute to the strength. In the present axial compression the layers of the foil are positioned along the direction of loading. The difference between the stress-strain curves obtained from lateral and axial compression is quite distinct in Figure 28 below. The difference is due to the buckling of multiple layers of foil. This process can be modeled using a classical solution of a buckling beam on foundation (19), see section 7.6.