HAL Id: hal-00297825
https://hal.archives-ouvertes.fr/hal-00297825
Submitted on 10 Nov 2005HAL is a multi-disciplinary open access
archive for the deposit and dissemination of sci-entific research documents, whether they are pub-lished or not. The documents may come from teaching and research institutions in France or abroad, or from public or private research centers.
L’archive ouverte pluridisciplinaire HAL, est destinée au dépôt et à la diffusion de documents scientifiques de niveau recherche, publiés ou non, émanant des établissements d’enseignement et de recherche français ou étrangers, des laboratoires publics ou privés.
Seasonal variation of mono- and sesquiterpene emission
rates of Scots pine
H. Hakola, V. Tarvainen, J. Bäck, H. Ranta, B. Bonn, J. Rinne, M. Kulmala
To cite this version:
H. Hakola, V. Tarvainen, J. Bäck, H. Ranta, B. Bonn, et al.. Seasonal variation of mono- and sesquiterpene emission rates of Scots pine. Biogeosciences Discussions, European Geosciences Union, 2005, 2 (6), pp.1697-1717. �hal-00297825�
BGD
2, 1697–1717, 2005 Mono- and sesquiterpene emission rates of Scots pine H. Hakola et al. Title Page Abstract Introduction Conclusions References Tables Figures J I J I Back CloseFull Screen / Esc
Print Version Interactive Discussion EGU Biogeosciences Discussions, 2, 1697–1717, 2005 www.biogeosciences.net/bgd/2/1697/ SRef-ID: 1810-6285/bgd/2005-2-1697 European Geosciences Union
Biogeosciences Discussions
Biogeosciences Discussions is the access reviewed discussion forum of Biogeosciences
Seasonal variation of mono- and
sesquiterpene emission rates of Scots
pine
H. Hakola1, V. Tarvainen1, J. B ¨ack2, H. Ranta3, B. Bonn4, J. Rinne4, and M. Kulmala4
1
Finnish Meteorological Institute, Air Chemistry Laboratory, P.O. Box 503, 00 101 Helsinki, Finland
2
University of Helsinki, Department of Forest Ecology, P.O. Box 27, 00 014 University of Helsinki, Finland
3
University of Turku, Department of Biology, 20 014 University of Turku, Finland
4
University of Helsinki, Department of Physical Sciences, P.O. Box 64, 00 014 University of Helsinki, Finland
Received: 4 October 2005 – Accepted: 14 October 2005 – Published: 10 November 2005 Correspondence to: H. Hakola (hannele.hakola@fmi.fi)
BGD
2, 1697–1717, 2005 Mono- and sesquiterpene emission rates of Scots pine H. Hakola et al. Title Page Abstract Introduction Conclusions References Tables Figures J I J I Back CloseFull Screen / Esc
Print Version Interactive Discussion
EGU
Abstract
The seasonal variation of mono-and sesquiterpene emission rates of Scots pine was measured from April to October in 2004. The emission rates were measured daily in the afternoons with the exception of weekends. Emissions were measured from two branches; one of them was debudded in May (branch A), while the other was
al-5
lowed to grow new needles (branch B). The monoterpene emission pattern remained almost constant throughout the measurement period, ∆3-carene being the dominant monoterpene (50–70% of the VOC emission). The standard monoterpene emission potential was highest during early summer in June (the average of the two branches 0.55 µg g−1(dw)h−1) and lowest during early autumn in September (the average of the
10
two branches 0.12 µg g−1(dw)h−1). The monoterpene emission potential of branch A re-mained low also during October, whereas the emission potential of branch B was very high in October. The sesquiterpenes were mainly emitted during mid summer, the dominant sesquiterpene being β-caryophyllene. Branch A had a higher sesquiterpene emission potential than branch B and the emission maximum occurred concomitant
15
with the high concentration of airborne pathogen spores indicating the defensive role of the sesquiterpene emissions. The sesquiterpene emissions were well correlated with linalool and 1,8-cineol emissions, but not with monoterpenes. Sesquiterpene and 1,8-cineol emissions were equally well described by the temperature dependent and the temperature and light dependent algorithms. This is due to the saturation of the
20
light algorithm as the measurements were always conducted during high light condi-tions.
1. Introduction
During the past decade the characteristics of the biogenic VOC emissions from Euro-pean ecosystems have been intensively studied, both in the boreal forests and in the
25
short-BGD
2, 1697–1717, 2005 Mono- and sesquiterpene emission rates of Scots pine H. Hakola et al. Title Page Abstract Introduction Conclusions References Tables Figures J I J I Back CloseFull Screen / Esc
Print Version Interactive Discussion
EGU
term emissions of monoterpenes (Janson, 1993; Janson et al., 2001; Rinne et al., 1999, 2000; Komenda and Koppmann, 2002) and isoprene (Hakola et al., 1998), even though the VOC emissions have large seasonal variations. Downy birch has been shown to emit large amounts of linalool and sesquiterpenes early in the growing sea-son, while their later emissions consist mainly of sabinene and ocimene (Hakola et
5
al., 2001). Norway spruce emits monoterpenes in May, whereas their emission mainly consists of isoprene in June and sesquiterpenes in July (Hakola et al., 2003). Due to their high reactivity the sesquiterpenes have drawn a lot of attention lately. Their atmospheric lifetimes are only a few minutes and therefore they cannot be measured from the ambient air samples (Hakola et al., 2000, 2003), yet they have a high potential
10
to form secondary organic aerosol (Hoffmann et al., 1997; Jaoui et al., 2003). Bonn and Moortgat (2003) suggest that sesquiterpene ozonolysis could be responsible for the atmospheric new particle formation observed frequently in several rural locations (M ¨akel ¨a et al., 1997; Kulmala et al., 2004). Sesquiterpenes may also affect tropo-spheric ozone concentrations – they may participate in ozone formation when enough
15
nitrogen oxides are present and in a very clean environment some of the ozone de-position may be attributed to sesquiterpene reactions (Kurpius and Goldstein, 2003). The oxidation processes of these very reactive compounds can also produce hydroxyl radicals (Holzinger et al., 2004).
The present study is focused on the seasonal development of the VOC emission
20
rates of Scots pine. The temperature and light dependence of the VOC emissions of Scots pine has been studied by Tarvainen et al. (2005) during the growing seasons of 2002 and 2003. However the data set in the study was concentrated on spring and it was found that especially for sesquiterpenes more measurements were needed during high summer to assess the seasonality. The knowledge on seasonal variation of
25
biogenic VOC emissions is needed for several purposes, e.g. for the evaluation of the effect of biogenic VOCs on the ozone concentrations in the boreal forested areas and the estimation of the contribution of sesquiterpenes to the ozone deposition as well as the new particle formation and growth processes in clean areas.
BGD
2, 1697–1717, 2005 Mono- and sesquiterpene emission rates of Scots pine H. Hakola et al. Title Page Abstract Introduction Conclusions References Tables Figures J I J I Back CloseFull Screen / Esc
Print Version Interactive Discussion
EGU
2. Experimental
The VOC emission rates of Scots pine (Pinus sylvestris L.) were measured in southern Finland in Hyyti ¨al ¨a (61◦510N, 24◦170E) from April to October in 2004. The emission rates were measured daily in the afternoons with the exception of weekends, when no measurements were conducted. The measured tree was growing in a natural forest
5
environment, with an average tree height of 14 m. The samples were collected at a height of about 13 m from two fully sunlit branches. Two branches of the same tree were enclosed in two Teflon cuvettes in March and remained there until October. The other end of the cuvette remained open except during measurements, to ensure sufficient ventilation for the shoot in other times. One of the measured shoots (henceforth called
10
branch A) was debudded in May before budbreak, while the other (branch B) one was allowed to grow new needles.
The emission rates were measured using a dynamic flow through technique. The vol-ume of the Teflon enclosures was approximately 20 l and they were equipped with inlet and outlet ports and a thermometer. The photosynthetically active photon flux density
15
(PPFD) was measured just above the enclosure. The flow through the enclosure was about 8 l per minute. Ozone was removed from the inlet air using MnO2-coated cop-per nets. The air samples were collected onto adsorbent tubes simultaneously from both the inlet and outlet ports. The emission rate (E ) is determined as the mass of compound per needle dry weight and time according to
20
E =(C2− C1)F
m . (1)
Here C2 is the concentration in the outgoing air, C1 is the concentration in the inlet air, and F is the flow rate into the cuvette. The dry weight of the biomass (m) was determined by drying the needles at 75◦C until consistent weight was achieved, and the mass of the new needles was estimated using a regression from a comparable
25
adjacent shoot where daily growth measurements were performed.
BGD
2, 1697–1717, 2005 Mono- and sesquiterpene emission rates of Scots pine H. Hakola et al. Title Page Abstract Introduction Conclusions References Tables Figures J I J I Back CloseFull Screen / Esc
Print Version Interactive Discussion
EGU
Carbopack-B. The sampling time was 60 min. The adsorbent tubes were analyzed us-ing a thermodesorption instrument (Perkin-Elmer ATD-400), connected to a gas chro-matograph (HP 5890) with HP-1 column (60 m, i.d. 0.25 mm) and a mass-selective detector (HP 5972). The detection limits were 32 ng m−3 for isoprene and 2-methyl-3-buten-2ol (MBO). For monoterpenes the detection limits were: camphene 11 ng m−3,
5
carene 42 ng m−3, 1,8-cineole 84 ng m−3, limonene 60 ng m−3, α-pinene 30 ng m−3, β-pinene 36 ng m−3, sabinene 59 ng m−3, and terpinolene 29 ng m−3. The detection limit for β-caryophyllene was 79 ng m−3.
The standardized emission potentials (at 293 K and 1000 µmol m−2s−1) of 2-methyl-3-buten-2-ol (MBO) were calculated according to the temperature and light dependent
10
emission algorithm and those of mono- and sesquiterpenes according to the tempera-ture dependent emission algorithm presented by Guenther et al. (1993) and Guenther (1997). The light and temperature dependence of the emissions of some of the com-pounds was further tested as described in Tarvainen et al. (2005) using the emission algorithms presented by Guenther (1997) and Schuh et al. (1997).
15
Sampling of fungal spores was undertaken with volumetric Burkard-spore trap (Hirst, 1952) on the level of tree canopy in Hyyti ¨al ¨a. The spores were counted during 1 March– 14 August 2004, and identified on stratified randomised fields with microscopic obser-vation (M ¨akinen, 1981). The daily average counts of airborne spores belonging to orders Uredinales and Ustilaginales, and subdivisions Basidiomycotina and
Ascomy-20
cotina (one-, two- and more than two-celled spore types) were used in analyses. Ure-dinales and Ustilaginales are biotrophic pathogens. Marked fraction of Basidiomy-cotina spores dispersing in spring-time and summer are pathogenic or saprophytic wood-rotting fungi. Group Ascomyotina contains numerous pathogenic and endophytic species invading living hosts (Manion 1991).
25
According to the statistics of the Finnish Meteorological Institute, year 2004 was close to or slightly warmer than the long term average. In the southwestern and west-ern parts of the country the growing season started already in April, which is earlier than average. April was, however, also very dry, with the precipitation amounts far
be-BGD
2, 1697–1717, 2005 Mono- and sesquiterpene emission rates of Scots pine H. Hakola et al. Title Page Abstract Introduction Conclusions References Tables Figures J I J I Back CloseFull Screen / Esc
Print Version Interactive Discussion
EGU
low the long term average. The beginning of May was exceptionally warm. However, there were severe cold spells later in May and even in June in the southern parts of the country, which slowed down or even completely stopped the progress of the growing season. The summer was exceptionally rainy, with record high precipitation amounts in southern and central Finland in July. May, June and July were also cloudier than
5
the long term average. September was again quite rainy, completing the exceptional wetness of thermal growing season, which then ended after the first week of October in the southern and central parts of the country.
3. Results and discussion
3.1. Seasonal variability of the VOC emission rates
10
The 7-day running medians of the measured emission rates are presented in Figs. 1a– e. Small amounts of monoterpenes were emitted already in March (not shown in the figure) when the measurements were started. During the first week of May the temper-ature was exceptionally high for the time of the year and the maximum monoterpene emission rate for the growing season of 2004 was observed during that period (Fig. 1a).
15
In general, the monoterpene emissions from the two measured branches did not dif-fer much, although in April, branch B emitted almost twice as much monoterpenes as branch A. In order to investigate the differences in the emission behaviour of new and old needles branch A was debudded on 13 May, while branch B was allowed to grow the new needles. The effect of debudding is discussed in more detail below. Monoterpene
20
emission rates increased at the end of June, but they decreased already in August and remained low until the emission rates from branch B increased at the end of October. Unexpectedly high emission rates from Scots pine during autumn have been measured also earlier (Tarvainen et al., 2005). The monoterpene emission pattern remained al-most the same throughout the growing season (Table 1). The main compound was
25
∆3
BGD
2, 1697–1717, 2005 Mono- and sesquiterpene emission rates of Scots pine H. Hakola et al. Title Page Abstract Introduction Conclusions References Tables Figures J I J I Back CloseFull Screen / Esc
Print Version Interactive Discussion
EGU
Sesquiterpenes, mainly β-caryophyllene (Fig. 1b) and the oxygen containing com-pounds 1,8-cineole (Fig. 1c) and linalool (Fig. 1d) were detected in the emission later than the monoterpenes. In addition to β-caryophyllene, two other sesquiterpenes were detected, but they were not identified and they are referred to here as sesquiterpene1 and sesquiterpene2. 1,8-cineole was identified for the first time at the end of April and
5
linalool was not observed until July. The sesquiterpene emissions were initiated at the end of June and they ceased already in the beginning of August, although sesquiter-penes were found in a few occasional samples also during spring. The emissions of
β-caryophyllene were well correlated with those of linalool and 1,8-cineole, but not
with the monoterpene emissions. In the middle of the summer (15 June–15 August),
10
at the time of the sesquiterpene emissions, the correlation coefficients (r) between the β-caryophyllene and linalool, 1,8-cineole, α-pinene and∆3-carene emissions from branch A were 0.9, 0.8, 0.3 and 0.3, respectively. The sesquiterpenes and linalool have been found to be well correlated also in the VOC emission from downy birch (Hakola et al., 2001). The contribution of β-caryophyllene was significant in July, when it was the
15
most abundant compound after∆3-carene in the emission from branch A (Table 1). MBO emissions were detected for the first time at the end of April (Fig. 1e). Simul-taneously, a small isoprene emission was also observed. The isoprene emission rate was well correlated with the MBO emission rate and it is possible that this is an artefact as MBO can be dehydrated – resulting in isoprene formation – in the analysis. The
20
MBO emissions were quite low, although MBO has been found to be one of the major VOC compounds in pine forests in the United States (Goldan et al., 1993; Harley et al., 1998).
3.2. Sesquiterpene emissions and pathogen spores
Martin et al. (2003) have shown that methyl jasmonate causes a 5-fold increase in the
25
total terpenoid emission of Norway spruce, with an emission pattern shift towards oxy-genated monoterpenes (linalool) and sesquiterpenes (e.g. (E)-β-farnesene). Methyl jasmonate is known to induce the production of defence-related compounds and
re-BGD
2, 1697–1717, 2005 Mono- and sesquiterpene emission rates of Scots pine H. Hakola et al. Title Page Abstract Introduction Conclusions References Tables Figures J I J I Back CloseFull Screen / Esc
Print Version Interactive Discussion
EGU
sistance against several herbivores, and has also been used to induce defensive re-sponses without causing physical damage to the plant. Since daily measurements of pathogen spores from ambient air in Hyyti ¨al ¨a were available, we plotted them together with the sum of the emission rates of the stress-induced compounds (linalool, 1,8-cineole and sesquiterpenes) (Fig. 2). The sesquiterpene emissions were first detected
5
at about the same time as spores with potential pathogens were measured for the first time. Also the maximum emissions of sesquiterpenes, linalool and 1,8-cineole occur concomitant with the maximum of the pathogen spores (Fig. 2). This finding would sup-port the theory that the sesquiterpenes and oxygenated monoterpenes are released by the plant for defensive purposes (Wei, 2003). Factor analysis conducted with the data
10
also showed at least two groups of compounds with emissions behaving in distinctive manner. The first group comprised of α-pinene, sabinene, β-pinene,∆3-carene and limonene, and the second one of 1,8-cineole, linalool, caryophyllene and α-farnesene. The pathogen spores had their highest factor loading on the same factor with the latter group.
15
There are also other stress factors that could initiate sesquiterpene emissions, ozone for example, and one could speculate if the sesquiterpene emissions are affected when removing ozone from the air entering the cuvette.
3.3. The effect of debudding
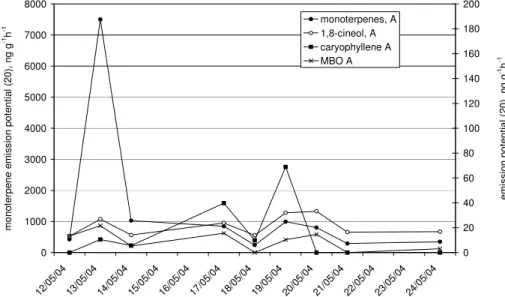
The increased monoterpene emissions caused by the debudding of branch A are
stud-20
ied in Figs. 3 and 4, where the normalized (20◦C) emission potentials of various com-pounds for both branches are shown. The increase of the emission occurred immedi-ately after the cutting of the terminal buds of the branch A on 13 May and lasted for approximately a week (Fig. 3). The emission rates of all monoterpenes from branch A increased after the debudding, but those of MBO, 1,8-cineole and β-caryophyllene did
25
not (Fig. 4). It is well known that in pines MBO is not stored in needles, but is released to the air immediately after it is synthezised (Harley et al., 1998), and this might be the case for 1,8-cineol, too. According to Niinemets et al. (2002), the pools of oxygenated
BGD
2, 1697–1717, 2005 Mono- and sesquiterpene emission rates of Scots pine H. Hakola et al. Title Page Abstract Introduction Conclusions References Tables Figures J I J I Back CloseFull Screen / Esc
Print Version Interactive Discussion
EGU
VOCs with low Henry’s law constant, preferably partitioning to the leaf aqueous phase, may rapidly adjust to changes in stomatal aperture, and their storage pools therefore are relatively small when the stomata are open.
Later in the growing season these two branches behaved somewhat differently. The most important difference in the emission rates between the branches was found in the
5
emissions of sesquiterpenes. The debudded branch (A) had much higher sesquiter-pene emission rates. The July average emission potentials (20◦C) were 0.18 and 0.04 µg g−1h−1for branches A and B, respectively. The only visible difference between the branches was that after debudding branch A started to grow new buds. However, it is not likely that the sesquiterpenes were emitted from the developing buds, since high
10
emissions related to bud sprouting could not be seen in the beginning of the summer, neither in fall during the current year’s bud development in branch B.
Contrary to sesquiterpene emissions, higher MBO emission rates were measured from branch B which was not debudded and had new needles. This could be due to maturation of new needle tissue, as the enzyme activities for terpenoid biosynthesis
15
correlate with the developmental stage of leaf tissues (Lehning et al., 2001).
The monoterpene emission potentials between the two branches did not show large deviations until autumn. In October the branch which was not debudded (B) exhibited the highest emission potential of the measurement period. It was more than six times as high as the emission potential of branch A. The contribution of the new needle year
20
class to the whole branch monoterpene emissions can thus be significant, especially during the winter hardening period in late fall.
3.4. Light and temperature dependence of the emissions
As has been shown in a number of studies (e.g. Janson, 1993; Komenda and Kopp-mann, 2002; Tarvainen et al., 2005) the VOC emission rates of Scots pine are
de-25
pendent on temperature and the present study again confirmed the earlier results. A nonlinear regression fit similar to the one done by Tarvainen et al. (2005) of the July sesquiterpene emissions to the temperature dependent emission algorithm of
Guen-BGD
2, 1697–1717, 2005 Mono- and sesquiterpene emission rates of Scots pine H. Hakola et al. Title Page Abstract Introduction Conclusions References Tables Figures J I J I Back CloseFull Screen / Esc
Print Version Interactive Discussion
EGU
ther et al. (1993) (Fig. 5), henceforth called the TEMP algorithm, resulted in a reason-ably good agreement, with an r2of 0.63 and 0.76 for branches A and B, respectively. The observed higher emissions of the debudded branch A were reflected in the stan-dardized emission potentials (at 303.15 K and 1000 µmol photons m−2s−1), which were 407±47 ng g−1h−1for branch A and 150±19 ng g−1h−1for branch B. When normalized
5
to 20◦C these values are close to the ones given in Table 1 for the average sesquiter-pene emission potentials of branches A and B in July.
Tarvainen et al. (2005) found that the 1,8-cineole emissions measured in 2003 in Hyyti ¨al ¨a were equally well described by a temperature and light dependent algorithm (Guenther, 1997) and by a temperature-only dependent pool algorithm (Guenther et al.,
10
1993). They concluded that more measurements of the 1,8-cineole emissions should be made, especially during the high summer in order to resolve the light dependence of the emissions. Our data set of 2004 had a better coverage of this high emission period but it also yielded the same ambiguous results. In addition to the simple exponential TEMP algorithm, we tested both the light and temperature dependent emission
algo-15
rithm of Guenther (1997), and the slightly different formulation of the light dependence presented by Schuh et al. (1997), henceforth called the G97 and SCHUH algorithms, respectively. The latter two algorithms have identical formulation, except that Schuh et al. (1997) suggest a slightly more moderate light dependence, with the light depen-dent environmental correction factor used in the G97 algorithm raised to the power of
20
two in the SCHUH parameterisation. The results of the nonlinear regression analysis of the emission rates of branches A and B are presented in Table 2 for these three algorithms. In addition to being able to describe the emissions equally well, all three al-gorithms also yield almost identical standardized emission potentials (at 303.15 K and 1000 µmol m−2s−1) for each branch. When normalised to 20◦C, these values are again
25
very close to those given in Table 1 for the average emission potentials of 1,8-cineole for branches A and B in July.
The remarkable similarity of the emission potentials of 1,8-cineole and the high r2 values obtained by the nonlinear regression analysis using the different algorithms
BGD
2, 1697–1717, 2005 Mono- and sesquiterpene emission rates of Scots pine H. Hakola et al. Title Page Abstract Introduction Conclusions References Tables Figures J I J I Back CloseFull Screen / Esc
Print Version Interactive Discussion
EGU
is due to the saturation of the light algorithm as the measurements were always conducted during high light conditions. Diurnal measurements would be needed for the validation or development of emission algorithms. In the data set collected dur-ing these experiments in Hyyti ¨al ¨a, the dependence of the temperature (T) of the photosynthetically active photon flux density (PPFD) was logarithmic with the form
5
T=11.885·ln (PPFD)−59.614 (r2=0.72). In July 2004 the dependence was even stronger: T=7.8851·ln (PPFD)−28.085 (r2=0.83). The maximum temperatures in July were approximately 30◦C, i.e. well below the turning point of the exponential growth of the temperature dependent correction factor of the G97 and SCHUH algorithms. Fur-thermore, the PPFD values in the July data ranged approximately between 500 and
10
1500 µmol m−2s−1 leading to saturation of the light algorithm in most cases. This ex-plains why the results using the G97 and SCHUH algorithms were almost identical as in this region the light dependent environmental correction factor is quite close to unity and the effect of the power of two remains small.
4. Conclusions
15
The seasonal variation of monoterpene emission rates of Scots pine confirmed the earlier results; a high emission potential during early summer, declining emission po-tentials later in summer and early autumn and higher again later autumn (Komenda and Koppmann, 2002; Tarvainen et al., 2005). However, this study showed that the increase of the emission potential during autumn is due to the new needles, as
20
the emission potential of the debudded branch did not increase. The monoterpene emission pattern remained almost constant throughout the measurement period,∆3 -carene being the dominant monoterpene (50–70% of the VOC emission). The standard monoterpene emission potential (20◦C) was highest in June (the average of the two branches 0.55 µg g−1(dw)h−1) and lowest in September (the average of the two branches
25
BGD
2, 1697–1717, 2005 Mono- and sesquiterpene emission rates of Scots pine H. Hakola et al. Title Page Abstract Introduction Conclusions References Tables Figures J I J I Back CloseFull Screen / Esc
Print Version Interactive Discussion
EGU
The new needles also had a much higher MBO emission potential than the needles from the previous years. The standardized MBO emission potential was more than ten times higher in the branch with new needles in June and continued to be a little higher also later in the growing season.
The sesquiterpenes were mainly emitted in the middle of the summer, the
domi-5
nant sesquiterpene being β-caryophyllene. The sesquiterpene emissions were well correlated with the linalool and 1,8-cineole emissions, but not with the monoterpenes. The emission maximum occurred concomitant with the maximum concentration of the pathogen spores indicating the defensive role of the sesquiterpene emissions.
It has been shown earlier that the monoterpene emissions in Hyyti ¨al ¨a are usually well
10
explained by a temperature dependent emission algorithm (Tarvainen et al., 2005). In the present study, the temperature dependence of the sesquiterpene and 1,8-cineole emissions was studied and they were found to be equally well described by the temper-ature dependent and the tempertemper-ature and light dependent algorithms. This ambiquity of the algorithm fitting results is due to the saturation of the light algorithm as the
mea-15
surements were always conducted during high light conditions.
References
Bonn, B. and Moortgat, G. K.: Sesquiterpene ozonolysis: origin of atmospheric
new particle formation from biogenic hydrocarbons, Geophys. Res. Lett., 30, 1585, doi:10.1029/2003GL017000, 2003.
20
Goldan, P. D., Kuster, W. C., and Fehsenfeld, F. C.: The observation of a C5 alcohol emission in a North American pine forest, Geophys. Res. Lett., 20, 1039–1042, 1993.
Guenther, A., Zimmerman, P. R., Harley, P. C., Monson, R. K., and Fall, R.: Isoprene and monoterpene emission rate variability: Model evaluations and sensitivity analyses, J. Geo-phys. Res., 98, 12 609–12 617, 1993.
25
Guenther, A.: Seasonal and spatial variations in natural volatile organic compound emissions, Ecol. Appl., 7(1), 34–45, 1997.
BGD
2, 1697–1717, 2005 Mono- and sesquiterpene emission rates of Scots pine H. Hakola et al. Title Page Abstract Introduction Conclusions References Tables Figures J I J I Back CloseFull Screen / Esc
Print Version Interactive Discussion
EGU (Salix phylisifolia), Silver birch (Betula bendula) and European aspen (Populus tremula),
At-mos. Environ., 32, 1825–1833, 1998.
Hakola, H., Laurila, T., Rinne, J., and Puhto, K.: The ambient concentrations of biogenic hydro-carbons at a Northern European, boreal site, Atmos. Environ., 34, 4971–4982, 2000. Hakola, H., Laurila, T., Lindfors, V., Hell ´en, H., Gaman, A., and Rinne, J.: Variation of the VOC 5
emission rates of birch species during the growing season, Boreal Environment Research, 6, 237–249, 2001.
Hakola, H., Tarvainen, V., Laurila, T., Hiltunen, V., Hell ´en, H., and Keronen, P.: Seasonal vari-ation of VOC concentrvari-ations above a boreal coniferous forest, Atmos. Environ., 37, 1623– 1634, 2003.
10
Hansen, U. and Seufert, G.: Temperature and light dependence of β-caryophyllene emission rates, J. Geophys. Res., 108(D24), 4801, doi:10.1029/2003JD003853, 2003.
Harley, P., Fridd-Stroud, V., Greenberg, J., Guenther, A., and Vasconcellos, P.: Emission of 2-methyl-3-buten-2-ol by pines: A potentially large natural source or reactive carbon to the atmosphere, J. Geophys. Res., 103, D19, 25 479–25 486, 1998.
15
Hirst, J. M.: An automatic volumetric spore trap, Ann. Appl. Biol. 39, 29–33, 1952.
Hoffmann, T., Odum, J. R., Bowman, F., Collins, D., Klockow, D., Flagan, R. C., and Seinfeld, J. H.; Formation of organic aerosols from the oxidation of biogenic hydrocarbons, J. Atmos. Chem., 26, 189–222, 1997.
Holzinger, R., Lee, A., Paw, K. T., and Goldstein, A.: Observations of oxidation products above 20
a forest imply biogenic emissions of very reactive compounds, Atmos. Chem. Phys., 5, 67– 75, 2004,
SRef-ID: 1680-7324/acp/2005-5-67.
Jaoui, M., Leungsakul, S., and Kamens, R. M.: Gas and particle products distribution from the reaction of β-caryophyllene with ozone, J. Atmos. Chem., 45, 261–287, 2003.
25
Janson, R.: Monoterpene emissions from Scots Pine and Norwegian Spruce, J. Geophys. Res., 98, 2839–2850, 1993.
Janson, R. and De Serves, C.: Acetone and monoterpene emissions from the boreal forest in northern Europe, Atmos. Environ., 35, 4629–4637, 2001.
Komenda, M. and Koppmann, R.: Monoterpene emissions from Scots pine (Pinus
30
sylvestris): Field studies of emission rate variabilities, J. Geophys. Res., 107, D13,
doi:10.1029/2001JD000691, 2002.
BGD
2, 1697–1717, 2005 Mono- and sesquiterpene emission rates of Scots pine H. Hakola et al. Title Page Abstract Introduction Conclusions References Tables Figures J I J I Back CloseFull Screen / Esc
Print Version Interactive Discussion
EGU and McMurry, P.H.: Formation and growth rates of ultrafine atmospheric particles: A review
of observations, J. Aerosol Sci., 35, 143–176, 2004.
Kurpius, M. R. and Goldstein, A. H.: Gas-phase chemistry dominates O3 loss to a forest, implying a source of aerosols and hydroxyl radicals to the atmosphere, Geophys. Res. Lett., 30, 1371, doi:10.1029/2002GL016785, 2003.
5
Lehning, A, Zimmer, W, Zimmer, A, and Schnitzler, J.-P.: Modeling of annual variations of oak (Quercus robur L.) isoprene synthase activity to predict isoprene emission rates, J. Geophys. Res., 106, 3157–3166, 2001.
Manion P. D.: Tree disease consepts, Prentice Hall, NJ., 402 pp., 1991.
Martin, D. M., Gershenzon, J., and Bohlman, J.: Induction of volatile terpene biosynthesis and 10
diurnal emission by methyl jasmonate in foliage of Norway spruce, Plant Physiology, 132, 1586–1599, 2003.
M ¨akel ¨a, J. M., Aalto, P., Jokinen, V., Pohja, T., Nissinen, A., Palmroth, S., Markkanen, T., Seitsonen, K., Lihavainen, H., and Kulmala, M.: Observation of ultrafine aerosol particle formation and growth in boreal forest, Geophys. Res. Lett., 24, 1219–1222, 1997.
15
M ¨akinen, Y.: Random sampling in the study of microscopic slides, Rep. form the Aerobiol. Lab. of Univ. Turku, 5, 27–43, 1981.
Niinemets, ¨U., Reichstein, M., Staudt, M., Seufert, G., and Tenhunen J. D.: Stomatal constraints
may affect emission of oxygenated monoterpenoids from the foliage of Pinus pinea, Plant
Physiology, 130, 1371–1385, 2002. 20
Rinne, J., Hakola, H., and Laurila, T.: Vertical fluxes of monoterpenes above a Scots pine stand in the boreal vegetation zone, Phys. Chem. Earth (B), 24, 711–715, 1999.
Rinne, J., Hakola, H., Laurila, T., and Rannik, ¨U.: Canopy scale monoterpene emissions of
Pinus sylvestris dominated forests, Atmos. Environ., 34, 1099–1107, 2000.
Schuh, G., Heiden, A. C., Hoffmann, T., Kahl, J., Rockel, P., Rudolph, J., and Wildt, J.: Emis-25
sions of volatile organic compounds from sunflower and beech: dependence on temperature and light intensity, J. Atmos. Chem., 27, 291–318, 1997.
Tarvainen, V., Hakola, H., Hell ´en, H., B ¨ack, J., Hari, P., Kulmala, M.: Temperature and light dependence of the VOC emissions of Scots pine, Atmos. Chem. Phys., 5, 989–998, 2005,
SRef-ID: 1680-7324/acp/2005-5-989.
30
Wei, T.: Recent advances in the molecular genetics of resin biosynthesis and genetic engineer-ing strategies to improve defences in conifers, J. For. Res., 14, 171–179, 2003.
BGD
2, 1697–1717, 2005 Mono- and sesquiterpene emission rates of Scots pine H. Hakola et al. Title Page Abstract Introduction Conclusions References Tables Figures J I J I Back CloseFull Screen / Esc
Print Version Interactive Discussion
EGU
Table 1. The monthly mean VOC emission potentials (20◦C) of two branches (A and B) of
the same Pinus sylvestris (ng g−1(needle dry weight)h−1). The emission potentials of the temperature
dependent compounds are standardized to 20◦C according to Guenther et al. (1993) using β
value 0.09 K−1. The MBO emission was standardized using the light and temperature
depen-dent isoprene algorithm. The effect of the debudding of branch A on 13 May has been removed
from the monthly mean by ignoring the measurements a week after debudding.
April May June July August September October
MBO A 2 12 3 6 3 5 2 MBO B 4 14 35 15 7 8 4 1,8-Cineol A 1 18 18 27 8 0 0 1,8-Cineol B 2 12 14 29 7 0 0 linalool A 2 0 0 26 1 0 0 linalool B 3 0 0 6 1 0 0 ∆3−Carene A 128 361 368 232 124 72 76 ∆3−Carene B 306 370 460 351 131 80 434 other monoterpenes A 55 98 146 108 55 28 34 other monoterpenes B 140 101 118 99 58 52 286 β−caryophyllene A 1 1 21 60 9 1 0 β−caryophyllene B 1 4 5 19 4 2 5 other sesquiterpenes A 0 0 4 14 4 1 0 other sesquiterpenes B 0 1 1 5 2 1 2
BGD
2, 1697–1717, 2005 Mono- and sesquiterpene emission rates of Scots pine H. Hakola et al. Title Page Abstract Introduction Conclusions References Tables Figures J I J I Back CloseFull Screen / Esc
Print Version Interactive Discussion
EGU
Table 2. The results of the nonlinear regression analysis of the 1,8-cineole and β-caryophyllene
emission rates of branches A and B in July 2004 using three emission algorithms; the tem-perature dependent TEMP algorithm (Guenther et al., 1993) and two temtem-perature and light dependent algorithms G97 (Guenther et al., 1997) and SCHUH (Schuh et al., 1997).
Branch A Branch B E0 β R2 E0 β R2 1,8-cineole TEMP 90.1±6.4 0.180 0.82 113±11 0.180 0.82 G97 82.3±5.9 – 0.79 97.9±7.0 – 0.80 SCHUH 86.4±5.8 – 0.81 107±8 – 0.80 β-caryophyllene TEMP 407±47 0.175 0.63 150±19 0.201 0.76 G97 373±41 – 0.61 122±12 – 0.70 SCHUH
BGD
2, 1697–1717, 2005 Mono- and sesquiterpene emission rates of Scots pine H. Hakola et al. Title Page Abstract Introduction Conclusions References Tables Figures J I J I Back CloseFull Screen / Esc
Print Version Interactive Discussion EGU 0 500 1000 1500 2000 2500 3000 3500 01/04/04 01/05/04 01/06/04 01/07/04 01/08/04 01/09/04 01/10/04 em is si on ra te (n g g -1 h -1) monoterpene, A monoterpene, B 1a 0 50 100 150 200 250 300 350 400 450 500 01/04/04 01/05/04 01/06/04 01/07/04 01/08/04 01/09/04 01/10/04 em is si on ra te (n g g -1h -1) sesquiterpene, A sesquiterpene, B 1b 0 10 20 30 40 50 60 70 80 90 100 01/04/04 01/05/04 01/06/04 01/07/04 01/08/04 01/09/04 01/10/04 em is si on ra te (n g g -1h -1) 1,8-cineol, A 1,8-cineol, B 1c 0 20 40 60 80 100 120 01/04/04 01/05/04 01/06/04 01/07/04 01/08/04 01/09/04 01/10/04 em is si on ra te (n g g -1h -1) linalool, A linalool, B 1d 0 10 20 30 40 50 60 01/04/04 01/05/04 01/06/04 01/07/04 01/08/04 01/09/04 01/10/04 em is si on ra te (n g g -1h -1) MBO, A MBO, B 1e
Fig. 1. 7 day running medians of the VOC emission rates from Scots pine in Hyyti ¨al ¨a, Finland
in 2004. The samples were taken at midday from two different branches (A and B) in the same
BGD
2, 1697–1717, 2005 Mono- and sesquiterpene emission rates of Scots pine H. Hakola et al. Title Page Abstract Introduction Conclusions References Tables Figures J I J I Back CloseFull Screen / Esc
Print Version Interactive Discussion EGU 0 200 400 600 800 1000 1200 17/03/04 17/04/04 17/05/04 17/06/04 17/07/04 17/08/04 em is si on ra te (n g g -1 h -1 ) 0 5000 10000 15000 20000 25000 30000 35000 40000 45000 50000 pa th og en s po re s
sesquiterpenes, linalool and 1,8-cineol A pathogen spores
Fig. 2. The sum of the emission rates of sesquiterpenes, linalool and 1,8-cineole from branch A
BGD
2, 1697–1717, 2005 Mono- and sesquiterpene emission rates of Scots pine H. Hakola et al. Title Page Abstract Introduction Conclusions References Tables Figures J I J I Back CloseFull Screen / Esc
Print Version Interactive Discussion EGU 0 1000 2000 3000 4000 5000 6000 7000 8000 12/05 /04 13/05 /04 14/05 /04 15/05 /04 16/05 /04 17/05 /04 18/05 /04 19/05 /04 20/05 /04 21/05 /04 22/05 /04 23/05 /04 24/05 /04 em is si on p ot en tia l ( 20 ), n g g -1 h -1 monoterpenes, A monoterpenes, B
Fig. 3. The effect of the debudding of branch A on 13 May on the monoterpene emissions.
BGD
2, 1697–1717, 2005 Mono- and sesquiterpene emission rates of Scots pine H. Hakola et al. Title Page Abstract Introduction Conclusions References Tables Figures J I J I Back CloseFull Screen / Esc
Print Version Interactive Discussion EGU 0 1000 2000 3000 4000 5000 6000 7000 8000 12/05 /04 13/05 /04 14/05 /04 15/05 /04 16/05 /04 17/05 /04 18/05 /04 19/05 /04 20/05 /04 21/05 /04 22/05 /04 23/05 /04 24/05 /04 m on ot er pe ne e m is si on p ot en tia l ( 20 ), n g g -1h -1 0 20 40 60 80 100 120 140 160 180 200 em is si on p ot en tia l ( 20 ), n g g -1h -1 monoterpenes, A 1,8-cineol, A caryophyllene A MBO A
Fig. 4. The effect of the debudding of branch A on the emission potential of total monoterpenes,
BGD
2, 1697–1717, 2005 Mono- and sesquiterpene emission rates of Scots pine H. Hakola et al. Title Page Abstract Introduction Conclusions References Tables Figures J I J I Back CloseFull Screen / Esc
Print Version Interactive Discussion EGU Branch A 0 100 200 300 400 500 600 700 800 2. 7. 04 5. 7. 04 6. 7. 04 8. 7. 04 9. 7. 04 16 .7 .0 4 19 .7 .0 4 20 .7 .0 4 21 .7 .0 4 22 .7 .0 4 23 .7 .0 4 26 .7 .0 4 27 .7 .0 4 30 .0 7. 04 E m is si on ra te , n g g -1 h -1 b-Caryophyllene Model Branch B 0 50 100 150 200 250 01 .0 7. 04 01 .0 7. 04 02 .0 7. 04 05 .0 7. 04 07 .0 7. 04 8. 7. 04 13 .7 .0 4 15 .7 .0 4 16 .7 .0 4 20 .7 .0 4 21 .7 .0 4 23 .7 .0 4 26 .7 .0 4 27 .7 .0 4 30 .0 7. 04 E m is si on ra te , n g g -1 h -1 b-Caryophyllene Model
Fig. 5. Measured and modelled β-caryophyllene emission rates in Hyyti ¨al ¨a in July 2004. The
modeled emissions were obtained by a linear regression fit of the temperature dependent emis-sion algorithm of Guenther et al. (1993) to the measured data.