HAL Id: inserm-02481280
https://www.hal.inserm.fr/inserm-02481280
Submitted on 17 Feb 2020
HAL is a multi-disciplinary open access
archive for the deposit and dissemination of
sci-entific research documents, whether they are
pub-lished or not. The documents may come from
teaching and research institutions in France or
abroad, or from public or private research centers.
L’archive ouverte pluridisciplinaire HAL, est
destinée au dépôt et à la diffusion de documents
scientifiques de niveau recherche, publiés ou non,
émanant des établissements d’enseignement et de
recherche français ou étrangers, des laboratoires
publics ou privés.
Distributed under a Creative Commons Attribution| 4.0 International License
hypertension among treated individuals-the
CONSTANCES population-based study
Michelle Cherfan, Alexandre Vallée, Sofiane Kab, Pascale Salameh, Marcel
Goldberg, Marie Zins, Jacques Blacher
To cite this version:
Michelle Cherfan, Alexandre Vallée, Sofiane Kab, Pascale Salameh, Marcel Goldberg, et al..
Un-healthy behaviors and risk of uncontrolled hypertension among treated individuals-the CONSTANCES
population-based study.
Scientific Reports, Nature Publishing Group, 2020, 10 (1), pp.1925.
Unhealthy behaviors and risk
of uncontrolled hypertension
among treated individuals-the
conStAnceS population-based
study
Michelle cherfan
1,2,8, Alexandre Vallée
3,4,8, Sofiane Kab
5, Pascale Salameh
6,7,
Marcel Goldberg
3,5, Marie Zins
3,5& Jacques Blacher
1,3,4*From an epidemiological standpoint, quantifying the individual and the combined effect of lifestyle factors on uncontrolled blood pressure (BP) deserves further evaluation. We aimed to examine the individual and combined associations between unhealthy behaviors and uncontrolled hypertension among treated hypertensive adults. cross-sectional analysis was conducted using data from CONSTANCES, an ongoing French population-based cohort study. Uncontrolled BP was defined as mean systolic Bp ≥140 mmHg and/or mean diastolic BP ≥90 mmHg. Unhealthy behaviors were considered as heavy alcohol consumption, low or medium adherence to dietary recommendations, sedentary physical activity level, and overweight. A total of 10,710 hypertensive treated volunteer participants were included and 56.1% had uncontrolled hypertension; of them, 2.0%, 24.5%, 54.0% and 19.5% exhibited 0, 1, 2 or ≥3 unhealthy behaviors respectively. In men, there was an increased odds of uncontrolled hypertension with heavy alcohol drinking compared to light-or-never (adjusted odds ratio 1.34, 95% CI 1.10–1.63), with low as well as with medium adherence to dietary recommendations compared to high (p < 0.05 for both), and with overweight or obesity compared to a normal body mass index (p ≤ 0.001 for both). In addition, men reporting a combination of ≥3 unhealthy behaviors compared to none, had an increased odds of hypertension of 1.67 (95% CI 1.09–2.53). Unhealthy behaviors described as, heavy alcohol consumption, non-adherence to dietary recommendations and overweight are associated with uncontrolled hypertension, at the individual and combined level, and particularly in men. Improvement of modifiable lifestyle factors could offer considerable benefits in the management of hypertension.
Arterial hypertension is a global public health issue affecting more than 1 billion individuals worldwide and caus-ing an estimated ten million deaths every year1. Despite the availability of efficient and well-tolerated medications
and widespread public health efforts to treat individuals with hypertension, inadequate blood pressure (BP) con-trol is frequently reported among treated hypertensive individuals, and contributes significantly to increased risk of cardiovascular disease (CVD), stroke and chronic kidney disease (CKD)2.
A number of epidemiological studies commonly reported a high prevalence rate of uncontrolled hyperten-sion at the 140/90 mmHg threshold; in the United States, data analysis from the National Health and Nutrition Examination Survey (NHANES) found that among treated individuals around 45% had uncontrolled BP3. Within
1Nutritional Epidemiology Research Unit (EREN), Inserm U1153, Inra U1125, Cnam, Crnh, Paris 13 University
Sorbonne Paris Cite, Bobigny, France. 2Faculty of Pharmacy, Lebanese International University, Beirut, Lebanon. 3Faculty of Medicine, Paris-Descartes University, Paris, France. 4Diagnosis and Therapeutic Center, Hypertension
and Cardiovascular Prevention Unit, Hôtel-Dieu Hospital; AP-HP, Paris, France. 5Population-based Epidemiological
Cohorts Unit, Inserm, UMS011, Villejuif, France. 6Faculty of Public Health, Lebanese University, Fanar, Lebanon. 7Institut National de Santé Publique, Epidémiologie Clinique et Toxicologie (INSPECT-LB), Beirut, Lebanon. 8These
authors contributed equally: Michelle Cherfan and Alexandre Vallée. *email: jacques.blacher@aphp.fr
Europe, BP control rate among those treated reached 40% in England, 30% in Germany, 28% in Italy, 19% in Spain and 21% in Sweden4. Similarly, the estimated prevalence of hypertension in France is 31% and 51.3% of
hypertensive treated patients are not controlled5.
A broad range of factors have been identified that contribute to poor BP control. These include, physician inertia (i.e. lack of therapeutic action when the patient’s BP is uncontrolled)6, deficiencies of healthcare systems
in their global approach to chronic diseases7 and low adherence to treatment including antihypertensive
pre-scriptions and lifestyle changes8. In addition, factors such as socio-economic characteristics and poor lifestyle
behaviors have been described as predictors of poor BP control9. Studies suggest that unhealthy lifestyle behaviors
including heavy alcohol drinking, lack of physical activity, poor dietary habits and overweight may contribute to inadequate BP control among hypertensive treated individuals9,10. Alternatively, lifestyle changes were associated
with decreased BP among hypertensive individuals;11,12 Appel et al., reported that behavioral interventions
com-prising increased physical activity, limitation of dietary sodium intake, reduced alcohol consumption, and weight loss, reduced systolic BP by 12.5 mmHg and diastolic BP by 5.8 mmHg12.
Several lifestyle modifications or non-pharmacological approaches are widely recommended in worldwide guidelines for the management and prevention of hypertension. These interventions target dietary habits, salt intake, potassium intake, alcohol consumption, physical activity and weight. However the quantitative or qualita-tive targets for each of these measures differ across the guidelines13,14. This heterogeneity makes their promotion
more challenging and justifies the need to conduct further studies evaluating their impact on different popula-tions. In fact, these recommendations emphasize lifestyle changes based on intervention trials that were especially effective in pre- or hypertensive individuals; hence, the study of their effect in terms of improving BP control in hypertensive treated individuals remains necessary.
As such, from an epidemiological perspective, examining the quantitative effect of unhealthy lifestyle factors on uncontrolled hypertension, at the individual and combined level, warrants further evaluation. The French nationwide large population-based study, CONSTANCES15, which is designed to contribute to the development
of epidemiologic research, serve as an opportunity to provide additional data on this subject. Hence, this ancil-lary study was conducted to evaluate the individual and collective relationship between unhealthy behaviors, particularly, heavy alcohol consumption, low physical activity, non-adherence to dietary recommendations, and overweight, with uncontrolled hypertension. We aimed to assess the quantitative extent to which modifiable life-style factors are determinants of uncontrolled hypertension in order to assess the magnitude of their effect in the management of hypertension, from a gender-based perspective.
Results
Baseline characteristics of study population.
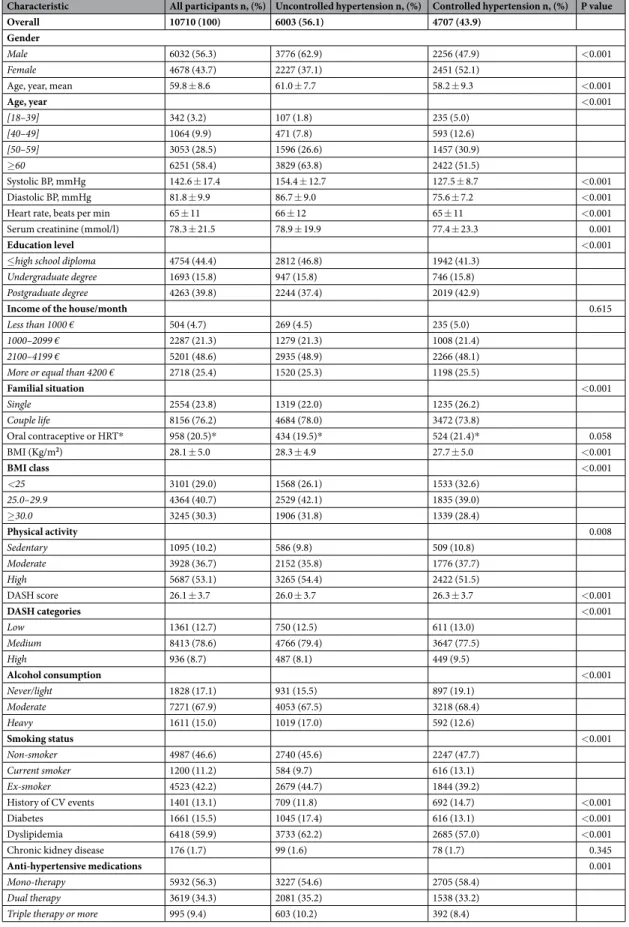
Table 1 presents the baseline characteristics of the stud-ied participants, which were compared among subjects with controlled and uncontrolled hypertension. The mean ± standard deviation (SD) age of the population was 59.8 ± 8.6. Unhealthy behaviors were prominent; the majority of the participants (91.3%) did not highly adhere to dietary recommendations, more than two third (70%) were overweight (body mass index ≥25), 15% consumed alcohol heavily and 10.2% were sedentary.Among the 10710 hypertensive treated participants 6003 had uncontrolled hypertension, reaching a preva-lence of poor BP control of 56.1%. Uncontrolled hypertension was more prevalent in men than in women (62.9% vs. 47.9% respectively, p < 0.001) and with increased age categories with the highest prevalence seen in those more than 65 years old (63.1%). After adjustment to age and gender, uncontrolled hypertension was more frequent in participants with lower education (46.8% vs. 41.3%, p < 0.001), living in couple (78% vs. 73.8%, p < 0.001), with diabetes (17.4% vs. 13.1%, p < 0.001) or with dyslipidemia (62.2% vs. 57%, p < 0.001). It was less common in those with history of CVD (11.8% vs. 14.7, p < 0.001). As for lifestyle factors, those who are overweight or obe-sity and those with heavy alcohol consumption have a significantly higher prevalence of uncontrolled hyperten-sion (p < 0.001 for both variables) while high dietary adherence is associated with lower frequency. Interestingly, inverse associations were seen with physical activity and smoking status, those with high-level physical activ-ity (p = 0.008) had more often uncontrolled hypertension, whereas current smokers seem to have more often controlled hypertension (p < 0.001). Globally, 56.3% of the study subjects were receiving one anti-hypertensive medication, while 34.3% were on dual therapy and 9.4% were using three medications or more; those with uncon-trolled hypertension were less likely to be receiving mono-therapy and more likely to be receiving dual or triple (or more) therapy (p = 0.001).
characteristics and unhealthy behaviors.
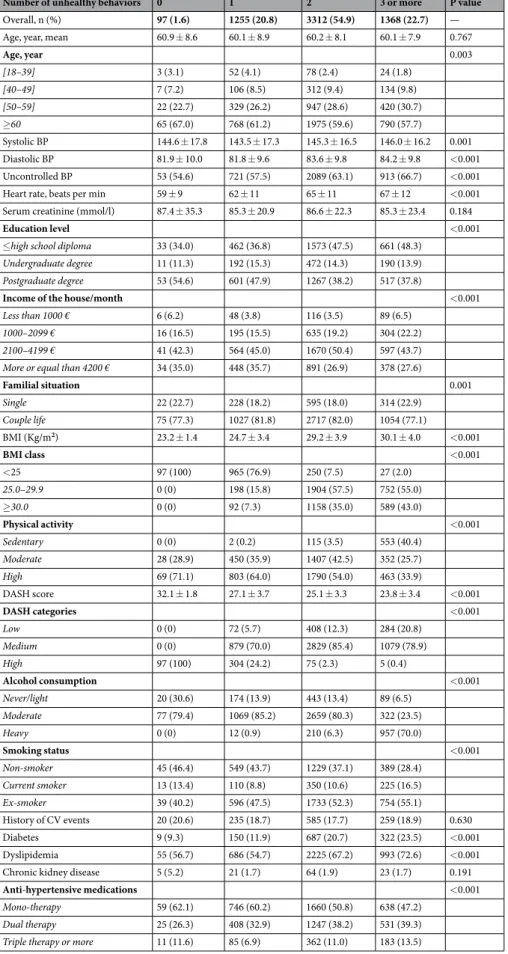
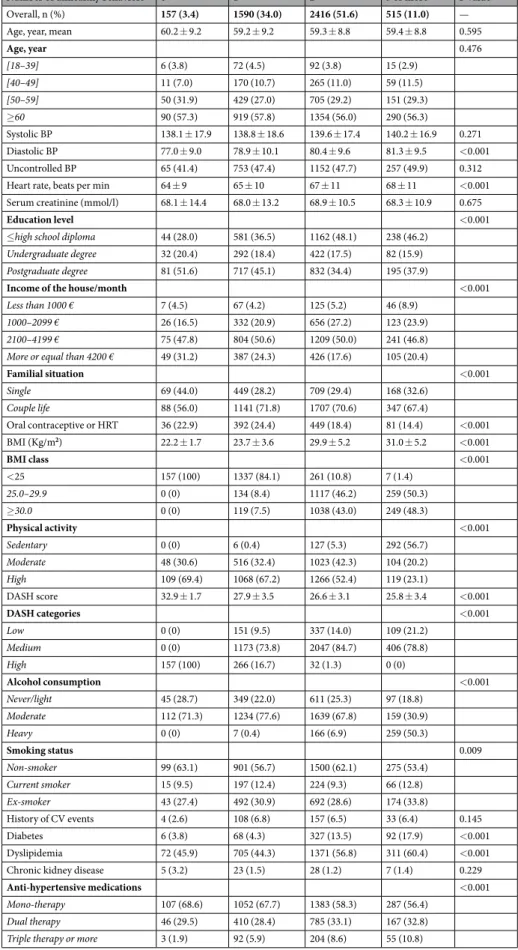
Figure 1 illustrates the frequency of unhealthy behavior(s) in participants with and without uncontrolled hypertension. Also, Tables 2 and 3 present, respectively, men and women’s characteristics according to the number of unhealthy behaviors. Globally, unhealthy behaviors were more commonly seen in men, whereby 22.7% reported having three or more unhealthy behaviors compared to 11% of women (p < 0.001). Among participants with uncontrolled hypertension, 2.0%, 24.5%, 54.0% and 19.5% exhibited 0, 1, 2 or ≥3 unhealthy behaviors, respectively. Between sexes, minimal differences were seen in the studied associations; age-adjusted analysis found an increasing number of unhealthy behaviors associated with a lower household monthly income (p < 0.001), lower education (p < 0.001), presence of dyslipidemia or diabetes (p trend < 0.001), and current smoking status (p < 0.001).Uncontrolled Bp and unhealthy behaviors.
The association between uncontrolled hypertension and dietary adherence, physical activity, body mass index (BMI), alcohol consumption and the number of unhealthy behavior is described in Table 4 for men and in a supplementary table for women. In men, there was no major difference between the associations found after adjustment for age, monthly income and education (model 1), and after additional adjustment for diabetes and dyslipidemia (model 2). In other words, associations found to be significant in model 1 remained significant in model 2. However, in women, the association between individualCharacteristic All participants n, (%) Uncontrolled hypertension n, (%) Controlled hypertension n, (%) P value
Overall 10710 (100) 6003 (56.1) 4707 (43.9)
Gender
Male 6032 (56.3) 3776 (62.9) 2256 (47.9) <0.001
Female 4678 (43.7) 2227 (37.1) 2451 (52.1)
Age, year, mean 59.8 ± 8.6 61.0 ± 7.7 58.2 ± 9.3 <0.001
Age, year <0.001 [18–39] 342 (3.2) 107 (1.8) 235 (5.0) [40–49] 1064 (9.9) 471 (7.8) 593 (12.6) [50–59] 3053 (28.5) 1596 (26.6) 1457 (30.9) ≥60 6251 (58.4) 3829 (63.8) 2422 (51.5) Systolic BP, mmHg 142.6 ± 17.4 154.4 ± 12.7 127.5 ± 8.7 <0.001 Diastolic BP, mmHg 81.8 ± 9.9 86.7 ± 9.0 75.6 ± 7.2 <0.001
Heart rate, beats per min 65 ± 11 66 ± 12 65 ± 11 <0.001
Serum creatinine (mmol/l) 78.3 ± 21.5 78.9 ± 19.9 77.4 ± 23.3 0.001
Education level <0.001
≤high school diploma 4754 (44.4) 2812 (46.8) 1942 (41.3)
Undergraduate degree 1693 (15.8) 947 (15.8) 746 (15.8)
Postgraduate degree 4263 (39.8) 2244 (37.4) 2019 (42.9)
Income of the house/month 0.615
Less than 1000 € 504 (4.7) 269 (4.5) 235 (5.0)
1000–2099 € 2287 (21.3) 1279 (21.3) 1008 (21.4)
2100–4199 € 5201 (48.6) 2935 (48.9) 2266 (48.1)
More or equal than 4200 € 2718 (25.4) 1520 (25.3) 1198 (25.5)
Familial situation <0.001 Single 2554 (23.8) 1319 (22.0) 1235 (26.2) Couple life 8156 (76.2) 4684 (78.0) 3472 (73.8) Oral contraceptive or HRT* 958 (20.5)* 434 (19.5)* 524 (21.4)* 0.058 BMI (Kg/m2) 28.1 ± 5.0 28.3 ± 4.9 27.7 ± 5.0 <0.001 BMI class <0.001 <25 3101 (29.0) 1568 (26.1) 1533 (32.6) 25.0–29.9 4364 (40.7) 2529 (42.1) 1835 (39.0) ≥30.0 3245 (30.3) 1906 (31.8) 1339 (28.4) Physical activity 0.008 Sedentary 1095 (10.2) 586 (9.8) 509 (10.8) Moderate 3928 (36.7) 2152 (35.8) 1776 (37.7) High 5687 (53.1) 3265 (54.4) 2422 (51.5) DASH score 26.1 ± 3.7 26.0 ± 3.7 26.3 ± 3.7 <0.001 DASH categories <0.001 Low 1361 (12.7) 750 (12.5) 611 (13.0) Medium 8413 (78.6) 4766 (79.4) 3647 (77.5) High 936 (8.7) 487 (8.1) 449 (9.5) Alcohol consumption <0.001 Never/light 1828 (17.1) 931 (15.5) 897 (19.1) Moderate 7271 (67.9) 4053 (67.5) 3218 (68.4) Heavy 1611 (15.0) 1019 (17.0) 592 (12.6) Smoking status <0.001 Non-smoker 4987 (46.6) 2740 (45.6) 2247 (47.7) Current smoker 1200 (11.2) 584 (9.7) 616 (13.1) Ex-smoker 4523 (42.2) 2679 (44.7) 1844 (39.2) History of CV events 1401 (13.1) 709 (11.8) 692 (14.7) <0.001 Diabetes 1661 (15.5) 1045 (17.4) 616 (13.1) <0.001 Dyslipidemia 6418 (59.9) 3733 (62.2) 2685 (57.0) <0.001
Chronic kidney disease 176 (1.7) 99 (1.6) 78 (1.7) 0.345
Anti-hypertensive medications 0.001
Mono-therapy 5932 (56.3) 3227 (54.6) 2705 (58.4)
Dual therapy 3619 (34.3) 2081 (35.2) 1538 (33.2)
Triple therapy or more 995 (9.4) 603 (10.2) 392 (8.4)
Table 1. Frequency of uncontrolled hypertension according to characteristics of participants. Data are mean ±SD for quantitative variables or percent for categorical. P from logistic regression model adjusted for age and sex. *Frequency among women only. Abbreviations: BMI, body mass index (Kg/m2); BP, blood pressure;
CV, cardiovascular; DASH, dietary approach to stop hypertension; HRT, hormone replacement therapy; SD, standard deviation.
unhealthy lifestyle factors and uncontrolled hypertension did not achieve statistical significance and is available in supplementary table 1.
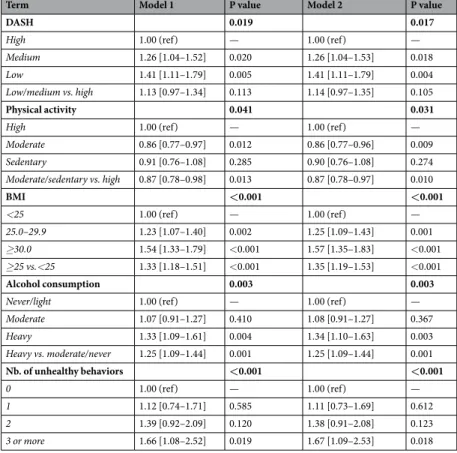
Regarding dietary adherence, men reporting low or medium dietary adherence had a 1.26-fold (adjusted odds ration (ORa) 1.26, 95% confidence interval (CI) 1.04–1.53) and 1.41-fold (ORa 1.41, 95% CI 1.11–1.79) increase of the odds of uncontrolled hypertension compared to those with high dietary adherence. Similarly, the odds of uncontrolled hypertension increased by 1.25-fold (1.09–1.43) and 1.57-fold (1.35–1.83) in overweight and obese men, respectively, compared to a normal BMI. In addition, there was a significant association between alcohol consumption and uncontrolled hypertension (p = 0.003); men consuming alcohol heavily had an increase of the odds of uncontrolled hypertension compared to light/never drinkers by 1.34-fold (ORa 1.34, 95% CI 1.10– 1.63). The association remained significant when dichotomizing the variable and comparing heavy drinking to moderate/light drinking (ORa 1.35, 95% CI 1.09–1.44; p = 0.01). In addition there was a significantly increasing age-adjusted mean systolic BP across light, moderate and heavy drinking in both sexes: in women the mean sys-tolic BP ± SD across categories was 134.6 ± 4.8, 135.5 ± 4.2 and 136.1 ± 4.2, respectively (p < 0.001) and in men it was 134.9 ± 4.6, 135.7 ± 4.0 and 136.4 ± 3.6, respectively (p < 0.001). As for physical activity, there was an unex-pected inverse relationship between sedentary level physical activity and uncontrolled hypertension. Moreover, the prevalence of uncontrolled hypertension increased with the number of unhealthy lifestyle factors in men only (p < 0.001). Those reporting three or more unhealthy behaviors had 1.67-fold (1.09–2.53) increase of the odds of uncontrolled hypertension.
Discussion
Findings of our study show, from a population-based perspective, that modifiable unhealthy lifestyle factors such as heavy alcohol consumption, overweight and non-adherence to dietary recommendations were associated with increased risk of uncontrolled hypertension in hypertensive treated individuals. The association was significant in men only, but even after adjustment for socio-demographic characteristics and cardiovascular risk factors. Also, a dose-effect relationship was noticeable by increased odds of uncontrolled hypertension with higher number of unhealthy behaviors; compared to none, three or four unhealthy lifestyle factors had 1.7-fold increased odds of uncontrolled hypertension in men. To our knowledge, these results are among the few to estimate the quantitative Figure 1. Proportion of subjects by number of unhealthy behaviors stratified by sex.
Number of unhealthy behaviors 0 1 2 3 or more P value
Overall, n (%) 97 (1.6) 1255 (20.8) 3312 (54.9) 1368 (22.7) —
Age, year, mean 60.9 ± 8.6 60.1 ± 8.9 60.2 ± 8.1 60.1 ± 7.9 0.767
Age, year 0.003 [18–39] 3 (3.1) 52 (4.1) 78 (2.4) 24 (1.8) [40–49] 7 (7.2) 106 (8.5) 312 (9.4) 134 (9.8) [50–59] 22 (22.7) 329 (26.2) 947 (28.6) 420 (30.7) ≥60 65 (67.0) 768 (61.2) 1975 (59.6) 790 (57.7) Systolic BP 144.6 ± 17.8 143.5 ± 17.3 145.3 ± 16.5 146.0 ± 16.2 0.001 Diastolic BP 81.9 ± 10.0 81.8 ± 9.6 83.6 ± 9.8 84.2 ± 9.8 <0.001 Uncontrolled BP 53 (54.6) 721 (57.5) 2089 (63.1) 913 (66.7) <0.001
Heart rate, beats per min 59 ± 9 62 ± 11 65 ± 11 67 ± 12 <0.001
Serum creatinine (mmol/l) 87.4 ± 35.3 85.3 ± 20.9 86.6 ± 22.3 85.3 ± 23.4 0.184
Education level <0.001
≤high school diploma 33 (34.0) 462 (36.8) 1573 (47.5) 661 (48.3)
Undergraduate degree 11 (11.3) 192 (15.3) 472 (14.3) 190 (13.9)
Postgraduate degree 53 (54.6) 601 (47.9) 1267 (38.2) 517 (37.8)
Income of the house/month <0.001
Less than 1000 € 6 (6.2) 48 (3.8) 116 (3.5) 89 (6.5)
1000–2099 € 16 (16.5) 195 (15.5) 635 (19.2) 304 (22.2)
2100–4199 € 41 (42.3) 564 (45.0) 1670 (50.4) 597 (43.7)
More or equal than 4200 € 34 (35.0) 448 (35.7) 891 (26.9) 378 (27.6)
Familial situation 0.001 Single 22 (22.7) 228 (18.2) 595 (18.0) 314 (22.9) Couple life 75 (77.3) 1027 (81.8) 2717 (82.0) 1054 (77.1) BMI (Kg/m2) 23.2 ± 1.4 24.7 ± 3.4 29.2 ± 3.9 30.1 ± 4.0 <0.001 BMI class <0.001 <25 97 (100) 965 (76.9) 250 (7.5) 27 (2.0) 25.0–29.9 0 (0) 198 (15.8) 1904 (57.5) 752 (55.0) ≥30.0 0 (0) 92 (7.3) 1158 (35.0) 589 (43.0) Physical activity <0.001 Sedentary 0 (0) 2 (0.2) 115 (3.5) 553 (40.4) Moderate 28 (28.9) 450 (35.9) 1407 (42.5) 352 (25.7) High 69 (71.1) 803 (64.0) 1790 (54.0) 463 (33.9) DASH score 32.1 ± 1.8 27.1 ± 3.7 25.1 ± 3.3 23.8 ± 3.4 <0.001 DASH categories <0.001 Low 0 (0) 72 (5.7) 408 (12.3) 284 (20.8) Medium 0 (0) 879 (70.0) 2829 (85.4) 1079 (78.9) High 97 (100) 304 (24.2) 75 (2.3) 5 (0.4) Alcohol consumption <0.001 Never/light 20 (30.6) 174 (13.9) 443 (13.4) 89 (6.5) Moderate 77 (79.4) 1069 (85.2) 2659 (80.3) 322 (23.5) Heavy 0 (0) 12 (0.9) 210 (6.3) 957 (70.0) Smoking status <0.001 Non-smoker 45 (46.4) 549 (43.7) 1229 (37.1) 389 (28.4) Current smoker 13 (13.4) 110 (8.8) 350 (10.6) 225 (16.5) Ex-smoker 39 (40.2) 596 (47.5) 1733 (52.3) 754 (55.1) History of CV events 20 (20.6) 235 (18.7) 585 (17.7) 259 (18.9) 0.630 Diabetes 9 (9.3) 150 (11.9) 687 (20.7) 322 (23.5) <0.001 Dyslipidemia 55 (56.7) 686 (54.7) 2225 (67.2) 993 (72.6) <0.001
Chronic kidney disease 5 (5.2) 21 (1.7) 64 (1.9) 23 (1.7) 0.191
Anti-hypertensive medications <0.001
Mono-therapy 59 (62.1) 746 (60.2) 1660 (50.8) 638 (47.2)
Dual therapy 25 (26.3) 408 (32.9) 1247 (38.2) 531 (39.3)
Triple therapy or more 11 (11.6) 85 (6.9) 362 (11.0) 183 (13.5)
Table 2. Men’s characteristics according to the number of unhealthy behaviors. Data are mean ± SD for quantitative variables or percent for categorical. P from logistic regression model adjusted for age.
Abbreviations: BMI, body mass index (Kg/m2); BP, blood pressure; CV, cardiovascular; DASH, dietary approach
Number of unhealthy behaviors 0 1 2 3 or more P value
Overall, n (%) 157 (3.4) 1590 (34.0) 2416 (51.6) 515 (11.0) —
Age, year, mean 60.2 ± 9.2 59.2 ± 9.2 59.3 ± 8.8 59.4 ± 8.8 0.595
Age, year 0.476 [18–39] 6 (3.8) 72 (4.5) 92 (3.8) 15 (2.9) [40–49] 11 (7.0) 170 (10.7) 265 (11.0) 59 (11.5) [50–59] 50 (31.9) 429 (27.0) 705 (29.2) 151 (29.3) ≥60 90 (57.3) 919 (57.8) 1354 (56.0) 290 (56.3) Systolic BP 138.1 ± 17.9 138.8 ± 18.6 139.6 ± 17.4 140.2 ± 16.9 0.271 Diastolic BP 77.0 ± 9.0 78.9 ± 10.1 80.4 ± 9.6 81.3 ± 9.5 <0.001 Uncontrolled BP 65 (41.4) 753 (47.4) 1152 (47.7) 257 (49.9) 0.312
Heart rate, beats per min 64 ± 9 65 ± 10 67 ± 11 68 ± 11 <0.001
Serum creatinine (mmol/l) 68.1 ± 14.4 68.0 ± 13.2 68.9 ± 10.5 68.3 ± 10.9 0.675
Education level <0.001
≤high school diploma 44 (28.0) 581 (36.5) 1162 (48.1) 238 (46.2)
Undergraduate degree 32 (20.4) 292 (18.4) 422 (17.5) 82 (15.9)
Postgraduate degree 81 (51.6) 717 (45.1) 832 (34.4) 195 (37.9)
Income of the house/month <0.001
Less than 1000 € 7 (4.5) 67 (4.2) 125 (5.2) 46 (8.9)
1000–2099 € 26 (16.5) 332 (20.9) 656 (27.2) 123 (23.9)
2100–4199 € 75 (47.8) 804 (50.6) 1209 (50.0) 241 (46.8)
More or equal than 4200 € 49 (31.2) 387 (24.3) 426 (17.6) 105 (20.4)
Familial situation <0.001 Single 69 (44.0) 449 (28.2) 709 (29.4) 168 (32.6) Couple life 88 (56.0) 1141 (71.8) 1707 (70.6) 347 (67.4) Oral contraceptive or HRT 36 (22.9) 392 (24.4) 449 (18.4) 81 (14.4) <0.001 BMI (Kg/m2) 22.2 ± 1.7 23.7 ± 3.6 29.9 ± 5.2 31.0 ± 5.2 <0.001 BMI class <0.001 <25 157 (100) 1337 (84.1) 261 (10.8) 7 (1.4) 25.0–29.9 0 (0) 134 (8.4) 1117 (46.2) 259 (50.3) ≥30.0 0 (0) 119 (7.5) 1038 (43.0) 249 (48.3) Physical activity <0.001 Sedentary 0 (0) 6 (0.4) 127 (5.3) 292 (56.7) Moderate 48 (30.6) 516 (32.4) 1023 (42.3) 104 (20.2) High 109 (69.4) 1068 (67.2) 1266 (52.4) 119 (23.1) DASH score 32.9 ± 1.7 27.9 ± 3.5 26.6 ± 3.1 25.8 ± 3.4 <0.001 DASH categories <0.001 Low 0 (0) 151 (9.5) 337 (14.0) 109 (21.2) Medium 0 (0) 1173 (73.8) 2047 (84.7) 406 (78.8) High 157 (100) 266 (16.7) 32 (1.3) 0 (0) Alcohol consumption <0.001 Never/light 45 (28.7) 349 (22.0) 611 (25.3) 97 (18.8) Moderate 112 (71.3) 1234 (77.6) 1639 (67.8) 159 (30.9) Heavy 0 (0) 7 (0.4) 166 (6.9) 259 (50.3) Smoking status 0.009 Non-smoker 99 (63.1) 901 (56.7) 1500 (62.1) 275 (53.4) Current smoker 15 (9.5) 197 (12.4) 224 (9.3) 66 (12.8) Ex-smoker 43 (27.4) 492 (30.9) 692 (28.6) 174 (33.8) History of CV events 4 (2.6) 108 (6.8) 157 (6.5) 33 (6.4) 0.145 Diabetes 6 (3.8) 68 (4.3) 327 (13.5) 92 (17.9) <0.001 Dyslipidemia 72 (45.9) 705 (44.3) 1371 (56.8) 311 (60.4) <0.001
Chronic kidney disease 5 (3.2) 23 (1.5) 28 (1.2) 7 (1.4) 0.229
Anti-hypertensive medications <0.001
Mono-therapy 107 (68.6) 1052 (67.7) 1383 (58.3) 287 (56.4)
Dual therapy 46 (29.5) 410 (28.4) 785 (33.1) 167 (32.8)
Triple therapy or more 3 (1.9) 92 (5.9) 204 (8.6) 55 (10.8)
Table 3. Women’s characteristics according to the number of unhealthy behaviors. Data are mean ± SD for quantitative variables or percent for categorical. P from logistic regression model adjusted for age.
Abbreviations: BMI, body mass index (Kg/m2); BP, blood pressure; CV, cardiovascular; DASH, dietary approach
extent to which individual and combined unhealthy lifestyle factors influence the risk of uncontrolled hyperten-sion in pharmacologically treated patients.
Compared to a normal BMI, we found overweight and obesity to be strongly associated with uncontrolled hypertension in men, increasing its odds by 1.25-fold and 1.57-fold respectively. This association has been described elsewhere; one study in South Korea conducted on individuals being treated for hypertension and taking regularly their antihypertensive medications, found that overweight patients were less likely to have their BP under control compared with those whose body weight was normal (ORa 0.44; p < 0.05)9. Similarly, the
Framingham Heart Study reported that among treated subjects, increasing age, obesity and the presence of left ventricular hypertrophy were associated with lack of systolic BP control. The authors suggested that public health efforts should be directed at achieving goal BP levels especially in patients who are older, are overweight or have target organ damage16.
There was no significant association between physical activity and uncontrolled hypertension in women. While in men, surprisingly, the multivariable analysis models found a weak but significant inverse association between physical activity and uncontrolled hypertension, whereby moderate and moderate-to-sedentary physical activity level compared to high level (as reference) were negatively associated with uncontrolled hypertension. In general, this is not in accordance with results of observational studies that reported a strong relationship between physical activity and BP control. Ham and Young, found that low physical activity (compared to high level) to be associated with poor BP control among hypertensive treated individuals9. Other studies argued that moderate
intensity aerobic exercise lowers BP in patients with hypertension and reduces the need for antihypertensive medication17,18. Although a dose-dependent relationship was not seen in our study, yet we found a protective
rela-tionship between moderate level physical activity and uncontrolled hypertension. Several aspects of the physical activity score we used could explain our divergent results. In fact we calculated a score that is not commonly used or is reproducible in the literature, which could have led to an inadequate estimation of physical activity level. Moreover, the score does not consider the metabolic equivalent (MET) of the reported physical activity, resulting in a distinct classification. Further studies are necessary to assess this aspect.
Concerning adherence to dietary recommendations, low or medium adherence to the dietary approaches to stop hypertension (DASH)-diet was found to increase the odds of uncontrolled hypertension in men only. Few studies evaluated the association between a dietary approach and BP control in uncontrolled hyperten-sive individuals. One randomized controlled trial conducted on hypertenhyperten-sive patients with type 2 diabetes and uncontrolled hypertension, demonstrated that a DASH-diet combined with increased daily walking promotes a clinically relevant reduction in ambulatory BP monitoring19. On the other hand, most research studied the BP
Term Model 1 P value Model 2 P value
DASH 0.019 0.017
High 1.00 (ref) — 1.00 (ref) —
Medium 1.26 [1.04–1.52] 0.020 1.26 [1.04–1.53] 0.018
Low 1.41 [1.11–1.79] 0.005 1.41 [1.11–1.79] 0.004
Low/medium vs. high 1.13 [0.97–1.34] 0.113 1.14 [0.97–1.35] 0.105
Physical activity 0.041 0.031
High 1.00 (ref) — 1.00 (ref) —
Moderate 0.86 [0.77–0.97] 0.012 0.86 [0.77–0.96] 0.009 Sedentary 0.91 [0.76–1.08] 0.285 0.90 [0.76–1.08] 0.274 Moderate/sedentary vs. high 0.87 [0.78–0.98] 0.013 0.87 [0.78–0.97] 0.010 BMI <0.001 <0.001 <25 1.00 (ref) — 1.00 (ref) — 25.0–29.9 1.23 [1.07–1.40] 0.002 1.25 [1.09–1.43] 0.001 ≥30.0 1.54 [1.33–1.79] <0.001 1.57 [1.35–1.83] <0.001 ≥25 vs.<25 1.33 [1.18–1.51] <0.001 1.35 [1.19–1.53] <0.001 Alcohol consumption 0.003 0.003
Never/light 1.00 (ref) — 1.00 (ref) —
Moderate 1.07 [0.91–1.27] 0.410 1.08 [0.91–1.27] 0.367 Heavy 1.33 [1.09–1.61] 0.004 1.34 [1.10–1.63] 0.003 Heavy vs. moderate/never 1.25 [1.09–1.44] 0.001 1.25 [1.09–1.44] 0.001 Nb. of unhealthy behaviors <0.001 <0.001 0 1.00 (ref) — 1.00 (ref) — 1 1.12 [0.74–1.71] 0.585 1.11 [0.73–1.69] 0.612 2 1.39 [0.92–2.09] 0.120 1.38 [0.91–2.08] 0.123 3 or more 1.66 [1.08–2.52] 0.019 1.67 [1.09–2.53] 0.018
Table 4. Association between uncontrolled hypertension and the number of unhealthy behaviors in men. Abbreviations: BMI, body mass index (Kg/m2); DASH, dietary approach to stop hypertension. Model 1: logistic
regression model adjusted for age, education level, monthly income. Model 2: logistic regression model adjusted for age, education level, monthly income, diabetes, and dyslipidemia.
lowering effect of a DASH-diet in pre-hypertensive and hypertensive patients. For example, the DASH collabora-tive research group found that adopting a DASH-diet in patients with hypertension substantially lowers systolic and diastolic BP by 11.4 and 5.5 mmHg, respectively20, suggesting that such BP reductions can help in achieving
adequate BP control. Our study demonstrated that non-adherence to dietary recommendation is associated with uncontrolled hypertension, while measuring the extent of the effect of the association. Accordingly, our findings suggest that lifestyle modifications involving the adoption of a DASH-style diet offer an important approach in the treatment of hypertension.
We identified a strong association between heavy alcohol consumption and uncontrolled hypertension. Men who drank alcohol heavily had 1.34-fold increase in the odds of poor BP control. This association has been reported in previous studies. Ham et al. reported that heavy alcohol consumption defined as consumption of more than 60 g for men and 40 g for women during a single drinking session, was independently associated with poor BP control at the 140/90 threshold in a sample of hypertensive treated South Koreans9. In addition, a
number of studies described an apparent and direct association between heavy alcohol intake and elevated BP21,22
that can result in exceeding recommended BP goals. One Japanese study found that in heavy drinkers, systolic and diastolic BP was 2.3/2.0 mmHg higher in heavy drinkers than in non-drinkers21. Differences between
gen-der in drinking behavior, pattern and beverage choice could have influenced the lack of association in women. Nevertheless, an association between heavy drinking and high BP was once again demonstrated, supporting limitation of alcohol consumption recommendation, in the hypertensive treated population.
We found a dose-effect relationship between the number of unhealthy behaviors and uncontrolled hyper-tension; the likelihood of uncontrolled hypertension increased nearly linearly with 1, 2, 3 or more, unhealthy lifestyle factors, but reached statistical significance with 3 or more factors. Few epidemiological studies evaluated the role of modifiable lifestyle factors on BP control among treated individuals, or assessed their combined effect. In fact, collective unhealthy behaviors may have synergistic effect on BP control, emphasizing the importance of studying their combined effect. In patients with uncontrolled hypertension and type 2 diabetes, the combination of increasing physical activity and following a DASH-diet had a major reduction in systolic BP values of approx-imately 15 mmHg, as compared with a reduction of 3 mmHg in the control group19. Importantly, with such BP
reductions, more than half of the patients in the intervention group reached the recommended goals for daytime ambulatory BP monitoring19. BP reductions with a combination of lifestyle factors were discussed in previous
studies on hypertensive patients, but there was no reference to the use of anti-hypertensive medications. For example, a systematic review of randomized controlled trials on patients with elevated blood pressure, reported BP reductions of 5.5 mmHg after a combination of interventions including physical activity, diet and weight loss, compared to 5.0 mmHg for improved diet, 4.6 mmHg for exercise and 3.5 mmHg for alcohol restriction23. In a
recent separate analysis, we evaluated the extent to which unhealthy behavior influence the development of hyper-tension in the general population, and found that in both sexes, unhealthy behavior (as described in this study) significantly increased the odds of hypertension. We also reported that a combination of two and three-or-more unhealthy behaviors resulted in an increased odds of hypertension by 1.77-fold and 2.29-fold respectively in men, and by 1.71-fold and 2.14-fold respectively in women24. Our current study show that a combination of unhealthy
behavior is independently associated with uncontrolled hypertension in hypertensive treated individuals. These findings along with the previous ones24 further support the important influence of lifestyle factors on high BP, in
different populations and regardless of the presence of other risk factors. However, when comparing both studies, the magnitude of the effect of this association appears stronger on the development of hypertension than on BP control, suggesting that other factors should also be considered when evaluating determinants of BP control in individuals pharmacologically treated for hypertension.
Our study also pointed out gender differences as to these associations. Few observational studies evaluated the determinants of uncontrolled hypertension using a gender stratified analysis9,25 and they were not particularly
on unhealthy behaviors. Discrepancy between sexes could be explained by differences in lifestyle habits between men and women as well as to the influence of other confounding factors6–8 such as other socioeconomic factors
(employment, marital status), other diseases (chronic kidney disease) other behavioral factors (such as salt intake and stress) and adherence to anti-hypertensive medications. In addition, some data suggest that sex-related char-acteristics such as the level of sex hormones may influence the results26. Although further research is needed to
clarify this difference, nevertheless adopting a global healthy lifestyle is important for prevention of cardiovascu-lar diseases and should be encouraged in the general population14.
Lastly, age-and-gender-adjusted results found current smoking to be associated with decreased prevalence of uncontrolled hypertension. Epidemiological studies describe discrepancy with regards to effect of smoking on uncontrolled BP; some studies reported smoking to negatively influence BP control27,28, while others found no
association9,25,29 and showed that office BP is not lowered by smoking cessation30. Further research can help yield
more conclusive results. Nevertheless, smoking is an unhealthy behavior and a major risk of CVD and cancer; smoking cessation recommendations should be provided to all hypertensive individuals for the prevention of CVD including stroke, myocardial infarction and peripheral artery disease1,2,14.
The main strength of our study is using data from CONSTANCES, which was designed adopting a population-based method including a large randomly selected sample of participants that ensures sufficient power. Moreover, BP measurements were collected following standardized protocols and data were gathered using different methods such as validated questionnaires and national databases, resulting in lack of missing information. Additionally, we explored the combined effect of unhealthy behaviors and performed an analy-sis stratified by sex. However, some limitations should be addressed. Reverse-causality bias is inherent in cross-sectional analyses, preventing the confirmation of a causal relationship between unhealthy behaviors and uncontrolled hypertension. In addition, our study might be subject to selection bias because of the selection effect related to voluntary participation, also because agricultural and self-employed workers were not included in CONSTANCES. Misclassification bias is also possible, since lifestyle behaviors were self-reported. Moreover,
the time frame between recent medication adjustment and BP measurement was not taken into consideration. In fact, antihypertensive medication is a confounding factor in BP measurements, with epidemiologic data on BP often compromised by the effects of antihypertensive medications31, and certainly recent changes. Nevertheless,
this is common in epidemiologic studies of cross-sectional design; prospective data from CONSTANCES can help in considering this point. Lastly, excessive salt intake is considered an unhealthy behavior, but we weren’t able to study its effect on uncontrolled hypertension because quantitative data on salt intake are not available since dietary habits were evaluated using a non-quantitative food frequency questionnaire.
In conclusion, findings of this study provide supportive evidence of the individual and combined effect of unhealthy behaviors on uncontrolled hypertension. Unhealthy lifestyle described as heavy alcohol drinking, non-adherence to dietary recommendations and overweight increased the likelihood of uncontrolled hyper-tension, which was further increased with a higher number of unhealthy factors. Our findings revealed that the associations were significant in men only, suggesting the presence of other factors influencing uncontrolled hypertension. Although further research is needed to clarify the reasons behind the gender-based differences, our findings contribute to epidemiologic data of utmost importance in the management of hypertension, especially in the presence of limited data on the effect of lifestyle factors on hypertension control. From a population-based perspective, our study advocates that public health strategies should promote improvement of modifiable behav-iors through a multidisciplinary lifestyle changes approach, which could offer considerable benefits in the treat-ment and control of hypertension, particularly in men.
Methods
Study design and study population.
Details concerning objectives and study design of the cohort CONSTANCES (http://www.constances.fr/index_EN.php) have been previously published15,32. Briefly,CONSTANCES is a prospective epidemiological cohort composed of randomly selected adult participants aged 18–69 years at inception affiliated with the French National Health Insurance Fund database (CNAM; General scheme which covers 85% of the general French population) following a sampling scheme stratified on age, gen-der, socioeconomic status and region of France.
Volunteers who agreed to participate in the study had to fill self-administered questionnaires and were invited to attend to one of the 22 selected health-screening centers (HSCs) to benefit from a comprehensive health exam-ination. They were also linked through French health administrative and national social databases. Through these different sources, social, demographic, health, behavioral, occupational, biological, and anthropometric data were collected. All the participants included in the CONSTANCES cohort have signed an informed consent form. This research follows the tenets of the Declaration of Helsinki and was approved by the National Data Protection Authority (Commission Nationale Informatique et Libertés; CNIL) and the Institutional Review Board of the National Institute for Medical Research and the local Committee for Persons Protection (Comité de Protection
des Personnes).
Study participants.
The present study is a cross-sectional analysis on participants who were known to have hypertension recorded by the physician or measured during the medical examination at the HSC and receiving antihypertensive medications. From a total of 87,808 volunteer participants recruited between February 2012 and January 2018 and to whom data was available through linkage with the health insurance administrative database, 10,764 subjects met the above definition and were eligible to be included in the current analysis. We excluded 54 participants with BMI <18kg/m2 and we therefore analyzed 10,710 hypertensive treated participants.Uncontrolled blood pressure.
BP measurements were done based on standardized operational procedures (SOPs)33 during the clinical examination at the HSC. Systolic BP and diastolic BP were measured using anauto-mated oscillometric sphygmomanometer, in each arm at 2 minutes interval and after 5 minutes of rest. The arm giving the highest systolic BP was considered the reference arm and a third BP measure was taken after 1 minute of rest, the average of these 2 measurements was considered. Uncontrolled BP was defined as mean systolic BP ≥140 mm Hg and/or mean diastolic BP ≥90 mm Hg34.
Behavioral risk factors definitions.
Lifestyle factors were assessed through validated self-administered questionnaires. They were described and classified based on a previous study evaluating the association between unhealthy behavior and risk of hypertension24. Similarly, unhealthy behavior was defined like in the originalstudy24. The lifestyle factors are presented also here.
Alcohol consumption was determined considering the quantity and type of alcoholic beverages consumed the
previous week35. We subsequently defined alcohol consumption as never/light (0–3 glass/week (0–30 g/week) for
men and 0–2 (0–20 g/week) for women), moderate (4–21 (40–210 g/week) glass/week for men and 3–14 (30– 140 g/week) for women) and heavy drinkers (>21 glass/week (>210 g/week) for men and >14 (>140 g/week) for women)36. Heavy drinking was considered an unhealthy behavior.
Physical activity was assessed through three questions that considered the frequency of transferring, leisure
time activity and sports37. We assigned 0, 1, or 2 points for each question based on an escalating frequency of
activity, then a score of 0–6 was calculated and physical activity level was classified as sedentary (0–2), moderately active (3–4) and highly active (5–6). Sedentary level was considered an unhealthy behavior37.
Dietary assessment was done through a validated 52-items food frequency questionnaire (FFQ) from which
a DASH score was constructed based on 8 food groups or nutrients for which consumption should be increased (fruits, vegetables, nuts and legumes, low-fat dairy, whole grains) or reduced (sodium, sweetened beverages, red and processed meats)38. Consumption of each dietary component was divided into quintiles, and
partici-pants’ intakes were assigned 1–5 points according to a gender-specific intake ranking38,39. Component scores
collapsed to tertiles for analysis; a higher tertile indicating a higher dietary quality, adherence to dietary rec-ommendations was subsequently categorized into low, medium and high. We considered low/medium dietary adherence an unhealthy behavior.
Body mass index (BMI, kg/m2) was calculated at the HSC, then categorized into three classes: normal (≤25 kg/
m2), overweight (25 kg/m2<BMI <30 kg/m2), and obese (≥30 kg/m2). We considered overweight/obese (BMI
>25 kg/m2) an unhealthy behavior.
Accordingly, participants could exhibit 0 (none), 1, 2, 3, or 4 unhealthy behaviors.
covariates.
Covariates were defined and classified as the original analysis24 and they included the following.Education level was collected according to the International Standard Classification of Education (ISCED)40 and
was then classified into three levels: High school diploma or less (≤13 years of education), undergraduate degree (14–16 years of education) and postgraduate degree (≥17 years of education). Marital status was categorized into couple life or single (including widowed or separated/divorced). Household monthly income was categorized into:<1000; 1000–2099; 2100–4199; ≥ 4200 euros per month.
Blood glucose, triglycerides and total cholesterol were measured by taking fasting blood samples at the HSC. Diabetes mellitus status was based on either receiving anti-diabetic medication or a fasting blood glucose concen-tration greater than or equal to 7 mmol/L. Dyslipidemia was defined as having a fasting plasma total-cholesterol or triglycerides level of ≥6.61 mmol/L (255 mg/dL) or >1.7 mmol/L (150 mg/dL) respectively. History of CV diseases was considered as any self-reported previous diagnosis of angina pectoris, myocardial infarction, cer-ebrovascular accident or peripheral artery disease14. Chronic kidney disease was defined as known proteinuria
or decreased renal function (creatinine clearance <60 ml/min calculated by the Cockroft-Gault equation) for more than 3 months41, or a chronic kidney disease diagnosed by biopsy or renal ultrasound and confirmed by a
nephrologist.
Statistical analysis.
Descriptive analysis was performed using counts and percentages or mean ± SD. Each characteristic was compared between subjects with controlled and uncontrolled hypertension using logistic regressions adjusted for age and sex. In addition, we compared characteristics of subjects according to the number of unhealthy behaviors using logistic regressions adjusted for age and stratified by sex. Also with logistic models, we estimated the association between uncontrolled hypertension and unhealthy behaviors. In a first step, models were adjusted for age, education and monthly income (model 1). In a second step, models were further adjusted for diabetes and dyslipidemia (model 2). Initially, we performed separate models for each unhealthy behavior using categorical variables and binary variables. Then, we examined the association between uncontrolled hyper-tension and the number of unhealthy behaviors (0- ≥ 3) independently associated with control of hyperhyper-tension. General Linear Model was used to study age-adjusted mean systolic BP across ascending number of unhealthy factors. Adjusted odds ratios (ORa) were presented along with 95% confidence interval (CI), all statistical analy-ses were performed with SAS 9.4 (SAS Institute) and p ≤ 0.05 was considered significant.Data availability
The datasets generated during and/or analyzed during the current study are available from the CONSTANCES principal investigator (marie.zins@inserm.fr) provided that the procedures described in the CONSTANCES Charter (http://www.constances.fr/charter) are fulfilled.
Received: 2 August 2019; Accepted: 19 December 2019; Published: xx xx xxxx
References
1. WHO. A global brief on Hypertension; Silent killer, global public health crisis, (World Heath Organisation, 2013).
2. Roger, V. L. et al. Heart disease and stroke statistics – 2012 update: a report from the American Heart Association. Circulation 125, e2–e220 (2012).
3. Centers for Disease Control and Prevention (CDC). Vital signs: awareness and treatment of uncontrolled hypertension among adults– United States, 2003–2010. MMWR Morb. Mortal. Wkly. Rep. 61, 703–709 (2012).
4. Wolf-Maier, K. et al. Hypertension treatment and control in five European countries, Canada, and the United States. Hypertension
43, 10–17 (2004).
5. Perrine, A.-L., Lecoffre, C., Blacher, J. & Olié, V. L’hypertension artérielle en France: prévalence, traitement et contrôle en 2015 et évolution depuis 2006. Bull. Epidemiol. Hebd. 10, 170–179 (2018).
6. Banegas, J. R. et al. Blood pressure control and physician management of hypertension in hospital hypertension units in Spain.
Hypertension 43, 1338–1344 (2004).
7. Lee, J. K., Grace, K. A. & Taylor, A. J. Effect of a pharmacy care program on medication adherence and persistence, blood pressure and low-density lipoprotein cholesterol: a randomized controlled trial. JAMA 296, 2563–2571 (2006).
8. Corrao, G. et al. Discontinuation of and changes in drug therapy for hypertension among newly treated patients: a population-based study in Italy. J. Hypertens. 26, 819–824 (2008).
9. Ham, O. K. & Yang, S. J. Lifestyle factors associated with blood pressure control among those taking antihypertensive medication.
Asia Pac. J. Public. Health 23, 485–495 (2011).
10. Stern, L.N. & Subrahmanyam, M.G. Patient Adherence to the Dietary Approaches to Stop Hypertension (DASH) Diet for Non-Primary English Speakers. Thesis, New York University, USA, 2009.
11. Baena, C. P. et al. Effects of lifestyle-related interventions on blood pressure in low and middle-income countries: systematic review and meta-analysis. J. Hypertens. 32, 961–973 (2014).
12. Appel, L. J. et al. Effects of comprehensive lifestyle modification on blood pressure control: main results of the PREMIER clinical trial. JAMA 289, 2083–2093 (2003).
13. Whelton, P. K. et al. 2017 ACC/AHA/AAPA/ABC/ACPM/AGS/APhA/ASH/ ASPC/NMA/PCNA guideline for the prevention, detection, evaluation, and management of high blood pressure in adults: a report of the American College of Cardiology/American Heart Association Task Force on Clinical Practice Guidelines. Hypertension 71, e13–e115 (2018).
15. Zins, M. et al. The CONSTANCES cohort: an open epidemiological laboratory. BMC Public. Health 10, 479 (2010).
16. Lloyd-Jones, D. M. et al. Differential control of systolic and diastolic blood pressure: factors associated with lack of blood pressure control in the community. Hypertension 36, 594–599 (2000).
17. Cleroux, J., Feldman, R. D. & Petrella, R. J. Lifestyle modifications to prevent and control hypertension. 4. Recommendations on physical exercise training. CMAJ 160, S21–S28 (1999).
18. Papademetriou, V. & Kokkinos, P. F. The role of exercise in the control of hypertension and cardiovascular risk. Curr. Opin. Nephrol.
Hypertens. 5, 459–462 (1996).
19. Paula, T. P. et al. Effects of the DASH Diet and Walking on Blood Pressure in Patients With Type 2 Diabetes and Uncontrolled Hypertension: A Randomized Controlled Trial. J. Clin. Hypertens. 17, 895–901 (2015).
20. Appel, L. J. et al. A clinical trial of the effects of dietary patterns on blood pressure. DASH Collaborative Research Group. N. Engl. J.
Med. 336, 1117–24 (1997).
21. Ohira, T. et al. Effects of habitual alcohol intake on ambulatory blood pressure, heart rate, and its variability among Japanese men.
Hypertension 53, 13–19 (2009).
22. Arkwright, P. D. et al. Effects of alcohol use and other aspects of lifestyle on blood pressure levels and prevalence of hypertension in a working population. Circulation 66, 60–66 (1982).
23. Dickinson, H. O. et al. Lifestyle interventions to reduce raised blood pressure: a systematic review of randomized controlled trials.
J. Hypertens. 24, 215–233 (2006).
24. Cherfan, M. et al. Unhealthy behavior and risk of hypertension: the CONSTANCES population-based cohort. J. Hypertens. 37, 2180–2189 (2019).
25. Farah, R. et al. Predictors of Uncontrolled Blood Pressure in Treated Hypertensive Individuals: First Population-Based Study in Lebanon. J. Clin. Hypertens. 18, 871–877 (2016).
26. Leblanc, V. et al. Differences between men and women in dietary intakes and metabolic profile in response to a 12-week nutritional intervention promoting the Mediterranean diet. J. Nutr. Sci. 4, e13 (2015).
27. Rosendo, I., Santiago, L. M. & Marques, M. Characteristics Associated with Uncontrolled Blood Pressure Among Portuguese Primary Care Patients with Type 2 Diabetes. Acta Med. Port. 30, 197–204 (2017).
28. Choudhary, R., Sharma, S. M., Kumari, V. & Gautam, D. Awareness, treatment adherence and risk predictors of uncontrolled hypertension at a tertiary care teaching hospital in Western India. Indian. Heart J. 68, S251–S252 (2016).
29. Asgedom, S. W., Gudina, E. K. & Desse, T. A. Assessment of Blood Pressure Control among Hypertensive Patients in Southwest Ethiopia. PLoS ONE 11, e0166432 (2016).
30. Primatesta, P., Falaschetti, E., Gupta, S., Marmot, M. G. & Poulter, N. R. Association between smoking and blood pressure: evidence from the health survey for England. Hypertension 37, 187–193 (2001).
31. Wu, J. et al. A summary of the effect of the results of antihypertensive medications on measured blood pressure. Am. J. Hypertension
18, 935–942 (2005).
32. Zins, M. & Goldberg, M. & the CONSTANCES team. The French CONSTANCES population-based cohort: design, inclusion and follow-up. Eur. J. Epidemiol. 30, 1317–1328 (2015).
33. Ruiz, F. et al. High quality standards for a large-scale prospective population-based observational cohort: Constances. BMC Public.
Health 16, 877 (2016).
34. Blacher, J. et al. Management of hypertension in adults: the 2013 French Society of Hypertension guidelines. Fundam. Clin.
Pharmacol. 28, 1–9 (2014).
35. Airagnes, G. et al. Job exposure to the public in relation with alcohol, tobacco and cannabis use: Findings from the CONSTANCES cohort study. PLoS One 13, e0196330 (2018).
36. WHO. International Guide for Monitoring Alcohol Consumption and Related Harm, (World Health Organization, 2000) 37. Merle, B. M. J. et al. Unhealthy behaviours and risk of visual impairment: The CONSTANCES population-based cohort. Sci. Rep. 8,
6569 (2018).
38. Fung, T. T. et al. Adherence to a DASH-style diet and risk of coronary heart disease and stroke in women. Arch. Intern. Med. 168, 713–720 (2008).
39. Karanja, N.M. et al. Descriptive characteristics of the dietary patterns used in the Dietary Approaches to Stop Hypertension Trial. J
Am Diet Assoc 357, S19-S27 (1999).
40. Schneider, S.L. The International Standard Classification of Education 2011. In Class and Stratification Analysis (Comparative Social
Research, Volume 30). (ed. Birkelund, G. E.) 1st edn, 365–79, (Emerald Group Publishing Limited, Bingley, 2013).
41. Kidney Disease: Improving Global Outcomes (KDIGO) CKD-MBD Update Work Group. KDIGO 2017 Clinical Practice Guideline Update for the Diagnosis, Evaluation, Prevention, and Treatment of Chronic Kidney Disease–Mineral and Bone Disorder (CKD-MBD). Kidney Int. Suppl. 7, 1–59 (2017).
Acknowledgements
We thank the UMS 11 Inserm-Versailles Saint Quentin en Yvelines University “Cohortes épidémiologiques en population” who designed and is in charge of the CONSTANCES Cohort Study. They also thank the “Caisse nationale d’assurance maladie des travailleurs salaries” (CNAMTS) and the “Centres d’examens de santé” of the French Social Security which are collecting a large part of the data, as well as ClinSearch, Asqualab and Eurocell in charge of the data quality control. The Constances Cohort Study was supported and funded by the Caisse nationale d’assurance maladie (CNAM). The Constances Cohort Study is an “Infrastructure nationale en Biologie et Santé” and benefits from a grant from ANR (ANR-11-INBS-0002) and from the Ministry of Research. Constances is also partly funded by MSD, AstraZeneca and Lundbeck.
Author contributions
M.Z. and M.G. obtained funding for the CONSTANCES study cohort and conducted the CONSTANCES study. M.C., A.V. and J.B. developed the research question. M.C., A.V. J.B. and P.S. contributed to the study design and analysis plan. S.K. and M.Z. acquired the data. A.V. performed the statistical analyses. M.C. drafted the manuscript. All authors critically revised the manuscript, gave final approval and agree to be accountable for all aspects of work ensuring integrity and accuracy.
competing interests
All authors have completed the ICMJE uniform disclosure form at http://www.icmje.org/coi_disclosure.pdf
(available on request from the corresponding author) and all authors declare no competing interests.
Additional information
Correspondence and requests for materials should be addressed to J.B.
Reprints and permissions information is available at www.nature.com/reprints.
Publisher’s note Springer Nature remains neutral with regard to jurisdictional claims in published maps and institutional affiliations.
Open Access This article is licensed under a Creative Commons Attribution 4.0 International License, which permits use, sharing, adaptation, distribution and reproduction in any medium or format, as long as you give appropriate credit to the original author(s) and the source, provide a link to the Cre-ative Commons license, and indicate if changes were made. The images or other third party material in this article are included in the article’s Creative Commons license, unless indicated otherwise in a credit line to the material. If material is not included in the article’s Creative Commons license and your intended use is not per-mitted by statutory regulation or exceeds the perper-mitted use, you will need to obtain permission directly from the copyright holder. To view a copy of this license, visit http://creativecommons.org/licenses/by/4.0/.