HAL Id: hal-01520318
https://hal.sorbonne-universite.fr/hal-01520318
Submitted on 10 May 2017
HAL is a multi-disciplinary open access
archive for the deposit and dissemination of sci-entific research documents, whether they are pub-lished or not. The documents may come from teaching and research institutions in France or abroad, or from public or private research centers.
L’archive ouverte pluridisciplinaire HAL, est destinée au dépôt et à la diffusion de documents scientifiques de niveau recherche, publiés ou non, émanant des établissements d’enseignement et de recherche français ou étrangers, des laboratoires publics ou privés.
Effects of in situ CO2 enrichment on Posidonia oceanica
epiphytic community composition and mineralogy
T. E. Cox, M. Nash, F. Gazeau, M. Déniel, E. Legrand, S. Alliouane, P.
Mahacek, A. Le Fur, Jean-Pierre Gattuso, S. Martin
To cite this version:
T. E. Cox, M. Nash, F. Gazeau, M. Déniel, E. Legrand, et al.. Effects of in situ CO2 enrichment on Posidonia oceanica epiphytic community composition and mineralogy. Marine Biology, Springer Verlag, 2017, 164 (5), pp.103. �10.1007/s00227-017-3136-7�. �hal-01520318�
Effects of in situ CO
2enrichment on Posidonia oceanica epiphytic community
1composition and mineralogy
2 3
T. E. Cox1*, M. Nash2, F. Gazeau1, M. Déniel3,4, E. Legrand3,4, S. Alliouane1, P. Mahacek1, A. 4
Le Fur1, J.-P. Gattuso1,5, S. Martin3,4 5
6
1 Sorbonne Universités, UPMC Univ Paris 06, CNRS-INSU,
7
Laboratoire d'Océanographie de Villefranche, 181 chemin du Lazaret, F-06230 Villefranche-sur-8
mer, France 9
2Research School of Physics, The Australian National University, Acton, Australian Capital
10
Territory 0200, Australia 11
3CNRS, UMR 7144, Station Biologique de Roscoff, Place Georges Teissier, Roscoff Cedex
12
29688, France 13
4Laboratoire Adaptation et Diversité en Milieu Marin, Sorbonne Universités, UPMC Univ. Paris
14
6, Station Biologique de Roscoff, Place Georges Teissier, Roscoff Cedex 29688, France 15
5Institute for Sustainable Development and International Relations, Sciences Po, 27 rue
16
Saint Guillaume, F-75007 Paris, France 17
18
*Corresponding author: erincox@hawaii.edu 19
Running page head: In situ CO2 enrichment on epiphytes
20
ABSTRACT: Alterations in seagrass epiphytic communities are expected under future ocean 21
acidification conditions, yet this hypothesis has been little tested in situ. A Free Ocean Carbon 22
Dioxide Enrichment (FOCE) system was used to lower pH by a ~ 0.3 unit offset within a 23
partially enclosed portion (1.7 m3) of a Posidonia oceanica meadow (11 m depth) between 21 24
June and 3 November 2014. Leaf epiphytic community composition (% cover) and bulk 25
epiphytic mineralogy were compared every four weeks within three treatments, located in the 26
same meadow: a pH-manipulated (experimental enclosure) and a control enclosure, as well as a 27
nearby ambient area. Percent coverage of invertebrate calcifiers and crustose coralline algae 28
(CCA) did not appear to be affected by the lowered pH. Furthermore, fleshy algae did not 29
proliferate at lowered pH. Only Foraminifera, which covered less than 3% of leaf surfaces, 30
declined in manner consistent with ocean acidification predictions. Bulk epiphytic magnesium 31
carbonate composition was similar between treatments and percentage of magnesium appeared 32
to increase from summer to autumn. CCA did not exhibit any visible skeleton dissolution or 33
mineral alteration at lowered pH and carbonate saturation state. Negative impacts from ocean 34
acidification on P. oceanica epiphytic communities were smaller than expected. Epiphytic 35
calcifiers were possibly protected from the pH treatment due to host plant photosynthesis inside 36
the enclosure where water flow is slowed. The more positive outcome than expected suggests 37
that calcareous members of epiphytic communities may find refuge in some conditions and be 38
resilient to environmentally-relevant changes in carbonate chemistry. 39
40
KEY WORDS: ocean acidification, seagrass–epiphyte interactions, calcifiers, magnesium 41
carbonate, coralline algae, Bryozoa, pH, remineralisation 42
43
Introduction
44
Seagrass leaves and rhizomes are colonized by taxonomically diverse animal and algal 45
representatives referred to as epiphytes following the definition of Steel and Wilson (2003). 46
Seagrass and epiphytes form meadows which are highly valued for the services they provide 47
(Hemminga and Duarte 2000). For example, they play a fundamental role in maintaining 48
populations of exploited fisheries (Jackson et al. 2015). In the Mediterranean Sea, the seagrass 49
Posidonia oceanica L. (Delile) covers 23% of shallow water substratum (< 50 m, Pasqualini et
50
al. 1998) and leaf epiphytes can constitute ~30% of the canopy biomass (Prado et al. 2008). 51
Seagrass leaf epiphytes include coralline and filamentous algae, polychaetes, foraminiferans, and 52
bryozoans (Borowitzka et al. 2006). Among these groups are several calcifiers (e.g. coralline 53
algae, foraminiferans, serpulid polychaetes and some bryozoans) which contribute to carbonate 54
cycling (Frankovich and Zieman 1994; Perry and Beavington-Penney 2005). Moreover, P. 55
oceanica epiphytes can contribute 20 and 60% to meadow primary production and nutrient
56
uptake (Borowitzka et al. 2006; Lepoint et al. 2007). Most herbivores feed on algal epiphytes and 57
several grazers feed on the epiphytic invertebrates (Lepoint et al. 2000). As evidence of their 58
importance as a food source, epiphyte abundance and herbivore dynamics are tightly coupled 59
(Tomas et al. 2005). 60
Through the process of ocean acidification, the pH in the ocean is being lowered with a 61
subsequent decline in the proportion of carbonate ions (CO32-) and an increase in the proportions
62
of bicarbonate ions (HCO3-) and dissolved carbon dioxide (CO2). Surface ocean pH decreased by
63
0.1 units since the pre-industrial era and an additional 0.07 to 0.33 units decrease is expected by 64
2100 (Gattuso et al. 2015). The decline in the CO32- concentration is projected to affect the
65
ability of calcifying organisms to maintain their skeletons (Feely 2004; Kroeker et al. 2013). 66
Macroalgal species can also respond differently to the increased carbon available for 67
photosynthesis and many, without calcified surfaces, are thought to be better competitors under 68
future ocean acidification conditions (Beer and Koch 1996; Koch et al. 2013). The concern is 69
changes in competitive abilities may cause shifts in composition at the community level (Fabry 70
et al. 2008; Kroeker et al. 2012; Gaylord et al. 2015; Sunday et al. 2017). 71
Seagrass epiphytic coverage and composition examined under lower pH conditions near 72
CO2 vents and in the laboratory generally support future ocean predictions based upon
73
physiology and mineralogy. The epiphytic calcified community, which is often dominated by 74
crustose coralline algae (CCA), is less abundant at lowered pH. Furthermore, epiphytic 75
invertebrates with lower Mg content and those organisms that lack calcified skeletons, such as 76
filamentous algae, often persist at lowest pH conditions (Martin et al. 2008; Campbell and 77
Fourqurean 2014; Donnarumma et al. 2014; Cox et al. 2015). The predicted loss of CCA at 78
lowered pH is a global concern for ecosystem function. Species of CCA occur in temperate and 79
tropical seagrass beds and in a variety of other habitats (< 295 m depth) where they serve key 80
ecological roles (Littler and Littler 2013). They are known to be a food source, cement and 81
stabilize reefs, facilitate recruitment, and add significantly to sediments (Land 1970; Nelsen and 82
Ginsburg 1986; Littler and Littler 2013; Gischler et al. 2013). Although vent systems predict 83
their loss and shifts in the community under ocean acidification, they are not perfect predictors of 84
future ocean ecology owing to the large variability of pH in space and time (Hall-Spencer et al. 85
2008; Kerrison et al. 2011). Furthermore, laboratory experiments have difficulties accounting for 86
the many environmental variations and species interactions that can alter predicted outcomes 87
(e.g. Burnell et al. 2014). Therefore, predictions on the fate of P. oceanica meadows could 88
benefit from additional information provided by the manipulation of pH in situ on entire 89
communities for an extended period of time (months to years). 90
Alteration in the abundance of P. oceanica epiphytes will likely have repercussions to 91
meadow carbon cycling and feeding capacity. Therefore, the aim of the present study was to test 92
the hypothesis that P. oceanica epiphytic community will be impacted by ocean acidification. 93
We tested this hypothesis in situ with a Free Ocean Carbon Dioxide Enrichment (FOCE) system 94
(see Gattuso et al. 2014). This system allows pH to be manipulated continuously, in an 95
enclosure, at a fixed offset from ambient levels. The offset takes into account natural pH 96
fluctuations that may alter organismal responses. During a 4 month-experimental period, 97
epiphytic coverage as well as carbonate mass was quantified on Posidonia leaves. Lastly, some 98
minerals in epiphytic calcified structures are more susceptible to dissolution and mineral changes 99
at elevated partial pressure of CO2 (pCO2) are not well understood. Therefore, we analyzed
100
epiphytic mineralogy throughout the duration of the study. 101
102
Methods
103
Experimental setup and system function
104
This study used the European FOCE (eFOCE) system which allows for the in situ 105
manipulation of pH in benthic enclosures as an offset from ambient pH (Gattuso et al. 2014). The 106
system was deployed in the Bay of Villefranche, approximately 300 m from the Laboratoire 107
d’Océanographie de Villefranche (NW Mediterranean Sea, France; 43°40.73′N, 07°19.39′E). 108
The study design consisted of two clear, 1.7 m3 (2 m long x 1 m width x 0.85 m tall) 109
perspex enclosures that enclosed a portion of a P. oceanica meadow. The enclosures were 110
located at 11 m depth and were placed approximately 1.5 m apart. The pH in one enclosure, 111
referred to as the experimental enclosure, was lowered by ~0.3 units as an offset from ambient 112
pH as measured on the total scale. This offset was based upon the business-as-usual 113
representative concentration pathway RCP8.5 following Ciais et al. (2013) and corresponded to a 114
mean (± SD) pHT of 7.75 ± 0.13 and pCO2 of 971 ± 323 μatm. In the second enclosure, the pH
115
was not manipulated and it served as a control. A third treatment consisted of an open fiberglass 116
frame of the same dimensions as the enclosure footprint (2 m2). It was placed nearby (3 m of the 117
experimental enclosure) and in the same meadow. It is referred to as a reference plot and was 118
used to account for any effects generated by the enclosure structure. True replication was not 119
logistically feasible. Replication was sacrificed to 1) control pH precisely within enclosures of a 120
large enough size to contain P. oceanica and 2) sense pH and other aspects of the environment 121
continuously in the three treatment locations. 122
The details of the eFOCE system function and maintenance are described in Cox et al. 123
(2016) and a schematic can be found in Supplemental Figure 1 (Fig. S1). Briefly, the pH in the 124
experimental enclosure was altered using surface supplied seawater pumped into a mixing tank, 125
which was located on a surface platform. Pure CO2 was bubbled into the mixing tank and the
126
resulting low pH seawater was pumped (flow rate up to 0.12 L min-1), via tubing, underwater to 127
the proximity of the benthic enclosures. Prior to entering the enclosures, low pH (pHT ~ 5.5) and
128
ambient seawater were mixed in an underwater tube and a set (x3) of centrifugal pumps (6.7 L 129
min-1 each) injected ambient seawater in the control enclosure and lowered-pH seawater in the 130
experimental enclosure. Seawater pH was measured before entering the enclosures enabling the 131
automated adjustment of the low pH seawater injection to maintain the desired pH offset. 132
Seawater inside enclosures was circulated by a set of centrifugal pumps (4 per chamber; 6.7 L 133
min-1 each) and exited through two openings (12 cm diameter). The renewal time of seawater in 134
each enclosure was ca. 1.5 h. The system contained a number of sensors: 4 potentiometric 135
Seabird 18-S pH sensors located inside each enclosure and in each mixing tube and three Seabird 136
37 SMP-ODO CTD with SBE 63 O2 optodes and three LI-COR-192 PAR (photosynthetic active
137
radiation) sensors located in each enclosure and one nearby the enclosures (in ambient). The 138
carbonate chemistry within each treatment was determined at high frequency using average total 139
alkalinity together with sensed temperature, salinity and pHT, in the R package, seacarb (see Cox
140
et al. 2016 for more details). 141
Timeline
142
The experiment comprised three periods in 2014: (1) the pre-acidification period, before 143
pH was manipulated, from 15 May to 11 June, (2) the transition period from 12 to 21 June, when 144
pH in the experimental enclosure was slowly lowered by no more than 0.05 units per day until an 145
offset of approximately -0.3 units was reached and (3) the experimental period from 22 June to 3 146
November when pH in the experimental enclosure was maintained at a offset of ~ -0.3 units. 147
Collection of seagrass leaves
148
Six to ten oldest leaf blades were collected from separate P. oceanica shoots growing 149
within the reference plot and enclosures. Oldest leaf blades, or the outer most leaf in the bundle, 150
were selected because these blades have more developed epiphytic communities (Cebrián et al. 151
1999). Divers collected intact leaves spaced evenly throughout the plot or enclosure at 152
approximately four week intervals during the acidification period in 2014, at time (T) 1 to 4: T1 153
occurred on 31 July, 39 d after acidification, T2 occurred on 4 September, 74 d after 154
acidification, T3 on 9 October after 109 d of acidification and T4 occurred on 10 November after 155
135 d of acidification. It should be noted that the acidification of the experimental enclosure 156
ended on 4 November 2014 but due to logistical constraints the final collection of blades were 157
made six days later. A set of ten leaves was also collected immediately after the transition period, 158
on 26 June 2014 (referred to as sampling interval, T0). These leaves were collected in a 2 x 1 m 159
area in the meadow, located ~2 m from the enclosures. They were collected outside the 160
enclosures and the reference plot to limit destructive sampling within the experimental setup but 161
still obtain a baseline measure. All leaves were collected above the sheath, placed into separate 162
plastic bags, transferred into a darkened cooler, and transported to the laboratory. 163
Determination of epiphytic coverage and composition
164
Leaves used for determination of epiphytic coverage and composition were kept in a 165
temperature controlled (20 to 22 ºC), darkened room for less than 24 h until scanning was 166
completed. A high-resolution scanner ZooScan (Hydroptic, France; Gorsky et al. 2010) produced 167
colour images (2400 dpi) of leaves and their epiphytes. Five to seven images of leaves were used 168
to represent the assemblage within the reference plot and enclosures at each interval, except at 169
T1 when error resulted in three to four scanned leaf images being used per treatment. 170
The cell counter plug-in, in ImageJ, generated a grid (0.1 cm x 0.1 cm) superimposed on 171
the scanned image of the leaf. Organisms that occurred directly underneath each intersection of 172
the grid or point (231 to 1244 depending upon leaf length) were identified to the lowest possible 173
taxonomic or functional unit and counted. Fifteen lowest possible taxonomic or functional 174
groups were identified. These 15 were lumped into 11 groups that shared functional or 175
taxonomic similarity (see Table S3). The 11 groups were as follows: CCA (pigmented if pink in 176
coloration or bleached if thallus appeared white), non-calcified algae, Bryozoa, serpulid 177
polychaetes, Foraminifera, Hydrozoa, Porifera, unidentified, biofilm and ascidians. Biofilm was 178
defined as a group of microscopic organisms that formed a visible film across the surface of the 179
leaf. SEM images indicated this group is likely composed of diatoms and bacterial films and rod 180
forms. Percent cover by organism (or unit) was determined for each leaf by dividing the 181
organism intersections by the total number of intersections analysed and multiplying by 100. 182
Calcium carbonate mass
183
After scanning, the mass of CaCO3 contained in the epiphytes was assessed using the
184
weight loss after acidification method (Bosence 1989; Perry and Beavington-Penney 2005). 185
Leaves with epiphytes were dried at 60 °C for 12 h, weighed (A, 0.01 mg), acidified with 5% 186
HCl, rinsed twice with deionised water, dried again at 60 °C for 12 h and re-weighed (B). Ten 187
young leaves without epiphytes were treated in the same manner (C). The weight of the epiphytic 188
calcareous mass was then determined from the following equation, A – [B / (1 - C)]. 189
Determination of mineralogy
190
After each leaf collection, three leaves from each treatment were set aside to air-dry (~22 191
ºC) at room temperature. Dried epiphytes were gently scraped from separate leaves and ground 192
into a fine powder for X-ray diffraction (XRD, N = 3 per treatment). Additionally, to obtain a 193
baseline mineral profile the XRD analysis was performed on separate Bryozoa and CCA 194
sampled at T0 and carefully removed from the leaves and ground. Scanning electron 195
microscopy-energy dispersive spectroscopy (SEM-EDS) was further used to understand how the 196
minerals identified by XRD, were present on the leaf surface. Using SEM-EDS we compared the 197
skeletal structure of CCA between treatments. 198
XRD was carried out using a SIEMENS D501 Bragg-Brentano diffractometer equipped 199
with a graphite monochromator and scintillation detector, using CuKα radiation. Settings were a 200
step size of 0.02° and a scan speed of 1° per minute. Precision for determination of Mg-content 201
of Mg-calcite was ~0.5%. Scan interpretation followed procedures described in Nash et al. 202
(2014). SEM-EDS was done using a Zeiss UltraPlus field emission scanning electron 203
microscope, equipped with an Oxford Inca EDS. For EDS measurements, the Zeiss was set to 204
15.0 kV, 15 mm working distance with a beam interaction volume ca. 3 μm. Imaging was at 205
3 mm working distance and 3 kV. Samples were platinum coated. A sample was embedded in 206
crystal bond and polished for precise SEM-EDS measurements or mounted intact and attached 207
using carbon tape. Aragonite was quantified using the area under the curve method (Diaz-Pulido 208
et al. 2014). Many Mg-calcite peaks had minor asymmetry on the lower 2-theta side indicating 209
the presence of small amounts of calcite. Comparisons of relative calcite asymmetry were made 210
using the principles of peak asymmetry developed in Nash et al. (2014). 211
Statistical analyses
212
The approach used was to monitor the epiphytic community at three sites: control 213
enclosure, experimental enclosure, and a reference plot. This study, similar to many natural 214
experiments, lacks true replication (Hurlbert 1984). In unreplicated designs in ecology, the 215
emphasis is on the estimation of effect size and the unique ecological perspective provided 216
(Hurlbert 1984; Stewart-Oaten et al. 1986; Oksanen 2001; Davies and Gray 2015). Inferential 217
statistics were avoided. Furthermore, a large effect size was expected based upon previous study 218
results (e.g. Martin et al. 2008). 219
Multivariate analyses were used to compare the leaf epiphytic communities. Prior to 220
analyses, the epiphytic coverage at each interval was averaged. Thus, there was one value for 221
each of the three treatments (reference, control enclosure, and the experimental enclosure) at 222
each interval (T1-T4). A square root transformation was applied and a Bray-Curtis resemblance 223
matrix created between each interval-treatment assemblage (4 intervals x 3 treatments = 12 leaf 224
assemblages). Dissimilarities were visualized with an nMDS (non-metric multi-dimensional 225
scaling) plot. A two-way (treatment x interval) Analysis of Similarity (ANOSIM) without 226
replication and 999 permutations was used to examine for differences. This is a valid approach in 227
ecological monitoring when there is pseudoreplication (Clarke 1993). The global R from an 228
ANOSIM indicates effect size. It ranges from -1 to 1 and is analogous to a correlation 229
coefficient; a value close to zero indicates no or little distinction between a prior groups. The 230
ANOSIM was followed by two separate (treatment and interval) similarity percentage analyses 231
(SIMPER) to identify the amount each taxonomic or functional group contributed to 232
dissimilarity. 233
Data from leaves collected at T0 (before the perturbation) were not used in multivariate 234
analyses because they were only collected at one instance and outside the experimental setup. 235
Similarly, organisms that occurred on one to three leaves out of 70 were removed prior to 236
analyses to eliminate their inflated influence on dissimilarities. 237
The abundance (mean, median, and range) of specific taxa, CaCO3 mass, and epiphytic
238
mineral composition were compared qualitatively through time between the three treatments; 239
paying careful attention to any directional deviations observed on leaves from the experimental 240 enclosure. 241 Results 242
Environmental and experimental conditions
243
Environmental and experimental conditions as well as seagrass growth are fully 244
described in Cox et al. (2016). There were 150 to 175 shoots m-2 of P. oceanica inside each plot 245
and enclosure and few other macrophytes (< 11% coverage). Leaf biometrics were not affected 246
by the lowered pH. Average shoot height increased from 40.6 cm in April to 73.4 cm in August 247
then declined to 24.8 cm in November. 248
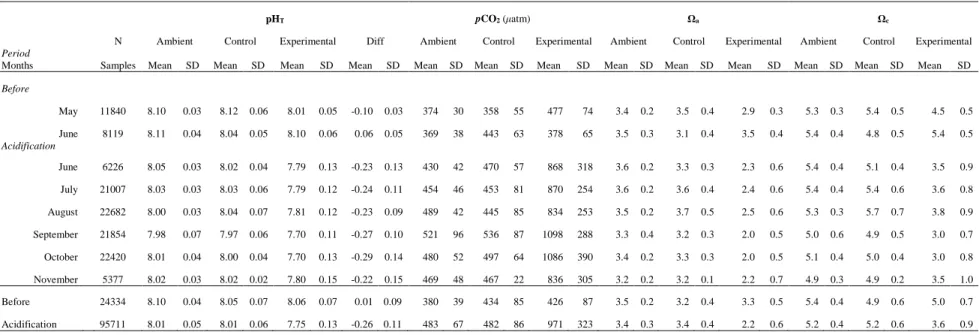
The carbonate chemistry is summarized in Table 1 and the diel variability is provided in 249
Table S1. The pHT in the meadow (ambient) ranged from a monthly mean of 7.98 (± 0.06 SD) to
250
8.11 (± 0.04 SD, Table 1). The mean saturation states of aragonite (Ωa) and calcite (Ωc) ranged
251
from 3.1 to 3.6 and 4.9 to 5.4 from June to September, respectively. The diel pH T change
252
differed among months from 0.04 to 0.12. It corresponded to the daily change in CO2
253
concentration driven by community primary production, respiration and calcification. 254
The carbonate chemistry in the control enclosure and the ambient environment were 255
similar (monthly mean differed < 0.06 units). The diel change in pHT within the control
256
enclosure was slightly greater than in ambient and was consistent in the pre- and during 257
acidification period (median ± median absolute deviation 0.14 ± 0.06 and 0.14 ± 0.06). 258
During the acidification period, the pH in the experimental enclosure was maintained at a 259
mean -0.26 unit offset (monthly mean values from -0.22 to -0.29 pH units) from the control 260
enclosure (Table S1). Monthly mean values of saturation state with respect to aragonite (Ωa)
261
ranged from 2.0 (± 0.05 SD) in October to a high of 2.5 (± 0.06 SD) in August and saturation 262
state with respect to calcite (Ωc) ranged from 3.0 (± 0.07 to 0.008 SD) in September and October
263
to 3.8 (± 0.09 SD) in August. Median diel pH range in the experimental enclosure was two to 264
three times larger than the control (monthly ranged from 0.09 to 0.29 pH units) and had greater 265
variability. Variation was attributed to lowered buffering capacity of seawater with lowered pH. 266
Monthly differences as summarized in Cox et al. (2016) were evident, particularly for 267
temperature (mean monthly range: 17.7 to 24.2°C) and PAR (mean monthly range: 1.3 to 7.3 268
mol photons m-2 d-1, Table S2) but were similar in the ambient, control and experimental
269
enclosures. 270
Leaf epiphytic community description
271
Overall, CCA were the most dominant epiphyte occurring on all leaves at coverages 272
between 0.8 to 58.8%, followed by the lesser abundant biofilm (0 to 22.0%) and Bryozoa (0 to 273
20.8 %). Hydroids and sponges were found on 3 of the 70 leaves (< 2%). An ascidian occurred at 274
12% on one leaf collected from the reference plot. 275
SEM images confirmed the presence of CCA, Bryozoa, Foraminifera, serpulid 276
polychaetes and biofilm. At this increased SEM resolution, bacterial films, rod structures and 277
diatoms were visually distinguishable. These organismal groups were likely undetected or 278
grouped to ‘biofilm’ in the quantification of macroepiphytes. Unidentified rod structures of 1-2 279
µm in length were commonly found on the epiphytes but not directly on the leaves (Fig. S2). 280
Diatoms were observed both on epiphytes and leaf surfaces. 281
Spatial and temporal patterns in epiphytic community
282
There was little distinction in epiphytic composition and coverage found on leaves from 283
the enclosures and reference plot yet, clear differences were observed between T1-T4 intervals 284
(ANOSIM: treatment, global R = 0.25, p-value = 0.28; interval, global R = 0.56, p -value = 285
0.003; Fig. 1) 286
Indeed, SIMPER routine indentified dissimilarities (TS4) between communities in the 287
plot and enclosures to be small (ranged from 19.2 to 26.7%). Differences in abundances of 288
biofilm and pigmented CCA contributed most (Table S4, 19.1 to 33.3%) to treatment 289
dissimilarities. Leaves from the reference plot had an overall (across all sampling intervals, n = 290
18 to 20 leaves) greater coverage of pigmented CCA (mean ± SD, reference = 27.9 ± 15.3, 291
control = 19.5 ± 9.4 and experimental = 23.4 ± 10.7%) and leaves from the control had a greater 292
cover of biofilm (mean ± SD, reference = 0.8 ± 0.9, control = 7.2 ± 5.3, experimental = 2.8 ± 293
2.5%). It was also noted that there was a greater coverage of biofilm in enclosure communities, 294
with percentages more similar to those observed at T0 in leaves from the ambient. In SEM 295
images, relatively greater numbers of diatoms were observed on leaves collected in the 296
enclosures than on leaves collected at T0 and in the reference plot. 297
Dissimilarity in communities increased with increasing duration between sampling 298
intervals. For example, the overall (combined treatments) community at T1 was most dissimilar 299
from communities at T3 and T4 (20.9 to 30.2% dissimilar, respectively) and least dissimilar from 300
the community at T2 (14.1%). Also, the community at T2 was more similar to the community at 301
T3 than the community at T4 (Table S5, T2 and T3 were 18.2% dissimilar, T2 and T4 were 302
26.7% dissimilar). 303
In enclosures and in the reference plot, there was a decline in the abundance of CCA 304
(bleached and pigmented, separate groups in analyses) from July (mean ± SD, T1 31.4 ± 8.3%) 305
to November (mean ± SD, T4 11.7 ± 6.2%). Bleached and healthy appearing CCA showed 306
similar trends in time. Together, they accounted for 33 to 55% of the dissimilarity between 307
intervals. Other epiphytic groups also declined from T1 to T4 and contributed to interval 308
dissimilarities (each contributed between 4.1 to 13.7%), these included non-calcified algae (mean 309
± SD, T1 2.2 ± 2.7% to T4 0.3 ± 0.4%) and Bryozoa (mean ± SD, T1 2.1 ± 1.4% to T4 0.5 ± 310
0.6%). 311
The abundances of epiphytes found on the T0 leaves (n = 7, collected from nearby 312
enclosures before the pertubation), highlight the large spatial or temporal variability in 313
abundance of some groups, such as Bryozoa and Foraminifera (Fig 2). 314
Trends in organismal coverage to evaluate predicted pH effects
315
Overall (pooled across sampling intervals), leaves from the experimental enclosure had a 316
slightly greater mean coverage of pigmented CCA than those from the control enclosure (Fig. 2 317
A) and the range of coverage often overlapped. The coverage of non-calcified algae (Fig. 2D, 318
mostly Dictyota sp.) declined in all treatments and the overall mean (± SD) was slightly lower in 319
the experimental than in the control enclosure (1.2 ± 1.8% vs 0.7 ± 0.7%). It contributed 4.7% to 320
enclosure differences. Leaves from the experimental enclosure also tended to have a relatively 321
greater coverage of invertebrate calcifiers (Fig. 2E, F; mean ± SD, control versus experimental, 322
Bryozoa: 0.6 ± 0.8% vs 1.0 ± 0.9%; serpulid polychaetes: 0.1 ± 0.1%, vs 0.4 ± 0.4%). These 323
abundances contributed 8% each to differences between enclosures. Only, leaf epiphytic 324
Foraminifera (Fig. 2G) had a directional change in abundance distinct from the change in 325
abundances on leaves from the control enclosure and reference plot. Foraminifera coverage was 326
greatest on leaves at T1 within the experimental enclosure (0 to 1%), they declined at T2 (0 to 327
0.1%) and disappeared from the collected leaves at T3 and T4. However, this taxon is rare 328
(indicated by low coverage, <1%) and coverage between leaves can be highly variable (see T0). 329
It contributes 7% to enclosure community differences (Table S4). 330
Calcium carbonate mass
331
CaCO3 mass on leaves ranged from 8.6 to 24.7 mg cm-2 (Fig. 3). There were no clear
332
consistent patterns that would indicate seasonal changes or lowered pH effect. 333
Mineralogy
334
The magnesium carbonate composition of leaf epiphytes ranged from 10.6 to 13.2 mol% 335
MgCO3 and there was no indication of a low pH effect (Fig. 4). The mean (± SD) mol % MgCO3
336
was 11.9 ± 0.6 on leaves from the reference plot, 12.1 ± 0.9 on leaves from the control and 12.0 337
± 0.7 on leaves from the experimental enclosure. Values obtained on samples collected at T0 338
confirmed that CCA and Bryozoa were, respectively, 11.3 to 11.7 and 8.3 to 8.8 mol% MgCO3.
339
Changes in epiphytic mol% MgCO3 by sampling interval appeared to be seasonal (Fig.4).
340
The community mean (±SD) value tended to increase from T0 (June, 10.7 ± 0.1) to T1 (July, 341
11.1 ± 0.4) and maintained a similar composition between T2 and T4 (September to November, 342
12.2 ± 0.4 and 12.4 ± 0.6 mol% MgCO3).
343
There were two other mineral phases present in the epiphyte community in addition to 344
magnesium calcite, calcite and aragonite. Aragonite was present on all 24 leaves examined from 345
the enclosures but was not present on leaves collected from the reference plot, nor from T0 346
leaves from the ambient environment (16 leaves in total). The proportion of aragonite in bulk 347
epiphytes between enclosures was similar at each interval from T1 to T3. At T4, it was greater in 348
two of the three epiphyte samples collected from the control enclosure and in three of three 349
samples collected from the experimental enclosure (Fig. 4). 350
Calcite was predominantly present in epiphytes collected from the reference plot and at 351
T0 in ambient epiphytes (Fig. 4). Epiphytes from the ambient environment at T0 and T1 to T3 in 352
the reference plot had minor calcite amounts present as indicated by slight asymmetry of the Mg-353
calcite peak. There were separate peaks for calcite and Mg-calcite for bulk epiphytes at T4, 354
indicating substantial amounts present, but they were not quantified. The asymmetry method is 355
not appropriate when the peaks are entirely separate, as for the T4 samples. In this case the value 356
of (-) 6 was given, being the approximate difference between the value for calcite (which 357
contains ~3-4 mol% MgCO3) and Mg-calcite (9-10 mol% MgCO3).
358
SEM-EDS was used to visualize the surfaces of leaf epiphytes and examine the location 359
of mineral phases. Imaging was undertaken on subsamples from three leaves collected at T0 360
from the ambient environment and from both enclosures and reference plot at T1 and T4. Loose 361
grains of Mg-calcite were present on the seagrass surface (Fig. S3). These appeared to be 362
remnant grains after the surficial CCA had broken off, possibly during sample preparation. 363
Calcification features of the CCA from the enclosures and reference plot appeared similar in 364
structure (Fig. 5). There were not any structural indications of dissolution from the lowered pH. 365
EDS measurements also confirmed that the CCA were Mg-calcite. 366
All the imaged CCA had areas of alteration where their cellular structure was no longer 367
intact (Fig. 6). EDS measurements showed that alteration areas were responsible for the calcite 368
or aragonite identified by XRD. Altered surfaces of epiphytic CCA revealed different mineral 369
phases related to a “structural effect” from the enclosures. On leaves from the ambient 370
environment (reference plot as well as T0), the altered CCA surfaces appeared rough and were 371
composed of calcite with no micro-endoliths visible. In contrast, the altered surfaces of CCA on 372
leaves from the enclosures were aragonitic. The aragonite-altered CCA showed areas that 373
appeared similar to the calcitic altered areas on CCA from the ambient, with the exception that 374
there were also partially eroded cells that had altered to aragonite (Fig. 6, Fig. S4). Crystal 375
morphology of the aragonite varied from blocky to typical aragonite needle shape. Particular 376
attention was paid to the November samples from the reference plot to determine whether there 377
were other epiphytes or changes that could be responsible for the substantially greater amount of 378
calcite observed relative to the amount observed at T0 and T1 in the epiphytes grown in the 379
ambient environment. The only calcite detected was in alteration areas that appeared similar to 380
that observed previously at T0 and T1. Diatoms and bacterial films were observed on the 381
surfaces of leaves and CCA, often in close proximity to the altered algal surfaces (Fig. S4). 382
Discussion
383
The lack of a pH effect on P. oceanica epiphytic community is in contrast with findings 384
from previous laboratory manipulations and observations of communities conducted near CO2
385
vents where the pH is naturally lower (Hall-Spencer et al. 2008; Martin et al. 2008; 386
Donnarumma et al. 2014; Cox et al. 2015). Martin et al. (2008) showed a complete 387
disappearance of epiphytic coralline algae and the persistence of bryozoans at an average pHT of
388
7.7, but with large temporal variations from < 7.0 to > 8.1. Donnarumma et al. (2014), at the 389
same CO2 seep, showed that the calcifying species tend to be less competitive as pHT decreases
390
(8.1 to 6.7) and that leaves were dominated by filamentous algae, hydroids and tunicates at the 391
lowest pHT (mean 6.7). In the laboratory, Cox et al. (2015) exposed P. oceanica shoots with their
392
associated epiphytes to three constant pH levels (pHT 8.1 ambient, 7.7 and 7.3) for four weeks.
393
Under both low pH treatments, there was a reduction of CCA and reduced calcification rates. 394
Similar shifts in community composition have been noted on other seagrass species as a 395
consequence of lowered pH (Burnell et al. 2014; Campbell and Fourqurean 2014; Martínez-396
Crego et al. 2014). 397
In the present study, the epiphytic community was largely composed of CCA and 398
Bryozoa. A similar proportion of epiflora to epifauna composition on P. oceanica has been 399
described in other investigations (Lepoint et al. 1999; Martin et al. 2008; Prado et al. 2008; Cox 400
et al. 2015) and coverages were similar to those reported by Cox et al. (2015) and Prado et al. 401
(2008). The decline in coverage at T4 coincides with the period of known decline of seagrass 402
biomass and leaf turnover after storm events in the autumn (Alcoverro et al. 1995). 403
CCA are often identified as having a large susceptibility to ocean acidification (Nelson 404
2009; Koch et al. 2013; Hofmann and Bischof 2014; McCoy and Kamenos 2015). CCA 405
epiphytes on P. oceanica have exhibited lowered calcification rates and coverage near and below 406
the pHT of 7.7 (Martin et al. 2008; Cox et al. 2015). Martin et al. (2008) has also demonstrated
407
their vulnerability to dissolution at pHT of 7.0 with strong undersaturation of carbonate.
408
Although some species are able to reduce carbonate demands by altering their structural 409
thickness (McCoy and Ragazzola 2014), we did not observe any visible or quantifiable alteration 410
in CCA skeletons related to pH manipulation, even after four months of exposure. 411
Bryozoa have also been studied in the vicinity of CO2 vents as well as in the laboratory
412
(Rodolfo-Metalpa et al. 2010; Lombardi et al. 2011b; Lombardi et al. 2011a; Smith 2014). Many 413
have an outer cuticle beneath which the mineralized skeleton forms. The protective cuticle 414
barrier and low Mg-calcite composition or ability to alter mineral composition has been used to 415
explain their persistence on leaves at volcanic CO2 seeps with a pHT as low as 6.98 (Martin et al.
416
2008; Rodolfo-Metalpa et al. 2010; Donnarumma et al. 2014). Transplant experiments, however, 417
indicate that some group members can be negatively affected (decreased thickness and signs of 418
dissolution) by ocean acidification particularly in warmer months (Rodolfo-Metalpa et al. 2010; 419
Lombardi et al. 2011b; Lombardi et al. 2011a). Therefore, it appears that the pH environment in 420
the experimental enclosure, even during the warmer months, was not detrimental to calcification 421
for the bulk of the community. 422
It should be noted that despite rarity, Foraminifera did decline in the experimental 423
enclosure in a pattern consistent with a response to ocean acidification. This observation is in 424
agreement with 20 out of 26 studies reviewed on Foraminifera under elevated pCO2 that have
425
reported negative responses to lowered pH (Keul et al. 2013). 426
Recently, there have been several studies with outcomes which conflict or fail to support 427
widely-held ocean acidification projections. For example, Martin and Gattuso (2009), and 428
Egilsdottir et al. (2013) describe no clear effect of minimally lowered pH on calcifiers. Even for 429
epiphytes, Apostolaki et al. (2014) and Saderne and Wahl (2013) did not find a loss in calcified 430
coverage or reduced calcification rates at lowered pH. The present study outcome adds to the 431
growing literature which suggests that calcified communities in their natural settings can be little 432
affected by minimal changes in surrounding carbonate chemistry. 433
There have been many speculations on the conditions that result in conflicting outcomes 434
for calcifiers under lowered pH. Discrepancies are attributed to species specifity, other 435
environmental conditions that stress or limit organismal physiology (e.g. differences in light, 436
temperature, or combined stressors), or limitations and differences in study design (e.g. treatment 437
levels used, Kroeker et al. 2010; Koch et al. 2013; Gazeau et al. 2013). 438
Some macroalgae and benthic invertebrates are known to respond differently to pH 439
fluctuations than they do to a mean pH difference (Britton et al. 2016; Small et al. 2016). The 440
median diel pH variation was 0.1 in the ambient meadow. The median diel pH range in the 441
experimental enclosure was two to three times larger than the control (0.09 to 0.29 pH units). 442
This difference could not be explained by O2 fluxes alone and instead was attributed to lowered
443
buffering capacity of seawater with lowered pH (Cox et al. 2016). Because of natural pH 444
fluctuations, it is hypothesized that organisms in seagrass meadows may already experience and 445
be pre-adapted to pH levels projected into the next century (Hendriks et al. 2014a). In the present 446
study, the 0.1 diel pH variability in the meadow would not support possible acclimation to a pHT
447
of 7.7. Productivity of coastal macrophytes can buffer the impacts of ocean acidification by 448
providing a daily window of maximum CaCO3 saturation where calcification can be more
449
efficient (Anthony et al. 2011; Anthony et al. 2013; Hendriks et al. 2014b; Cornwall et al. 2015). 450
It is possible that the pH offset used could have allowed for buffering at the leaf blade surface 451
and prevented CCA loss. To limit an impact, however, buffering in daylight must offset the 452
lowered pH that surrounds the community in the absence of photosynthesis at night. For 453
sensitive taxa the benefit of pH fluctuations appears limited (Cornwall et al. 2014; Johnson et al. 454
2014; Roleda et al. 2015). For instance, in the laboratory recruits of coralline algae had relatively 455
lowered growth rates when pH fluctuated as opposed to when pH was constant and lowest 456
growth occurred when pH fluctuations were altered to mimic a future ocean acidification 457
scenario (-0.4 difference from ambient, Roleda et al. 2015). Adult coralline algae, often more 458
tolerant to ocean acidification conditions, were unaffected (Roleda et al. 2015). Congruent with 459
the reduced numbers observed in the present study with exposure to lower pH, algal surfaces did 460
not provide refugia for foraminifera assemblages along a gradient of overlying seawater 461
acidification in Levante Bay, Italy (Pettit et al. 2015). 462
The outcome for epiphytes growing in host plant boundary layers may also depend upon 463
the pH scenario used. For example, recruitment and growth of calcifying serpulids and bryozoan 464
on the alga Fucus serratus were weakly to not affected at pHT = 7.7 but were reduced at pHT =
465
7.3 (Saderne and Wahl 2013). The ocean acidification scenario used (mean pHT of 7.75) could
466
also explain the outcome in the present study. Maintaining a calcified skeleton presumably 467
becomes more difficult and costly as seawater gets closer to undersaturation (Kleypas et al. 468
1999). Seawater in the pH manipulated enclosure was lower than ambient yet, it remained 469
saturated with respect to both calcite and aragonite (3.6 and 2.2). CCA have the ability to raise 470
the pH within their boundary layer to limit the potential negative impacts of decreased ambient 471
pH when seawater is not undersaturated (Hofmann et al. 2016). In contrast, at CO2 seeps, pH
472
near the vents can be highly variable and organisms can be exposed to pH levels substantially 473
lower than projections for the next century (Kerrison et al. 2011). In addition, organismal 474
physiological responses can be confounded by biological conditions facilitated by venting, not 475
related to lowered pH (Vizzini et al. 2013). 476
Enclosures, while circulated and partly open, likely slowed water motion and could 477
possibly account for the relative increase of diatoms and provided a better refuge for calcifiers. 478
Diatoms are ubiquitous members of seagrass microepiphytic communities (Borowitzka et al. 479
2006; Mabrouk et al. 2014). Pinckeny and Fiorenza (1998) reported increased prevalence of 480
diatoms on leaves in slower flows in the Atlantic. Microalgae were also more prominent on P. 481
oceanica which has a greater structural canopy that can slow water movement than on
482
Cymodocea nodosa (Mabrouk et al. 2014). Slowed water flows, like those that occur in dense
483
canopies, increase boundary layer thickness surrounding plants and potentially allow for greater 484
buffering capacity in daylight (Hurd 2015) and lower buffering capacity at night. Therefore, in 485
the eFOCE experiment, the structural barrier of the enclosure may have affected the response 486
both positively and negatively. The lack of effect on epiphytes suggest that the combined 487
response was balanced. 488
pH effects on communities are known to be altered by seasonal factors (Burnell et al. 489
2014; Baggini et al. 2014; Martínez-Crego et al. 2014), yet in a year-long study, at an area with 490
volcanic CO2 seeps, epiphytic calcifier abundance on P. oceanica leaves was negatively
correlated with pH (Donnarumma et al. 2014). In contrast, the pH pertubation in the present 492
study occurred during a period with large seasonal environmental change (July to November) 493
and a climax epiphytic community, and no pH effects were observed. We also observed, in all 494
treatments, what appeared to be a recruitment event of filamentous algae and both CCA recruits 495
(small patches) and adults with reproductive conceptacles. Thus, we surmise that if the eFOCE 496
experiment was extended for a full year the outcome would be the same. Even though this 497
experiment was conducted in a period of biomass decline, we do not think it masked an impact. 498
In other studies, a decline in CCA calcification rates and coverage has occurred rapidly (weeks to 499
months), a time frame well within the duration of study and the sampling frequency. A repeated 500
experiment with extended experimental duration is needed to clarify long-term effects and to 501
include the period of peak faunal recruitment not captured in the current study. 502
To the best of our knowledge, this is the only study to concurrently investigate temporal 503
changes and pH effects on bulk epiphytic mineralogy. The only identifiable trend for Mg content 504
was over time. The increase in MgCO3 after August (T2) could be explained by the seasonal
505
reduction in abundance of invertebrate calcifiers often composed of lower Mg-calcite. 506
Alternatively, or in combination, the incorporation of more Mg may be due the 2 to 6 °C increase 507
(e.g. Chave and Wheeler 1965; Diaz-Pulido et al. 2014) that occurred from June to August (T0 to 508
~T2). The presence of calcite in the epiphytes from the reference plot, compared to its absence in 509
the epiphytes sampled in the enclosures, which instead had aragonite, is at this time without 510
explanation. Similarly, the increase in calcite and aragonite that occurred at T4 is without 511
explanation. There are many reports of aragonite in CCA (Nash et al. 2011; Smith et al. 2012; 512
Diaz-Pulido et al. 2014; Krayesky-Self et al. 2016). We are not aware of any report of calcite in 513
live CCA and thus this is the first documented alteration to calcite for CCA. 514
Accurate ecological projections of future oceans should arise as a consensus from 515
combined study approaches: observational, controlled laboratory, modeling, and in situ 516
experimentation. This study addressed a need for in situ pH manipulation to account for the 517
complexity in community response to ocean acidification. Additionally, the study design 518
accounted for natural pH variation that is often ignored when pH is manipulated in situ. While 519
large scale unreplicated experiments, like eFOCE, can provide valuable ecological information 520
they do have drawbacks (Hurlbert 1984; Oksanen 2001; Davies and Gray 2015). Replicated 521
enclosures were not feasible at this stage. Alternative hypotheses that we cannot robustly exclude 522
include (1) there were small pH effects difficult to quantify (2) that the conflicting outcome is 523
due to some ‘lurking’ variable. However, several recommended steps (Oksanen 2001; Davies 524
and Gray 2015) were taken to try to reduce erroneous conclusions that may occur including: (1) 525
care was taken to select study locations that were similar in depth and seagrass density to reduce 526
confounding variables (2) the environment was continuously monitored to ensure they were 527
similar to those in ambient, (3) repeated measurements were made at the same location through 528
time and compared to ‘before’ measurements when possible, (4) comparisons from the pH 529
manipulated enclosure were made to two different spatial locations and (5) statistics used did not 530
require replication. 531
The use of a FOCE system to study the epiphytic community on P. oceanica leaves 532
provides a more positive outlook on the future of meadows than the projections based largely on 533
observations near CO2 vents. This conclusion should be tempered until more assessments are
534
conducted with greater replication under a variety of conditions found in meadows. Nevertheless, 535
results add to the growing evidence that calcareous members of macrophyte dominated 536
communities may be more resilient to minimal changes in carbonate chemistry. 537
538
Acknowledgements We would like to acknowledge the following people who assisted in the
539
laboratory, in the field, or with engineering: E. Beck Acain, J. Acain, J. Delille, L. van der 540
Heijden, M. Maillot, F. Moullec, S. Schenone, L. Urbini, K. Walzyńska. We are grateful to A. 541
Elineau for help with the ZooScan. We also thank J.-J. Pangrazi, R. Patrix and E. Tanguy for 542
aide in construction of the enclosures. G. de Liege, D. Luquet and D. Robin kindlyassisted in 543
diving collection activities. This work was funded by the ‘European Free Ocean Carbon 544
Enrichment’ (eFOCE; BNP-Paribas Foundation), the ‘European Project on Ocean Acidification’ 545
(EPOCA; grant agreement 211384) and the MISTRALS-MERMEX (INSU, CNRS) program. 546
547
Ethical Statement
548
The authors declare that they have no conflict of interests and all applicable guidelines for the 549
use of animals were followed. 550
References
551
Alcoverro T, Duarte C, Romero J (1995) Annual growth dynamics of Posidonia oceanica: 552
contribution of large-scale versus local factors to seasonality. Mar Ecol Prog Ser 553
120:203–210. doi: 10.3354/meps120203 554
Anthony KRN, Diaz-Pulido G, Verlinden N, Tilbrook B, Andersson AJ (2013) Benthic buffers 555
and boosters of ocean acidification on coral reefs. Biogeosciences 10:4897–4909. doi: 556
10.5194/bg-10-4897-2013 557
Anthony KRN, Kleypas J, Gattuso J-P (2011) Coral reefs modify their seawater carbon 558
chemistry - implications for impacts of ocean acidification. Global Change Biol 17:3655– 559
3666. doi: 10.1111/j.1365-2486.2011.02510.x 560
Apostolaki ET, Vizzini S, Hendriks IE, Olsen YS (2014) Seagrass ecosystem response to long-561
term high CO2 in a Mediterranean volcanic vent. Mar Environ Res 99:9–15
562
Baggini C, Salomidi M, Voutsinas E, Bray L, Krasakopoulou E, Hall-Spencer JM (2014) 563
Seasonality affects macroalgal community response to increases in pCO2. PLoS ONE
564
9:e106520. doi: 10.1371/journal.pone.0106520 565
Beer S, Koch E (1996) Photosynthesis of marine macroalgae and seagrasses in globally changing 566
CO2 environments. Mar Ecol Prog Ser 141:199–204
567
Borowitzka MA, Lavery PS, van Keulen M (2006) Seagrasses: Biology, Ecology and 568
Conservation. In: Larkum AWD, Orth RJ, Duarte CM (eds) Epiphytes of seagrasses. 569
Springer, Dordrecht, The Netherlands, pp 441–461 570
Bosence D (1989) Biogenic carbonate production in Florida Bay. Bull Mar Sci 44:419–433 571
Britton D, Cornwall CE, Revill AT, Hurd C, Johnson C (2016) Ocean acidification reverses the 572
positive effects of seawater pH fluctuations on growth and photosynthesis of the habitat-573
forming kelp, Ecklonia radiata. Sci Rep. doi: 10.1038/srep26036 574
Burnell O, Russell B, Irving A, Connell S (2014) Seagrass response to CO2 contingent on
575
epiphytic algae: indirect effects can overwhelm direct effects. Oecologia 176:871–882 576
Campbell JE, Fourqurean JW (2014) Ocean acidification outweighs nutrient effects in 577
structuring seagrass epiphyte communities. J Ecol 102:730–737. doi: 10.1111/1365-578
2745.12233 579
Cebrián J, Enríquez S, Fortes MD, Agawin N, Vermaat JE, Duarte CM (1999) Epiphyte accrual 580
on Posidonia oceanica (L.) Delile leaves: Implications for light absorption. Bot Mar 581
42:123–128. doi: 10.1515/BOT.1999.015 582
Chave KE, Wheeler BD (1965) Mineralogic changes during growth in the red alga, 583
Clathromorphum compactum. Science 147:621–621. doi: 10.1126/science.147.3658.621
Ciais P, Sabine C, Bala G, Bopp L, Brovkin V, Canadell J, Chhabra A, DeFries R, Galloway J, 585
Heimann M, Jones C, Le Quéré C, Myneni RB, Piao S, Thornton P (2013) Carbon and 586
other biogeochemical cycles. Cambridge University Press, Cambridge, United Kingdom 587
and New York, NY, USA 588
Clarke KR (1993) Non-parametric multivariate analyses of changes in community structure. 589
Austral Ecol 18:117–143. doi: 10.1111/j.1442-9993.1993.tb00438.x 590
Cornwall C, Pilditch C, Hepburn C, Hurd CL (2015) Canopy macroalgae influence understorey 591
corallines’ metabolic control of near-surface pH and oxygen concentration. Mar Ecol 592
Prog Ser 525:81–95. doi: 10.3354/meps11190 593
Cornwall CE, Boyd PW, McGraw CM, Hepburn C, Pilditch CA, Morris JN, Smith AM, Hurd 594
CL (2014) Diffusion boundary layers ameliorate the negative effects of ocean 595
acidification on the temperate coralline macroalga Arthrocardia corymbosa. PLoS ONE 596
9:e97235. doi: 10.1371/journal.pone.0097235 597
Cox TE, Gazeau F, Alliouane S, Hendriks IE, Mahacek P, Le Fur A, Gattuso J-P (2016) Effects 598
of in situ CO2 enrichment on structural characteristics, photosynthesis, and growth of the
599
Mediterranean seagrass Posidonia oceanica . Biogeosciences 13:2179–2194. doi: 600
10.5194/bg-13-2179-2016 601
Cox TE, Schenone S, Delille J, Díaz-Castañeda V, Alliouane S, Gattuso JP, Gazeau F (2015) 602
Effects of ocean acidification on Posidonia oceanica epiphytic community and shoot 603
productivity. J Ecol 103:1594–1609. doi: 10.1111/1365-2745.12477 604
Davies GM, Gray A (2015) Don’t let spurious accusations of pseudoreplication limit our ability 605
to learn from natural experiments (and other messy kinds of ecological monitoring). Ecol 606
Evol 5:5295–5304. doi: 10.1002/ece3.1782 607
Diaz-Pulido G, Nash MC, Anthony KRN, Bender D, Opdyke BN, Reyes-Nivia C, Troitzsch U 608
(2014) Greenhouse conditions induce mineralogical changes and dolomite accumulation 609
in coralline algae on tropical reefs. Nature Comm. doi: 10.1038/ncomms4310 610
Donnarumma L, Lombardi C, Cocito S, Gambi MC (2014) Settlement pattern of Posidonia 611
oceanica epibionts along a gradient of ocean acidification : an approach with mimics.
612
Mediterr Mar Sci 15:498–509. doi: 10.12681/mms.677 613
Egilsdottir H, Noisette F, Noël LM-LJ, Olafsson J, Martin S (2013) Effects of pCO2 on
614
physiology and skeletal mineralogy in a tidal pool coralline alga Corallina elongata. Mar 615
Biol 160:2103–2112. doi: 10.1007/s00227-012-2090-7 616
Fabry VJ, Seibel BA, Feely RA, Orr JC (2008) Impacts of ocean acidification on marine fauna 617
and ecosystem processes. ICES J Mar Sci 65:414–432. doi: 10.1093/icesjms/fsn048 618
Feely RA (2004) Impact of anthropogenic CO2 on the CaCO3 system in the oceans. Science
619
305:362–366. doi: 10.1126/science.1097329 620
Frankovich TA, Zieman JC (1994) Total epiphyte and epiphytic carbonate production on 621
Thalassia testudinum across Florida Bay. Bull Mar Sci 54:679–695.
622
Gattuso J-P, Kirkwood W, Barry JP, Cox TE, Gazeau F, Hansson L, Hendriks I, Kline DI, 623
Mahacek P, Martin S, McElhany P, Peltzer ET, Reeve J, Roberts D, Saderne V, Tait K, 624
Widdicombe S, Brewer PG (2014) Free-ocean CO2 enrichment (FOCE) systems: present
625
status and future developments. Biogeosciences 11:4057–4075. 626
Gattuso J-P, Magnan A, Bille R, Cheung WWL, Howes EL, Joos F, Allemand D, Bopp L, 627
Cooley SR, Eakin CM, Hoegh-Guldberg O, Kelly RP, Portner H-O, Rogers AD, Baxter 628
JM, Laffoley D, Osborn D, Rankovic A, Rochette J, Sumaila UR, Treyer S, Turley C 629
(2015) Contrasting futures for ocean and society from different anthropogenic CO2
630
emissions scenarios. Science 349:aac4722-aac4722. doi: 10.1126/science.aac4722 631
Gaylord B, Kroeker KJ, Sunday JM, Anderson KM, Barry JP, Brown NE, Connell SD, Dupont 632
S, Fabricius KE, Hall-Spencer JM, Klinger T, Milazzo M, Munday PL, Russell BD, 633
Sanford E, Schreiber SJ, Thiyagarajan V, Vaughan MLH, Widdicombe S, Harley CDG 634
(2015) Ocean acidification through the lens of ecological theory. Ecology 96:3–15. doi: 635
10.1890/14-0802.1 636
Gazeau F, Parker LM, Comeau S, Gattuso J-P, O’Connor WA, Martin S, Pörtner H-O, Ross PM 637
(2013) Impacts of ocean acidification on marine shelled molluscs. Mar Biol 160:2207– 638
2245. doi: 10.1007/s00227-013-2219-3 639
Gischler E, Dietrich S, Harris D, Webster JM, Ginsburg RN (2013) A comparative study of 640
modern carbonate mud in reefs and carbonate platforms: Mostly biogenic, some 641
precipitated. Sediment Geol 292:36–55. doi: 10.1016/j.sedgeo.2013.04.003 642
Gorsky G, Ohman MD, Picheral M, Gasparini S, Stemmann L, Romagnan JB, Cawood A, 643
Pesant S, Garcia-Comas C, Prejger F (2010) Digital zooplankton image analysis using 644
the ZooScan integrated system. J Plankton Res 32:285–303. 645
Hall-Spencer JM, Rodolfo-Metalpa R, Martin S, E, Fine M, Turner SM, Rowley SJ, Tedesco D, 646
Buia MC (2008) Volcanic carbon dioxide vents show ecosystem effects of ocean 647
acidification. Nature 454:96–99 648
Hemminga MA, Duarte CM (2000) Seagrass Ecology. University of Cambridge, Cambridge, 649
United Kingdom 650
Hendriks IE, Duarte CM, Olsen YS, Steckbauer A, Ramajo L, Moore TS, Trotter JA, McCulloch 651
M (2014a) Biological mechanisms supporting adaptation to ocean acidification in coastal 652
ecosystems. Estuar Coast Shelf Sci 152:1–8. doi: 10.1016/j.ecss.2014.07.019 653
Hendriks IE, Olsen YS, Ramajo L, Basso L, Steckbauer A, Moore TS, Howard J, Duarte CM 654
(2014b) Photosynthetic activity buffers ocean acidification in seagrass meadows. 655
Biogeosciences 11:333–346. doi: 10.5194/bg-11-333-2014 656
Hofmann LC, Bischof K (2014) Ocean acidification effects on calcifying macroalgae. Aquat 657
Biol 22:261–279 658
Hofmann LC, Koch M, de Beer D (2016) Biotic control of surface pH and evidence of light-659
induced H+ pumping and Ca2+-H+ exchange in a tropical crustose coralline alga. PloS 660
ONE 11: e0159057 661
Hurd CL (2015) Slow-flow habitats as refugia for coastal calcifiers from ocean acidification. J 662
Phycol 51:599–605. doi: 10.1111/jpy.12307 663
Hurlbert S (1984) Pseudoreplication and the design of ecological field experiments. Ecol 664
Monogr 187–211 665
Jackson EL, Rees SE, Wilding C, Attrill MJ (2015) Use of a seagrass residency index to 666
apportion commercial fishery landing values and recreation fisheries expenditure to 667
seagrass habitat service: Seagrass contribution to fishery value. Cons Biol 29:899–909. 668
doi: 10.1111/cobi.12436 669
Johnson MD, Moriarty VW, Carpenter RC (2014) Acclimatization of the crustose coralline alga 670
Porolithon onkodes to variable pCO2. PLoS ONE 9:e87678. doi:
671
10.1371/journal.pone.0087678 672
Kerrison P, Hall-Spencer JM, Suggett DJ, Hepburn LJ, Steinke M (2011) Assessment of pH 673
variability at a coastal CO2 vent for ocean acidification studies. Estuar Coast Shelf Sci
674
94:129–137 675
Keul N, Langer G, de Nooijer LJ, Bijma J (2013) Effect of ocean acidification on the benthic 676
foraminifera Ammonia sp. is caused by a decrease in carbonate ion concentration. 677
Biogeosciences 10:6185–6198. doi: 10.5194/bg-10-6185-2013 678
Kleypas J, Buddemeier R, Archer D, Gattuso J-P, Langdon C, Opdyke, B (1999) Geochemical 679
consequences of increased atmospheric carbon dioxide on coral reefs. Science 284:118– 680
120. 681
Koch M, Bowes G, Ross C, Zhang XH (2013) Climate change and ocean acidification effects on 682
seagrasses and marine macroalgae. Glob Change Biol 19:103–132. doi: 10.1111/j.1365-683
2486.2012.02791.x 684
Krayesky-Self S, Richards JL, Rahmatian M, Fredericq S (2016) Aragonite infill in overgrown 685
conceptacles of coralline Lithothamnion spp. (Hapalidiaceae, Hapalidiales, Rhodophyta): 686
new insights in biomineralization and phylomineralogy. J Phycol 52:161–173. doi: 687
10.1111/jpy.12392 688
Kroeker KJ, Kordas RL, Crim R, Singh GG (2013) Impacts of ocean acidification on marine 689
organisms: quantifying sensitivities and interaction with warming. Glob Change Biol 690
19:1884–1896. doi: 10.1111/gcb.12179 691
Kroeker KJ, Kordas RL, Crim RN, Singh GG, Hendriks IE, Ramajo L, Singh GS, Duarte CM, 692
Gattuso J-P (2010) Meta-analysis reveals negative yet variable effects of ocean 693
acidification on marine organisms: Biological responses to ocean acidification. Ecol Lett 694
13:1419–1434. doi: 10.1111/j.1461-0248.2010.01518.x 695
Kroeker KJ, Micheli F, Gambi MC (2012) Ocean acidification causes ecosystem shifts via 696
altered competitive interactions. Nat Clim Change 3:156–159. doi: 10.1038/nclimate1680 697
Land LS (1970) Carbonate mud: production by epibiont growth on Thalassia testudinum. J 698
Sediment Petrol 40:1361–1363 699
Lepoint G, Havelange S, Gobert S, Bouquegneau JM (1999) Fauna vs flora contribution to the 700
leaf epiphytes biomass in a Posidonia oceanica seagrass bed (Revellata Bay, Corsica). 701
Hydrobiologia 394:63–67 702
Lepoint G, Jacquemart J, Bouquegneau JM, Demoulin V, Gobert S (2007) Field measurements 703
of inorganic nitrogen uptake by epiflora components of the seagrass Posidonia oceanica 704
(Monocotyledons, Posidoniaceae). J Phycol 43:208–218 705
Lepoint G, Nyssen F, Gobert S, Dauby P, Bouquegneau JM (2000) Relative impact of a seagrass 706
bed and its adjacent epilithic algal community in consumer diets. Mar Biol 136:513–518 707
Littler M, Littler D (2013) The nature of crustose coralline algae and their interactions on reefs. 708
Smithson Contrib Mar Sci 39:199–212 709
Lombardi C, Cocito S, Gambi M, Cisterna B, Flach F, Taylor P, Keltie K, Freer A, Cusack M 710
(2011a) Effects of ocean acidification on growth, organic tissue and protein profile of the 711
Mediterranean -bryozoan Myriapora truncata. Aquat Biol 13:251–262. doi: 712
10.3354/ab00376 713
Lombardi C, Gambi MC, Vasapollo C, Taylor P, Cocito S (2011b) Skeletal alterations and 714
polymorphism in a Mediterranean bryozoan at natural CO2 vents. Zoomorphology
715
130:135–145. doi: 10.1007/s00435-011-0127-y 716
Mabrouk L, Ben Brahim M, Hamza A, Mahfoudhi M, Bradai MN (2014) A comparison of 717
abundance and diversity of epiphytic microalgal assemblages on the leaves of the 718
seagrasses Posidonia oceanica (L.) and Cymodocea nodosa (Ucria) Asch in Eastern 719
Tunisia. J Mar Biol 2014:1–10. doi: 10.1155/2014/275305 720
Martin S, Gattuso J-P (2009) Response of Mediterranean coralline algae to ocean acidification 721
and elevated temperature. Glob Change Biol 15:2089–2100. doi: 10.1111/j.1365-722
2486.2009.01874.x 723
Martin S, Rodolfo-Metalpa R, Ransome E, Rowley S, Buia M-CC, Gattuso J-P, Hall-Spencer J 724
(2008) Effects of naturally acidified seawater on seagrass calcareous epibionts. Biol Lett 725
4:689–692. doi: 10.1098/rsbl.2008.0412 726
Martínez-Crego B, Olivé I, Santos R (2014) CO2 and nutrient-driven changes across multiple
727
levels of organization in Zostera noltii ecosystems. Biogeosciences 11:7237–7249 728
McCoy SJ, Kamenos NA (2015) Coralline algae (Rhodophyta) in a changing world: integrating 729
ecological, physiological, and geochemical responses to global change. J Phycol 51:6–24 730
doi: 10.1111/jpy.12262 731
McCoy SJ, Ragazzola F (2014) Skeletal trade-offs in coralline algae in response to ocean 732
acidification. Nat Clim Change 4:719–723. doi: 10.1038/nclimate2273 733
Nash MC, Opdyke BN, Wu Z, Xu H, Trafford JM (2014) Simple X-Ray diffraction techniques 734
to identify Mg-calcite, dolomite, and magnesite in tropical coralline algae and assess peak 735
asymmetry. J Sediment Res 83:1084–1098. doi: 10.2110/jsr.2013.67 736
Nash MC, Troitzsch U, Opdyke BN, Trafford JM, Russell BD, Kline DI (2011) First discovery 737
of dolomite and magnesite in living coralline algae and its geobiological implications. 738
Biogeosciences 8:3331–3340. doi: 10.5194/bg-8-3331-2011 739
Nelsen JE, Ginsburg RN (1986) Calcium carbonate production by epibionts on Thalassia in 740
Florida Bay. J Sediment Res Vol. 56:622–628. doi: 10.1306/212F89EF-2B24-11D7-741
8648000102C1865D 742
Nelson W (2009) Calcified macroalgae–critical to coastal ecosystems and vulnerable to change: 743
a review. Mar Freshwater Res 60:787–801. doi: 10.1071/MF08335 744
Oksanen L (2001) Logic of experiments in ecology: is pseudoreplication a pseudoissue? Oikos 745
94:27–38. doi: 10.1034/j.1600-0706.2001.11311.x 746
Pasqualini V, Pergent-Martini C, Clabaut P, Pergent G (1998) Mapping of Posidonia oceanica 747
using aerial photographs and side scan sonar: application off the island of Corsica 748
(France). Estuar Coast Shelf Sci 47:359–367 749
Perry CT, Beavington-Penney SJ (2005) Epiphytic calcium carbonate production and facies 750
development within sub-tropical seagrass beds, Inhaca Island, Mozambique. Sediment 751
Geol 174:161–176. doi: 10.1016/j.sedgeo.2004.12.003 752
Pettit LR, Smart CW, Hart MB, Milazzo M, Hall-Spencer JM (2015) Seaweed fails to prevent 753
ocean acidification impact on foraminifera along a shallow-water CO 2 gradient. Ecol
754
Evol 5:1784–1793. doi: 10.1002/ece3.1475 755
Pinckney JL, Fiorenza M (1998) Microalgae on seagrass mimics: Does epiphyte community 756
structure differ from live seagrasses? J Exp Mar Biol Ecol 221:59–70 757
Prado P, Alcoverro T, Romero J (2008) Seasonal response of Posidonia oceanica epiphyte 758
assemblages to nutrient increase. Mar Ecol Prog Ser 359:89–98 759