HAL Id: hal-01000772
https://hal.sorbonne-universite.fr/hal-01000772
Submitted on 15 Jun 2017
HAL is a multi-disciplinary open access archive for the deposit and dissemination of sci-entific research documents, whether they are pub-lished or not. The documents may come from teaching and research institutions in France or abroad, or from public or private research centers.
L’archive ouverte pluridisciplinaire HAL, est destinée au dépôt et à la diffusion de documents scientifiques de niveau recherche, publiés ou non, émanant des établissements d’enseignement et de recherche français ou étrangers, des laboratoires publics ou privés.
banded iron formation in India and a lateritic soil in
Brazil
B. Oberger, C. Wagner, A. Tudryn, Richard Wirth, R. Morgan, J.D. Fabris,
Jean-Marc Greneche, C Rosière
To cite this version:
B. Oberger, C. Wagner, A. Tudryn, Richard Wirth, R. Morgan, et al.. Micro‑ to nano‑scale char-acterization of martite from a banded iron formation in India and a lateritic soil in Brazil. Physics and Chemistry of Minerals, Springer Verlag, 2014, 41 (9), pp.651-667. �10.1007/s00269-014-0679-8�. �hal-01000772�
REVISED PR
OOF
DOI 10.1007/s00269-014-0679-8
OrIgINAL PAPEr
Micro- to nano-scale characterization of martite from a banded
iron formation in India and a lateritic soil in Brazil
Beate Orberger · Christiane Wagner · Alina Tudryn · Richard Wirth · Rachael Morgan · José D. Fabris · Jean Marc Greneche · Carlos Rosière
received: 7 October 2013 / Accepted: 9 April 2014 © Springer-Verlag Berlin Heidelberg 2014
siliciclastic and volcanic rocks previously affected by meta-morphic fluids (Minas gerais, Brazil). Octahedral crystals from both samples are composed of hematite with minor patches of magnetite, but show different structures. The Indian crystals show trellis of subhedral magnetite hosting maghemite in sharp contact with interstitial hematite crys-tals, which suggests exsolution along parting planes. grain boundary migrations within the hematite point to dynamic crystallization during deformation. Dislocations and fluid inclusions in hematite reflect its precipitation related to a hydrothermal event. In the Brazilian martite, dislocations are observed and maghemite occurs as Insel structures and nano-twin sets. The latter, typical for the hematite, are a transformation product from maghemite into hematite. For both samples, a deformation-induced hydrothermally driven transformation from magnetite via maghemite to hematite is proposed. The transformation from magnetite into maghemite comprises intermediate non-stoichiomet-ric magnetite steps related to a redox process. This study shows that martite found in supergene environment may result from earlier hypogene processes.
Keywords Magnetite · Hematite · Maghemite ·
FIB-TEM · raman · Mössbauer
Introduction
In nature, magnetite is transformed into hematite often via pseudomorphic replacement, which was first described by gruner (1922, 1926, 1929). The chemical and crystal-lographic transformation of magnetite (FeOFe2O3, cubic crystallographic structure) into hematite (α-Fe2O3, trigo-nal) perfectly preserves the octahedral crystal habit of the magnetite precursor. This replacement (or martitization)
Abstract The pseudomorphic transformation of
magnet-ite into hematmagnet-ite (martitization) is widespread in geological environments, but the process and mechanism of this trans-formation is still not fully understood. Micro- and nano-scale techniques—scanning electron microscopy, focused ion bean transmission electron microscopy, and raman spectroscopy—were used in combination with X-ray dif-fraction, Curie balance and magnetic hysteresis analyses, as well as Mössbauer spectroscopy on martite samples from a banded iron formation (2.9 ga, Dharwar Craton, India), and from lateritic soils, which have developed on
B. Orberger (*)
ErAMET rESEArCH, 1 Avenue Albert Einstein, 78190 Trappes, France
e-mail: [email protected] B. Orberger · A. Tudryn · r. Morgan Université Paris-Sud, Laboratoire gEOPS,
UMr 8148 (CNrS-UPS), Bât 504, 91405 Orsay, France C. Wagner
UPMC, Univ Paris 06, ISTeP, CNrS, UMr 7193, 4 Place Jussieu, 75005 Paris, France
r. Wirth
Department 4, geoForschungsZentrum Potsdam (gFZ), Telegrafenberg, 14482 Potsdam, germany
J. D. Fabris
Universidade Federal dos Vales do Jequitinhonha e Mucuri, Diamantina, Minas gerais 39100-00, Brazil
J. M. greneche
LUNAM, Institut des Molécules et Matériaux du Mans, IMMM UMr CNrS 6283, Université du Maine, 72085 Le Mans, France C. rosière
Instituto de geociências, Universidade Federal de Minas gerais, Belo Horizonte, Minas gerais 31270-901, Brazil
1 2 3 4 5 6 7 8 9 10 11 12 13 14 15 16 17 18 19 20 21 22 23 24 25 26 27 28 29 30 31 32 33 34 35 36 37 38 39 40 41 42 43 44 45 46 47 48 49 50 A1 A2 A3 A4 A5 A6 A7 A8 A9 A10 A11 A12 A13 A14 A15 A16 A17 A18 A19 A20 A21 A22
REVISED PR
OOF
leads to the formation of so-called “martite”. In the text, the word “martitization and martite” will thus be used as defined above and as used by, e.g., Swanson-Hysell et al. (2011) and papers therein. The magnetite replacement by hematite can occur during oxidation via O2− addition or Fe2+ loss (Lepp 1957; Davis et al. 1968). Alternatively, a dissolution–precipitation process (chemically or biochemi-cally mediated) can be controlled by pH changes (Brown et al. 1997; Ohmoto 2003; Otake et al. 2007) or by defor-mation (Lagoeiro 1998). All these processes have been proposed for banded iron formations (BIFs), where the magnetite–hematite transformation is common (Banerji 1984; Morris 1985; Ohmoto 2003; Mücke and Cabral 2005; Beukes et al. 2008). The transformation can occur directly from magnetite to hematite, as mainly observed in low-temperature sedimentary environments, or via magh-emite formation (γ-Fe2O3, cubic with a tetragonal super-cell) as an intermediate step (Bachmann 1954; Lepp 1957; Colombo et al.1965; Davis et al. 1968; Morris 1980, 1985; Banerji 1984). The metastability of maghemite compared to hematite has been much debated (see the review of Lind-sley 1976 and references therein). Maghemite has an iron-deficient spinel structure with vacancies distributed among the octahedral and tetrahedral sites (e.g., “kenotetrahedral magnetite” from Kullerud et al. 1969; Weber and Hafner 1971). According to Linsdley (op. cit.), these spinels are considered either as “omission solid solution between mag-netite and γ-(or α-) Fe2O3” or simply as “cation—deficient
magnetites”. We use hereafter the term of “non-stoichio-metric magnetite” for these intermediate products.
This is the first study on martite using micro- and nano-scale methods, scanning electron microscopy (SEM), focused ion bean transmission electron microscopy (FIB-TEM) and micro-raman spectroscopy, which were crossed with X-ray diffraction (XrD), Mössbauer spectroscopy, Curie balance and magnetic hysteresis in order to under-stand the processes and mechanisms of the magnetite–hem-atite transformation. We studied two samples from different geological environments. The first belongs to chemically precipitated BIFs, which were affected by lower green-schist facies metamorphism (Bababudan group; 2.9 ga, Mid-Archean Western Dharwar Craton, Southern India; Orberger et al. 2012). The second sample comes from a lateritic soil, which developed on siliciclastic and volcanic rocks previously affected by metamorphic fluids (Mid-Proterozoic Espinhaço Supergroup, Minas gerais, Brazil; Cabral et al. 2011, 2012 and references therein).
Sample description
The Brazilian sample consists of millimetric octahedral crystals from a lateritic soil developed on phyllites of the Espinhaço Supergroup (Serra do Espinhaço, Minas ger-ais, Brazil, south of the guinda, southeast of Diamantina (18°17′31.12″S, 43°38′09.75″W; Fig. 1a). These rocks
Fig. 1 Brazilian sample from
the Espinhaço range, Minas gerais. a Octahedral crystals. reflected light microphoto-graphs, polished thin section.
b Hematite of platy structure. c
Hematite (white) replacing mag-netite (gray). mag magmag-netite,
hm hematite 51 52 53 54 55 56 57 58 59 60 61 62 63 64 65 66 67 68 69 70 71 72 73 74 75 76 77 78 79 80 81 82 83 84 85 86 87 88 89 90 91 92 93 94 95 96 97 98 99 100 101 102 103
REVISED PR
OOF
contain magnetite, hematite and tourmaline and host hydro-thermal quartz veins with irregular aggregates of magnetite and tourmaline randomly distributed over the metamorphic fabric (Cabral et al. 2011, 2012).
The micro-texture of the Brazilian sample shows sub- to euhedral hematite octahedral grains (20–40 µm) show-ing intergranular porosity (Fig. 1b, c). On the outer crystal faces, carbonaceous matter was observed. Some platy hem-atite crystals (~20 µm) occur in linear clusters along crystal planes (Fig. 1b). Magnetite relicts are still present (Fig. 1c).
The Indian sample (B14a) comes from the 500-m-thick Archean BIF of the Bababudan group in the Western Dhar-war Craton, Southern India (N 13°19′539″, E 76°42′300″),
herein referred to as the Indian sample. The BIF chemically precipitated from a mixture of hydrothermal and seawater fluids (Kumar and Das Sharma 1998; Srinivasan and Oja-kangas 1986; Orberger et al. 2012) and experienced green-schist facies metamorphism (Taylor et al. 1984; Jayananda et al. 2006; Sarma et al. 2011). The Indian sample is char-acterized by alternating millimetric layers of gray Fe-oxide and white quartz (Fig. 2a). The Fe-oxide layers consist of cubic or octahedral crystals (~20 μm) of hematite, showing a trellis pattern (Fig. 2b, c) with relicts of magnetite and rare goethite patches (Fig. 2d). Modern weathering led to the formation of goethite (Orberger et al. 2012).
Methods
Polished thin sections of both Brazilian and Indian samples were studied using reflected and transmitted light optical microscopy, SEM and TEM and micro-raman spectros-copy. XrD, Curie balance, magnetic hysteresis and Möss-bauer spectrometry were performed on powders of a few macroscopic octahedra from the Brazilian sample and three separate fractions (total sample material, magnetic fraction and rest) of a massive Fe-oxide band from the Indian BIF. SEM and TEM
Backscattered electron (BSE) imaging was performed using SEM Philips XL 30 connected to an EDX-PgT ge detector for semi-quantitative chemical analyses (20– 30 kV) at the Université de Paris Sud XI and SEM Zeiss SUPrA 55VP at the Université Paris 06 (UPMC), Paris. Focused ion beam (FIB) technique was used to cut slices with dimensions of 10 × 10 × 0.1 µm3 for TEM. Details of the FIB milling process were given in Wirth (2004, 2009). TEM was performed using a FEI F20 X-Twin microscope with a Schottky field emitter as an electron source at gFZ-Potsdam, germany. The TEM mode was used to assess the bright and dark field imaging and selected area electron
Fig. 2 a Scanned polished thin
section of the Indian sample (B14a) from the Dharwar Craton showing alternating iron oxide (dark) and quartz bands (bright). b and c SEM– BSE microphotographs of a subhedral iron oxide crystal showing a trellis, intergrown with quartz. d reflected light microphotograph of iron oxide crystals. Hematite (white) is the major phase with relicts patches of magnetite (gray) and rare goethite (darker gray). Symbols as in Fig. 1 104 105 106 107 108 109 110 111 112 113 114 115 116 117 118 119 120 121 122 123 124 125 126 127 128 129 130 131 132 133 134 135 136 137 138 139 140 141 142 143 144 145 146 147 148 149 150
REVISED PR
OOF
diffraction (SAED). A Fishione high-angle annular dark field (HAADF) detector enables Z-contrast imaging. The chemical composition of selected spots was determined with an EDAX X-ray analyzer with ultra-thin window and a Li-doped silicon detector.
Micro-raman spectroscopy
raman spectroscopy was performed at the Laboratoire de Sciences de la Terre, ENS-Lyon, Lyon, France, using a Horiba Jobin–Yvon Labram Hr800 spectrometer, equipped with a microscope for the backscattered raman signal collection. Oxide phases were characterized through unpolarized raman spectra within 30–60 s. The excita-tion source was an argon ion laser beam at λ = 514.5 nm. The lateral resolution of the focused laser probe was meas-ured at 1 mm using 100× objective magnitude. The laser power measured at the sample was 500 µW. Calibration was performed during measurements in a silicon semi-conductor mode at 520.7 cm−1. The spectral signals were recorded in the range between 150 and 1,800 cm−1. The spectral resolution was ~2–4 cm−1 (with diffraction grating of 600 gr mm−1 for the Indian sample and 1,800 gr mm−1 for the Brazilian sample). The raman spectra were pro-cessed by the PeakFit 4.0 (Jandel Scientific) software using Loess smoothing procedure and second-order polynomial function for baseline fitting. The peak wave numbers were determined assuming a Lorentzian line shape.
Laser-induced thermal effects are known to affect iron oxides and hydroxides, but sample degradation can be avoided using a laser power on the sample below 1 mW (She-banova and Lazor 2003a; gehring et al. 2009; El Mendili et al. 2010). Thus, a low 500-µW power was used here, and moreover, we check for any possible degradation by acquir-ing several spectra at the same location for a total time of 8 min on a goethite patch in the Indian sample as shown in
“Appendix”. Apart from the expected lowering of the
back-ground fluorescence with increasing acquisition time, no sig-nificant changes in position, shape, or width of the goethite characteristic peaks are noticeable. This rules out any laser-induced goethite dehydration and transformation to hematite. XrD analyses
XrD analyses were performed at the UMr IDES, Uni-versité Paris Sud XI, using a Philips apparatus with
Cu-α cathode during a 4-h run between 6° and 80° (2θ). For
the Brazilian sample, two more 3-h runs were performed in the ranges 34°–40° and 51°–67° in order to distinguish between overlapping peaks of magnetite, maghemite and hematite (Fig. 3c, d). Calibration of the XrD spectra was performed with quartz, which is finely intergrown with the Fe-oxides in the Indian sample. The precision is 0.004 Å.
Magnetic parameter analyses
The thermomagnetic behavior of the samples was deter-mined on a horizontal force translation balance at UMr IDES, Université Paris Sud XI. Analyses were performed in air atmosphere, in a magnetic field of 0.375 T and lin-ear temperature increase of 10 °C min−1. Magnetic hyster-esis measurements were taken at room temperature with an alternating gradient magnetometer (AgM 2900-Micromag) at the LSCE-CNrS/CEA laboratory at gif-sur-Yvette, France. A peak-applied field of 1 T was used for hystere-sis measurements. The values of saturation magnetization (Ms), saturation remnant magnetization (Mrs) and coercive force (Bc) were estimated from the hysteresis loop; Ms and Mrs were mass normalized. Coercivity of remanence (Bcr) was obtained by step-wise application of back fields to remove the saturation remanence. The magnetic hysteresis parameters are given in Table 1.
57Fe-Mössbauer spectrometry
57Fe-Mössbauer spectrometry was carried out at the Institut des Molécules et Matériaux du Mans, Université du Maine, Le Mans, France. Spectra were recorded in transmission geometry at 300 K using a 57Co/rh γ-ray source mounted on a conventional constant acceleration electromagnetic drive. The hyperfine structure was analyzed by means of a least squares fitting method involving magnetic compo-nents with Lorentzian lines. The fitting procedure allows estimating the hyperfine parameters of each Fe species on their respective atomic proportions. The isomer shift values (δ) are referred to α-Fe at 300 K (Table 2).
Results
X-ray diffraction
A careful study of the diffraction patterns is needed in order to discriminate between the different Fe-oxides due to peak overlapping of, for example, the major peaks (I = 100) of magnetite (2.532 Å, JCPDS 19-629; Joint Committee on Powder Diffraction Standard 1974), maghemite (2.52 Å, JCPDS 4-755) and hematite (I = 50; 2.52 Å), or the peak at 1.48 Å (I = 40–50) present in these three Fe-oxides. Brazilian sample
A well-crystallized hematite with strong and sharp reflec-tion peaks is the major compound (Fig. 3a). The presence of maghemite is revealed by the peak at 2.782 Å [I = 19 (221); Fig. 3b], while the shoulder at 2.532 Å on the major hematite peak [2.518 Å (311); Fig. 3d] could be attributed 151 152 153 154 155 156 157 158 159 160 161 162 163 164 165 166 167 168 169 170 171 172 173 174 175 176 177 178 179 180 181 182 183 184 185 186 187 188 189 190 191 192 193 194 195 196 197 198 199 200 201 202 203 204 205 206 207 208 209 210 211 212 213 214 215 216 217 218 219 220 221 222 223 224 225 226 227 228 229 230 231 232 233 234 235 236 237 238 239 240 241 242 243
REVISED PR
OOF
Fig. 3 XrD patterns of the
Brazilian sample. a Total spectrum, 4-h run, range 6°–80° (2θ). b Zoom, 26°–35° (2θ). c and d 3-h spectrum for the key areas 51°–67° (2θ) and 34°–40° (2θ), respectively. He hematite,
Mg magnetite, Mh maghemite,
REVISED PR
OOF
to magnetite. Magnetite and/or maghemite may be indexed from the peak at 2.982 Å (Fig. 3b), which could correspond to the peaks 2.96 and 2.95 Å [I = 30 (220)] of magnetite and maghemite, respectively, and from the peak at 1.614 Å (Fig. 3c), corresponding to the peak at 1.616 Å (I = 30/33, 511 or 333) of the two oxides.
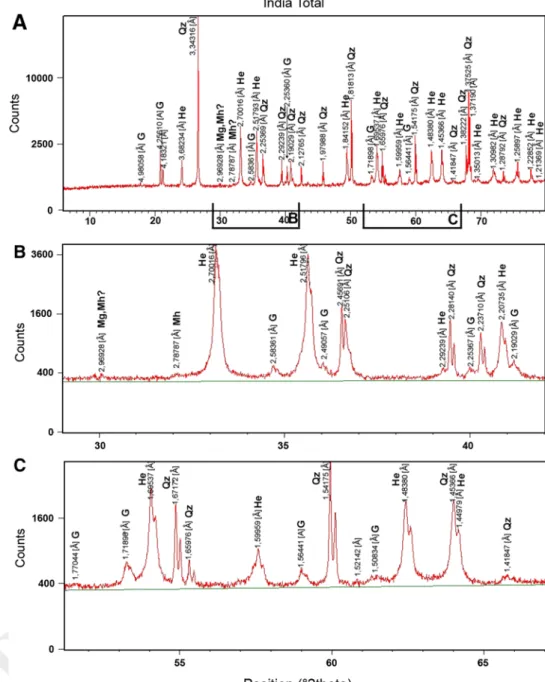
Indian sample
The XrD spectrum of the total sample—prior to mag-netic separation—shows the presence of quartz (JCPDS 5-615), hematite and goethite (JCPDS 17-536) (Fig. 4a). Hematite is the major compound showing strong and sharp reflections, while the goethite peaks are asymmet-ric and show a large half-peak width, which is indica-tive for poor crystallinity (Fig. 4b, c). A very small peak appears at 2.787 Å, characteristic for maghemite, and at
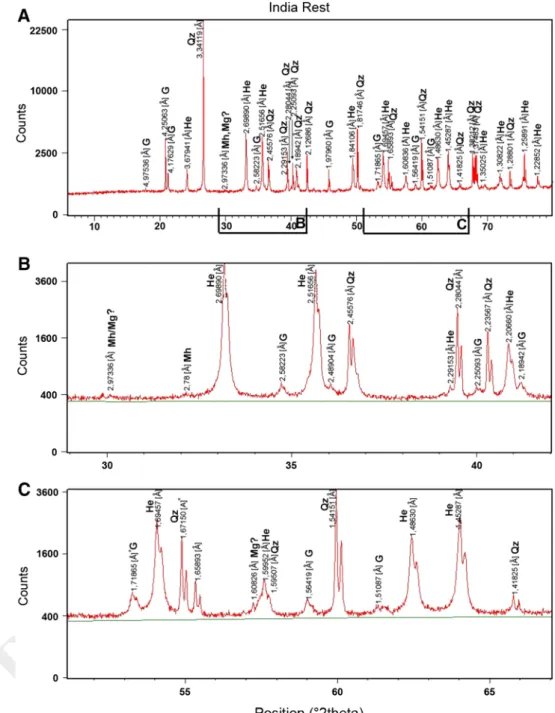
2.969 Å for possibly magnetite or maghemite (Fig. 4b). In the magnetic fraction, the same minerals as in the total sample are observed, but oxide peaks show higher intensi-ties (Fig. 5a, c). The weak peak at 1.613 Å (Fig. 5c) may indicate magnetite or maghemite. The peak at ~2.5 Å (Fig. 5b) is split, suggesting the presence of magnetite (311) and hematite (110) or maghemite (311). The rest of the material—after magnetic separation—shows, as expected, higher intensities of quartz, no peak splitting at 2.5 Å, but still a weak peak at 2.973 Å (Fig. 6b) attributed to magnetite or maghemite.
Magnetic parameters
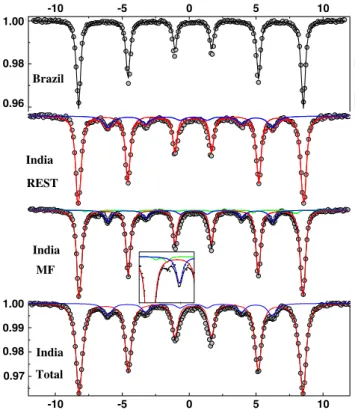
Both samples show a mixture of magnetite and hematite, with Curie temperatures of 580 and 680 °C, respectively (Fig. 7a, b, d). In this range of temperatures, the higher intensity of the relative magnetization (M/Ms) in the Brazil-ian sample compared to the IndBrazil-ian total fraction (Fig. 7a, b) suggests a higher content of hematite relative to magnet-ite in the former. In the Indian magnetic fraction (Fig. 7c), low M/Ms reflects the dominance of magnetite, a soft fer-rimagnetic magnetite easily magnetized and extracted from the total sample compared to hard weak magnetic hematite (canted antiferromagnetic), while hematite controls higher M/Ms in the Indian rest after magnetic extraction (Fig. 7d). The decrease in relative magnetization just below 400 °C (Fig. 7a) in the Brazilian sample, as well as the very slight decrease in the Indian rest fraction (Fig. 7d), indicates that another magnetic phase is present such as maghemite, which commonly transforms into hematite at that tempera-ture (e.g., Tarling 1983; Thompson and Oldfield 1986; De Boer and Dekkers 2001).
Magnetic hysteresis loops are presented in Fig. 7e, h and hysteresis characterizing parameters in Table 1. The magnetic hysteresis loops of the Brazilian sample and the Indian total and rest fractions (Fig. 7e, f, h) are con-stricted in the middle section, and wider above and below the middle section. Such “wasp-waisted” hysteresis loops indicate different magnetic components with contrast-ing coercive fields and may correspond to (1) a mixture of different grain sizes of a single magnetic mineral, (2) a mixture of different magnetic materials with largely
Table 1 Magnetic hysteresis parameters
Bc coercive force, Bcr coercivity of remanence, Mrs remanent magnetization, Ms saturation magnetization
Samples Bc (mT) Bcr (mT) Mrs/masse (µAm2/mg) M
s/masse (µAm2/mg) Mrs/Ms Bcr/Bc
Brazil 19.7 221.5 0.27 0.86 0.31 11.24 India total 18.8 62.4 0.28 1.62 0.17 3.32 India extract 12.9 46 0.58 4.67 0.12 3.57 India rest 21.5 78.3 0.22 1.12 0.20 3.64
Table 2 Mössbauer spectral parameters at 300 K
Three separate fractions were analyzed for the Indian sample: total, magnetic fraction (MF), and rest after magnetic extraction (rEST). The two components of magnetite were assumed in the expected ratio in the fitting procedure, while their respective hyperfine field (Bhf),
quadrupolar (2ε), and isomer (δ) shift values were fixed to expected values, because of the lack of resolution. The magnetite components were introduced through fitting the Mössbauer spectra of the Total and rEST fractions, but the final content was very low (<5 %) Ht: hematite; Mt, Fe3+ and Mt, Fe2.5+ refer to the magnetite sextets;
goeth: goethite
a Fixed parameter during fitting
Values of Mössbauer parameters at 300 K Sample label δ (mm/s) 2ε (mm/s) Bhf (T) Proportions Oxide ±0.01 ±0.01 ±0.5 ±2 (%) India total 0.38 −0.17 51.5 86 Ht 0.35 −0.27 37.8 14 goeth India MF 0.63 0a 46.0 2 Mt, Fe3+ 0.32 0a 49.0a 1 Mt, Fe2.5+ 0.38 −0.17 51.5 83 Ht 0.37 −0.26 38.0 14 goeth India rEST 0.38 −0.17 51.9 82 Ht 0.36 −0.26 37.8 18 goeth Brazil 0.38 −0.18 51.7 100 Ht 244 245 246 247 248 249 250 251 252 253 254 255 256 257 258 259 260 261 262 263 264 265 266 267 268 269 270 271 272 273 274 275 276 277 278 279 280 281 282 283 284 285 286 287 288 289 290 291 292 293 294 295 296 297 298 299
REVISED PR
OOF
different coercivities, or (3) a combination of both possi-bilities (e.g., Wasilewski 1973; Day et al. 1977; roberts et al. 1995; Tauxe et al. 1996). When different magnetic components are present, the soft (low coercivity) compo-nent controls the coercive force (Bc), while the hard (high coercivity) component controls the coercivity of remanence (Bcr). The degree of the constriction in the middle section of the magnetic loop depends on the relative contribution of each component. Furthermore, in the presence of high magnetic moment minerals, such as ferrimagnetic magnet-ite or maghemmagnet-ite, canted anti-ferromagnetic hematmagnet-ite with weak magnetic moments must be abundant to cause wasp-waisted magnetic loops. The wasp-wasp-waisted hysteresis loops for the studied samples (Fig. 7e, f, h) result from a mixture
of different components. In the Brazilian sample, high Bcr (Table 1) and the open nature of the loop at magnetic field values above 0.3 T (corresponding to the maximum coer-civity of most ferrimagnetic minerals such as magnetite) indicate a relatively higher amount of the hard component hematite (±goethite) compared to magnetite (±maghe-mite) than in the Indian sample (Fig. 7e, f, h). In the Indian sample, low values of Bc (Table 1) indicate the presence of a soft material such as magnetite or maghemite.
57Fe-Mössbauer spectrometry
The 300-K Mössbauer data of the Indian sample (total, magnetic fraction and rest after magnetic extraction)
Fig. 4 XrD patterns of the
total Indian. a Total spectrum, 4-h run, range 6°–80° (2θ).
b Zoom, range 29°–42° (2θ). c Zoom, range 51°–67° (2θ).
Same symbols as in Fig. 3
300 301 302 303 304 305 306 307 308 309 310 311 312 313 314 315 316 317 318 319 320 321 322 323 324 325
REVISED PR
OOF
and the Brazilian sample are shown in Table 2, and pat-terns are shown in Fig. 8. The spectrum for the Brazil-ian sample consists of a single sextet evidencing the sole occurrence of hematite. Differently, in all spectra for the Indian sample, the hyperfine structure exhibits spectral features that correspond to the two coordina-tion symmetries of iron in magnetite: Fe3+ on tetrahedral and Fe3+/2+ on octahedral sites of the spinel structure. Furthermore, in the spectrum for the magnetic fraction of the Indian sample, the inset of Fig. 8 magnifies the— though small—resonance line assignable to iron on octa-hedral sites of magnetite. Both the total Indian sample and the rest fraction after magnetic extraction indicate
the presence of hematite (86 and 82 %, respectively) and goethite (14 and 18 %, respectively), while only 3 % of magnetic fraction is composed of magnetite and still 83 % represents the hematite. No maghemite was detected in both samples.
Micro-raman spectroscopy Brazilian sample
Ten to twenty spectra were collected on selected zones of both samples. representative raman spectra are shown in Figs. 9 (Brazil) and 10 (India).
Fig. 5 XrD patterns of the
magnetic fraction (MF) of the Indian sample. a Total spectrum, 4-h run, range 6°–80° (2θ). b Zoom, range 29°–42° (2θ). c Zoom, range 51°–67° (2θ). Same symbols as in Fig. 3
326 327 328 329 330 331 332 333 334 335 336 337 338 339 340 341 342 343 344 345 346 347 348
REVISED PR
OOF
In the Brazilian sample, spectra were recorded from two different grains based on differences in reflected light: (1) rare small (5–20 µm) dark grayish patches in (2) over-all bright white grains. In the bright areas, the spectra recorded from grain 1 (Fig. 9a) show bands at 222–229, 293–304, 413–419, 505–512, 614–633, 664–679, and 1,336–1,342 cm−1, while in grain 2 (spectrum not shown), an additional band at 248–250 cm−1 appears. The band at ~300 cm−1 may be split into two bands (e.g., 291 and 299 cm−1). This combination of bands is typical of hem-atite (e.g., de Faria et al. 1997; Hanesh 2009). Hematite belongs to the D6
3d spatial group, and seven raman active
modes are expected: two A1g modes at 225 and 498 cm−1 and five Eg modes at 247, 293, 299, 412, and 613 cm−1, and a band at 1,320 cm−1 usually attributed to a two-mag-non scattering (de Faria et al. 1997). Some bands may not be resolved or may only appear on the flank of stronger peaks (e.g., bands at 245 and 299 cm−1) as observed here (op. cit.). In our samples, the peak positions are slightly shifted toward greater wave numbers compared to the aforementioned data. This may be due to different laser wavelengths and powers, the crystallinity or the orienta-tion of the sample, and is meaningless. However, the addi-tional band at 668–675 cm−1, the position of the E
g5 mode
Fig. 6 XrD patterns of the
Indian sample, rest material after magnetic separation. a Total spectrum, 4-h run, range 6°–80° (2θ). b Zoom, range 29°–42° (2θ). c Zoom, range 51°–67° (2θ). Same symbols as in Fig. 3 349 350 351 352 353 354 355 356 357 358 359 360 361 362 363 364 365 366 367 368 369 370 371 372
REVISED PR
OOF
at 617–631 cm−1 instead of 613 cm−1, and the position of the magnon band at 1,330–1,340 cm−1 (i.e., a shift up to 20 cm−1) are significant. The band at 668–675 cm−1 is in the range reported for the strong Eg mode of magnetite
(661–680 cm−1; de Faria et al. 1997; Shebanova and Lazor
2003b), but a band above 670 cm−1 has been attributed by
Hanesh (2009) to the ongoing transformation of magnetite reflecting possible maghemite. Furthermore, maghemite exhibits a band at ~1,330–1,360 cm−1, which could con-tribute here to the apparent shift of the hematite 1,320 cm−1 band to a higher wave number (Hanesh, 2009). The band at about 634 cm−1, unusual in hematite, has been reported by gehring et al. (2009) and interpreted as non-stoichiometric magnetite. The superposition of modes in the bright white parts of same reflectance and apparently homogeneous sug-gests that the size of some minerals is below the optical detection limit. It is thus concluded that the bands at about 634 and 675 cm−1 reflect the presence of maghemite or a non-stoichiometric transformation product of magnetite.
In the darker grayish patches, the spectra are slightly dif-ferent (red spectrum in Fig. 9b). Besides well-defined peaks at ~226, 296, 414, 505, and 1,328 cm−1 corresponding to hematite, shoulders on the flank of, or between defined bands are present, in comparison with the green spectrum from the bright patches (Fig. 9b). In the strong broad band at 669 cm−1, hidden peaks on its flanks are revealed by deconvolution at 565, 612, 730–740 cm−1. Similarly, a hid-den peak can be found at ~360 cm−1. These modes indicate thus the presence of relict magnetite (565 and 669 cm−1) and of maghemite (360 and 730–740 cm−1, shown by red arrows in Fig. 9b) or another non-stoichiometric magnet-ite. The maghemite “diagnostic” bands (Hanesh 2009) are not well defined likely due to a small (less than micro-metric) particle size. On this spectrum, the strong band at ~665 cm−1 is attributed to both magnetite and maghemite.
Fig. 7 Thermomagnetic behavior of samples: a Brazilian, b Indian
total, c Indian magnetic extraction, d Indian rest, after magnetic extraction. Magnetic hysteresis of the samples: e Brazilian, f Indian
total, g Indian magnetic extraction, h Indian rest, after magnetic extraction. M/Ms relative magnetization (see discussion in text)
-10 -5 0 5 10 0,97 0,98 0,99 1,00 0,96 0,98 1,00 -10 -5 0 5 10 6- 9-Brazil REST India MF India Total India 0.97 0.98 0.99 1.00 1.00 0.98 0.96
Fig. 8 300-K Mössbauer spectra recorded for the Indian (TOT total
sample material, MF magnetic fraction, REST rest after magnetic extraction) and the Brazilian samples
373 374 375 376 377 378 379 380 381 382 383 384 385 386 387 388 389 390 391 392 393 394 395 396 397 398 399 400 401 402 403 404 405 406 407
REVISED PR
OOF
Indian sample
raman spectra acquired in two different massive Fe-oxide layers from the Indian sample share the following characteristics: spectra from the bright white spindle-shape hematite trellis arranged parallel to [111] direc-tions (Fig. 2c) show typical bands of hematite at 223– 226, 243–246, 291–298, 408–413, 495–503, 613–624, and ~1,320 cm−1 (Fig. 10a). A band at 660–664 cm−1 may indicate the contribution from magnetite. Additional unresolved bands hidden in the fluorescence background between 800 and 1,200 cm−1 have also been reported by Hanesh (2009). The octahedral grains contain rare darker patches that have two different spectrum types: in type 1, bands at 301, 410, 541, and 666 cm−1 (Fig. 10b) are characteristic of magnetite, and in type 2, bands at 239– 243, 297–299, 383–385, 416–417, 479–480, 548–550, ~681 cm−1 (Fig. 10c) reflect the presence of goethite (de
Faria et al. 1997; Hanesh 2009). The additional bands at ~1,000, ~1,110, and 1,300–1,314 cm−1 have also been reported for synthetic goethite (Hanesh 2009). Magh-emite has not been observed.
FIB-TEM Brazilian sample
In the Brazilian sample, two FIB-TEM foils were cut through magnetite (FIB foil 1; Fig. 11a, d) and through a hematite–magnetite part (FIB foil 2, Fig. 11e–i). FIB foil 1 represents a single magnetite crystal showing dislocations in some parts (arrow in Fig. 11a) and a patchy diffraction contrast (Fig. 11b, c). This mosaic texture of nanometer-sized Insel structures (black in Fig. 11b) likely indicates two phases slightly disorientated and/or with different stoichiometries. The presence of two different phases is confirmed by the splitting of the reflections in the SAED pattern (Fig. 11d). The major pattern shows lattice vector
100 300 500 700 900
intensity (arbitrary units)
Ht Ht Ht Ht mgh mgh Mt + mgh
B
A
wavenumber cm-1bright part spectrum
greyish patch spectrum Mt
Fig. 9 raman spectra from the Brazilian sample. a Hematite
spec-trum representative from the bright part. b In red, representative partial spectrum from darker grayish patches compared to hematite spectrum (in green). The shoulders (red arrows) are attributed after deconvolution to maghemite (mgh) typical bands and magnetite (black arrow). The other well-defined bands are from hematite (Ht), and the broad band at ~665 cm−1 is attributed to both magnetite (Mt)
and maghemite (mgh)
Fig. 10 representative raman spectra from the Indian sample. a
Hematite from the bright hematite trellis, b magnetite; and c goethite from small rare darker patches (see discussion in text)
408 409 410 411 412 413 414 415 416 417 418 419 420 421 422 423 424 425 426 427 428 429 430 431 432 433 434 435 436 437 438 439 440 441
REVISED PR
OOF
Fig. 11 FIB-TEM
investiga-tions on the Brazilian sample. FIB foil 1 in magnetite. a Over-view of the magnetite crystal with an area rich in dislocations shown by the arrow (HAADF image). b and c Bright field (BF) and complementary HrEM images, respectively, showing a patchy diffrac-tion pattern. d SAED pattern indexed as magnetite (mgt). The splitting of the highest intense peaks reveals the presence of possible maghemite (mht). FIB foil 2 through hematite and magnetite. e HAADF image of the foil showing the NW–SE crystal boundary between hema-tite (hm) and magnehema-tite (mag).
f BF image of lamellae within
the hematite crystal. g and h BF image showing the directions of two sets of twins and HrEM image of a twin set in the hema-tite matrix, respectively.
i SAED pattern of hematite with
split peaks reflecting a second diffraction pattern that could not be indexed
REVISED PR
OOF
lengths of 0.4115 and 0.4756 nm with an angle of 54.7° between planes (100) and (111) and lengths of 0.4756 and 0.4737 nm with an angle of 70.53° between planes (−111) and (111), lengths characteristic of magnetite. The sec-ond crystal indexed from the split peaks shows the same cubic system, but shorter lengths of the diffraction vector (111 = 0.4461 and 0.4756 nm), indicating a shrinking of the crystal lattice and is probably maghemite within mag-netite (Fig. 11d).
FIB foil 2 shows Z-contrasted parts of hematite and magnetite (Fig. 11e). The hematite crystals show scatter-ing areas resultscatter-ing in a patchy contrast as in the magnetite of FIB foil 1 and contain lamellae and twins (Fig. 11f, h). There are at least two sets of simple twins occurring along the (011) planes at angles of 64° and with widths between 7 and 40 nm (Fig. 11g, h). The SAED pattern from the hematite part (Fig. 11i) reveals a second diffraction pat-tern behind the hematite patpat-tern, as observed in FIB foil 1. For both sets of twins, the second diffraction pattern (not shown) can be indexed as magnetite or maghemite (or another non-stoichiometric magnetite). The SAED image acquired in the magnetite part only shows magnetite reflections.
Indian sample
The FIB foil cut in the Indian sample (Fig. 12a) shows numerous subhedral and interstitial crystals, magnetite and hematite (Fig. 12b), as indexed from the SAED pat-terns (Fig. 12c, d). As in the Brazilian sample, the mag-netite SAED pattern shows split peaks (magmag-netite and maghemite; Fig. 12c). The d-spacings of the a-axes were 0.421 and 0.414 nm corresponding to magnetite and hematite, respectively. All the magnetite crystals have the same orientation, and their curved interface suggests evi-dence for grain boundary migration (Fig. 12b). Lamellae, similar to those observed in the Brazilian sample, are pre-sent in both magnetite and hematite, but they are much more defined in magnetite (Fig. 12e). The interstitial hem-atite crystals are characterized by dislocations and a high porosity with fluid inclusions along the dislocation lines (Fig. 12f, g).
Discussion
Cross-cutting results from the different methods
XrD detected hematite as the major compound in both samples. The presence of magnetite was identified by the shoulder of the peak at ~2.52 Å in the long-term run of the Brazilian sample and by the clear splitting of this peak
in the magnetic fraction of the Indian sample, while peaks at ~2.96 and 1.61 Å in both samples could be attributed to both magnetite and maghemite. Although it is diffi-cult to discriminate between magnetite and maghemite as both have a spinel structure, the presence of maghemite is attested in both samples by the peak at 2.78 Å. goe-thite was identified in the Indian sample. The clear differ-ences in the magnetic behavior of hematite and magnetite (easily magnetized and demagnetized) allow identifying a higher content of hematite compared to magnetite in the Brazilian sample than in the Indian sample, inferred from the relative magnetization and the shape of the hysteresis loops. Moreover, maghemite was detected in the Brazil-ian sample and suspected in the IndBrazil-ian sample. Com-mon 300-K Mössbauer spectroscopy detected hematite in both samples, and magnetite and goethite in the Indian sample, but no maghemite. In-field Mössbauer spectros-copy would help detecting maghemite (Tucˇek and Zbo-ril 2005). raman spectroscopy identified hematite in the overall bright parts of the martite grains and magnetite in small darker patches from both samples. Moreover, maghemite or another non-stoichiometric magnetite was identified in the Brazilian sample. goethite was found in the Indian sample. FIB-TEM analyses detected hematite, magnetite and maghemite in both samples and allowed to determine the phase relation and structures. In the Brazil-ian sample, maghemite occurs as nanometer-sized blocks arranged in a mosaic texture within magnetite or in twin sets in hematite. In the Indian sample, magnetite and maghemite occurred as subhedral crystals, while hema-tite forms the interstitial crystals hosting dislocations and fluid inclusions.
Processes of magnetite to hematite transformation
During the replacement of magnetite by hematite, Fe2+ ions diffuse through defects of the oxygen framework to surface sites where they are oxidized and either added to the surface or removed by solution (Davis et al. 1968; Lindsley 1976). This leads to vacancies in the spinel struc-ture and the formation of cation-deficient magnetite or of maghemite, which converts to hematite. Alternatively, the transformation of magnetite to hematite may also result from non-redox reactions involving the leaching of Fe2+ ions by acidic solutions (Ohmoto 2003; Otake et al. 2007). In both cases, the transformation is accompanied by volume changes. While the redox-driven transformation implies a small volume increase, the non-redox transfor-mation of magnetite to hematite results in a large volume decrease, which would be associated with a large volume of pore spaces created by the leaching of Fe2+ ions (Mücke and Cabral 2005). 442 443 444 445 446 447 448 449 450 451 452 453 454 455 456 457 458 459 460 461 462 463 464 465 466 467 468 469 470 471 472 473 474 475 476 477 478 479 480 481 482 483 484 485 486 487 488 489 490 491 492 493 494 495 496 497 498 499 500 501 502 503 504 505 506 507 508 509 510 511 512 513 514 515 516 517 518 519 520 521 522 523 524 525 526 527 528 529 530 531 532 533 534 535 536 537
REVISED PR
OOF
The Indian martite shows a trellis structure similar to the mesh-textured martite reported in different BIFs from Western Australia (e.g., Morris 1980, 1985; Angerer et al. 2012). The trellis structure may be weathering-related by oxidation of magnetite (Angerer et al. 2012), as well as hydration of maghemite (Morris 1980, 1985) or non-stoi-chiometric magnetite. The latter process leads to the for-mation of goethite, which is subsequently leached. How-ever, trellis textures may be also caused through deuteric high-temperature oxidation followed by hydrothermal alteration (Alva-Valdivia and Urrutia-Fucugauchi 1998).
In the Indian martite, the lamellae observed in the magnet-ite grains may reflect magnetmagnet-ite–maghemmagnet-ite intergrowths (Fig. 12e). The presence of magnetite and maghemite in the subhedral crystals and interstitial crystals of hematite may suggest an exsolution process along parting planes leaving behind subhedral magnetite crystals with the same crystallographic orientation. The curved interfaces between magnetite–maghemite and hematite indicate typi-cal grain boundary migrations and dynamic crystallization of hematite, being related to a deformation event. Further-more, the observed porosity and the fluid inclusions in the
Fig. 12 FIB-TEM investigations on the Indian sample. a. Overview
of the FIB foil (HAADF image) with a zoomed inset. It shows the interface between numerous subhedral bright (1) and interstitial
darker (2) crystals. b BF image of the curved interface between netite (1) and hematite (2). C. SAED pattern of the subhedral
mag-netite, which shows the splitting of the diffraction peaks, indexed as magnetite (mgt) and maghemite (mht). d SAED pattern of the inter-stitial hematite. e BF image of the lamellae in magnetite. f High den-sity of dislocations d (BF image). g High poroden-sity and fluid inclusions in the hematite interstitial crystals (HAADF image)
538 539 540 541 542 543 544 545 546 547 548 549 550 551 552 553 554 555 556 557 558 559
REVISED PR
OOF
hematite interstitial crystals point to the presence of a fluid along the hematite interface. This interpretation is consist-ent with the geological environmconsist-ent: the Indian martite-hosting BIF was affected by greenschist facies metamor-phism related to the emplacement of the post-kinematic Chitradurga granite (2.60 ± 0.02 ga) and to gold miner-alization during compressional tectonics at 2.52 ga (Tay-lor et al. 1984; Kolb et al. 2004; Jayananda et al. 2006; Sarma et al. 2011). These oxidizing hydrothermal fluids dissolved carbonate minerals and precipitated hematite– magnetite spherules in cavities (Orberger et al. 2012). The transformation from magnetite into hematite and the trellis formation are thus attributed to this hydrothermal event, as proposed by Beukes et al. (2008) for the origin of porous martite from the Archean BIFs at Noamundi, NE India. Later weathering is, however, indicated by the presence of goethite and the porous mesh texture resulting from its partial dissolution.
The Brazilian martite has no trellis, but shows irregu-lar patches of magnetite within hematite, and neoformed euhedral tabular hematite crystals (Fig. 1b). Davis et al. (1968) attributed the epitaxial magnetite replacement by hematite to a relative volume decrease of 7.8 vol% during the first step of the transformation of magnetite into magh-emite. According to Barbosa and Lagoeiro (2010), the ori-ented growth of tabular hematite crystals is controlled by the octahedral planes of old magnetite grains, and, when dislocations are present, may be influenced by these crys-tal defects. For these authors, the direct transformation from magnetite into hematite occurs without the interme-diate step of maghemite. However, the here studied martite clearly shows features indicating that the transformation comprises a maghemite step: (1) in hematite, the presence of lamellae and twins (Fig. 11h). The lamellae result from a structural change without chemical change, i.e., they still have the hematite chemistry, but a maghemite structure. The alignment along (111) of the structural defects created by the formation of maghemite is reflected by the observed lattice twins, the remnants of which are visible in the lamellae; (2) in magnetite, non-stoichiometric zones (Insel structures) and nano-scale dislocations, pointing to defor-mation (Fig. 11a, b). It is suggested that this deformation initiated the transformation from magnetite via magh-emite into hematite along crystal planes. This scenario is in agreement with the geological history of the underly-ing phyllites and hydrothermal veins, which experienced later deformation (Cabral et al. 2011, 2012). The above-outlined arguments favor thus a fluid-deformation-induced magnetite–hematite transformation via a maghemite step prior to lateritization.
Conclusion
The analytical methods used during this study give com-plementary information, as different physical properties are analyzed at different scales. In both samples, hema-tite was detected as the major, and magnehema-tite as the minor component, as these minerals have clear different mag-netic behavior. raman spectroscopy detects maghemite or a non-stoichiometric magnetite. XrD spectra show a small peak at 2.78 Å indicative for maghemite. FIB-TEM shows clear deformation structure (grains bound-ary migration, dislocations and twinning). Although deformation features differ in the two studied martites, in agreement with the geological environment, deformation-induced oxidizing fluids are proposed for the transfor-mation of magnetite into hematite via a maghemite step for both samples. This study shows that martite found in supergene environment may result from earlier hypogene processes.
Acknowledgments This project was funded by the national PNP
Planétologie, PrES UNIVErSUD Planétologie and the UMr IDES 8148 (CNrS-UPS) and COFECUB-CAPES (UPS, Orsay France-UFMg, Belo Horizonte, Brazil). It was part of the ESF project “Early Habitats of Early life”. The authors thank rémy Pichon, Luce Delabesse, Valérie godard and Olivier Dufour (UMr IDES), gilles Montagnac (ENS-Lyon, Lyon) and Anja Schreiber (gFZ-Potsdam) for technical help. The authors thank M. rieder for handling the man-uscript, A. Cabral, H. Siemes and T. Angerer for comments and sug-gestions to fundamentally improve the manuscript.
Appendix
raman spectra of goethite in the Indian sample. The spectra were acquired under the conditions reported in the text and at the same spot every 40 s. red lines cor-respond to the position of active modes for goethite (de Faria et al. 1997; Hanesh 2009). A band at ~418 cm−1 (dashed red line) on the wing of the largest peak at 385 cm−1 has also been reported by Hanesh (2009). According to these authors, the broad bands above 1,000 cm−1 are not “diagnostic” for goethite and may record some contaminant species. Apart from a decrease in the background fluorescence between 1,000 and 1,400 cm−1 with increasing laser exposition time, there is no significant variation in the observed spectral modes, either in position or in intensity, for a total time of irra-diation up to 8 min. Moreover, there is no appearance of new bands, which would indicate a possible transforma-tion of goethite under the laser beam (in maghemite or hematite; Hanesh 2009). 560 561 562 563 564 565 566 567 568 569 570 571 572 573 574 575 576 577 578 579 580 581 582 583 584 585 586 587 588 589 590 591 592 593 594 595 596 597 598 599 600 601 602 603 604 605 606 607 608 609 610 611 612 613 614 615 616 617 618 619 620 621 622 623 624 625 626 627 628 629 630 631 632 633 634 635 636 637 638 639 640 641 642 643 644 645 646 647 648 649 650 651 652 653 654 655 656 657
REVISED PR
OOF
References
Alva-Valdivia LM, Urrutia-Fucugauchi J (1998) rock magnetic prop-erties and ore microscopy of the iron ore deposit of Las Truchas, Michoacan, Mexico. J Appl geophys 38:277–299
Angerer T, Hagemann Sg, Danyushevsky V (2012) geochemical evo-lution of the Banded iron formation-hosted high-grade iron ore system in the Koolyanobbing greenstone Belt, Western Australia. Econ geol 107:599–644
Bachmann Hg (1954) Uber Martiterze von Talberg (Viirmland) Schweden. Neues Jahrb Mineral 6:131–136
Banerji PK (1984) On some geochemical features of the vanadiferous magnetite deposits of Kumhardubi and Betjharan, Mayurbhanj district, Orissa, India. Chem geol 43:257–269
Barbosa PF, Lagoeiro L (2010) Crystallographic texture of the mag-netite-hematite transformation: evidence for topotactic relation-ships in natural samples from Quadrilátero Ferrífero, Brazil. Am Mineral 95:118–125
Beukes NJ, Mukhopadhyay J, gutzmer J (2008) genesis of high-grade iron ores of the Archean iron ore group around Noamundi, India. Econ geol 103:365–386
Brown DA, Sherrif B, Sawick JA (1997) Microbial transformation of magnetite to hematite. geochim Cosmochim Acta 61:3341–3348 Cabral Ar, Lehman B, Tupinamba M, Wiedenbeck M, Brauns M
(2011) geology, mineral chemistry and tourmaline B isotopes of the Córrego Bom Sucesso area, southern. Serra do Espinhaço, Minas gerais, Brazil: implications for Au–Pd–Pt exploration in quartzitic terrain. J geochem Explor 110:260–277
Cabral Ar, Wiedenbeck M, Koglin N, Lehmann B, de Abreu Fr (2012) Boron-isotopic constraints on the petrogenesis of hema-titic phyllite in the southern Serra do Espinhaço, Minas gerais, Brazil. Lithos 140–141:224–233
Colombo U, Cazzarini F, Lanzavecchia g, Sironi E (1965) Magnetite oxidation: a proposed mechanism. Science 147:1033
Davis BL, rapp g, Walawender MJ (1968) Fabric and structural char-acteristics of the martitisation process. Am J Sci 266:482–496 Day r, Fuller MD, Schmidt VA (1977) Magnetic hysteresis properties
of synthetic titanomagnetites. Phys Earth Planet Inter 13:260–266 De Boer CB, Dekkers MJ (2001) Unusual thermomagnetic behaviour
of haematites: neoformation of a highly magnetic spinel phase on heating in air. geophys J Int 144:481–494
de Faria DLA, Venancio-Silva S, de Oliveira MT (1997) raman microspectroscopy of some iron oxides and oxyhydroxides. J raman Spectrosc 28:873–878
El Mendili Y, Bardeau JF, randrianantoandro N, gourbil A, greneche JM, Mercier AM, grasset F (2010) New evidence of in situ laser irradiation effects on γ-Fe2O3 nanoparticles: a raman
spectro-scopic study. J raman Spectrosc 42:239–242
gehring AU, Fischer H, Louvel M, Kunze K, Weidler Pg (2009) High temperature stability of natural maghemite: a magnetite and spec-troscopic study. geophys J Int 179:1361–1371
gruner JW (1922) Organic matter and the origin of the Biwabik iron-bearing formation of the Mesabi range. Econ geol 17:407–460 gruner JW (1926) Magnetite–martite–hematite. Econ geol 21:
375–393
gruner JW (1929) Structural reasons for oriented intergrowths in some minerals. J Mineral Soc Am 14:227–231
Hanesh M (2009) raman spectroscopy of iron oxides and (oxy) hydroxides at low laser power and possible implications in envi-ronmental magnetic studies. geophys J Int 177:941–948
Jayananda M, Chardon D, Peucat J-J, Capdevila r (2006) 2.61 ga potassic granites and crustal reworking in the western Dharwar craton, Southern India: tectonic, geochronological and geochemi-cal constraints. Precambrian res 150:1–26
Joint Committee on Powder Diffraction Standard (1974) Selected powder diffraction data for minerals. Joint Committee on Powder Diffraction Standards, Pennsylvania
Kolb JH, rogers A, Sinderen S, Vennemann T, Böttcher ME, Meyer FM (2004) The role of a transcrustal shear zone in orogenic gold mineralization at the Ajjanahalli mine, Dharwar craton, South India. Econ geol 99:743–759
Kullerud g, Donnay g, Donnay JDH (1969) Omission solid solu-tion in magnetite: kenotetrahedral magnetite. Z Kristallogr Bd 128:l–17
Kumar B, Das Sharma S (1998) Carbon isotope systematics of graph-ites from Dharwar craton, Southern India: implications to their source and post-depositional alterations. Curr Sci 75:396–397 Lagoeiro LE (1998) Transformation of magnetite to hematite and its
influence on the dissolution of iron-oxide minerals. J Metamorph geol 16:415–423
Lepp H (1957) Stages in the oxidation of magnetite. Am Mineral 42:679–681 658 659 660 661 662 663 664 665 666 667 668 669 670 671 672 673 674 675 676 677 678 679 680 681 682 683 684 685 686 687 688 689 690 691 692 693 694 695 696 697 698 699 700 701 702 703 704 705 706 707 708 709 710 711 712 713 714 715 716 717 718 719 720 721 722 723 724 725 726 727 728 729 730 731 732 733 734 735 736 737 738
REVISED PR
OOF
Lindsley DH (1976) Experimental studies of oxide minerals. In: rumble D III (ed) reviews of mineralogy, oxide minerals, vol 32, 2nd edn. BookCrafters, Chelsea, pp L61–L88
Morris rC (1980) A textural and mineralogical study of the relation-ship of iron ore to banded iron ore formation in the Hamersley iron province of Western Australia. Econ geol 75:184–209 Morris rC (1985) genesis of iron ore in banded iron formation by
supergene and supergene-metamorphic processes—a conceptual model. In: Wolf KH (ed) Handbook of strata-bound and strati-form ore deposits, vol 13. Elsevier, Amsterdam, pp 73–235 Mücke A, Cabral Ar (2005) redox and non-redox reactions of
mag-netite and hematite. Chem Erde 65:271–278
Ohmoto H (2003) Non-redox transformations of magnetite–hematite in hydrothermal systems. Econ geol 98:157–161
Orberger B, Wagner C, Wirth r, Quirico E, gallien JP, Derré C, Mon-tagnac g, Noret A, Jayananda M, Massault M, rouchon V (2012) Origin of iron-oxide spherules in the banded iron formation of the Bababudan group, Dharwar Craton, Southern India. J Asian Earth Sci 52:31–42
Otake T, Wesolowski DJ, Anovtz LM, Allard LF, Ohmoto H (2007) Experimental evidence for non-redox transformations between magnetite and hematite under H2-rich hydrothermal conditions. Earth Planet Sci Lett 257:60–70
roberts AP, Cui Y, Verosub KL (1995) Wasp-waisted hysteresis loops: mineral magnetic characteristics and discrimination of components in mixed magnetic systems. J geophys res 100(B9):17909–17924
Sarma SD, Fletcher Ir, rasmussen B, McNaughton NJ, Mohan Mr, groves DI (2011) Archean gold mineralization synchronous with late cratonization of the Western Dharwar Craton, India: 2.52 ga U–Pb ages of hydrothermal monazite and xenotime in gold deposits. Miner Depos 46:273–288
Shebanova ON, Lazor P (2003a) raman study of magnetite (Fe3O4): laser-induced thermal effects and oxidation. J raman Spectrosc 34:845–852
Shebanova ON, Lazor P (2003b) raman spectroscopic study of mag-netite (FeFe2O4): a new assignment for vibrational spectrum. J Solid State Chem 174:424–430
Srinivasan r, Ojakangas rW (1986) Sedimentology of quartz-pebble conglomerates and quartzites of the Archaean Bababudan group, Dharwar Craton, South India: evidence for early crustal stability. J geol Soc India 94:199–214
Swanson-Hysell NL, Feinberg JM, Berquô TS, Maloof AC (2011) Self-reversed magnetization held by martite in basalt flows from the 1.1 billion-year-old Keweenawan-rift, Canada. Earth Planet Sci Lett 325:171–184
Tarling DH (1983) Paleomagnetism, principles and applications in geology, geophysics and archaeology. Chapman and Hall, New York
Tauxe L, Mullender TAT, Pick T (1996) Potbellies, wasp-waisted, and superparamagnetism in magnetic hysteresis. J geophys res 101(B1):571–583
Taylor PN, Chadwick B, Moorbath S, ramakrishanan M, Viswanatha MN (1984) Petrography, chemistry and isotopic ages of penin-sular gneisses, Dharwar, acid volcanics and Chitradurga granite with special reference to Archaean evolution of Karnataka craton, Southern India. Precambrian res 23(3–4):349–375
Thompson r, Oldfield M (1986) Environmental magnetism. Allen and Unvin, London
Tucˇek J, Zboril r (2005) Zero-field and in-field Mössbauer spec-troscopy as a tool for structural and magnetic characteriza-tion of maghemite (γ-Fe2O3) nanoparticles. Czechoslov J Phys 55:893–911
Wasilewski P (1973) Magnetic hysteresis in natural materials. Earth Planet Sci Lett 20:67–72
Weber H-P, Hafner SS (1971) Vacancy distribution in nonstoichiomet-ric magnetites. Z Kristallogr New Cryst Struct 133:327–340 Wirth r (2004) Focused Ion Beam (FIB): a novel technology for
advanced application of micro-and nanoanalysis in geosciences and applied mineralogy. Eur J Mineral 16:863–876
Wirth r (2009) Focused ion beam (FIB) combined with SEM and TEM: advanced analytical tools for studies of chemical compo-sition, microstructure and crystal structure in geomaterials on a nanometer scale. Chem geol 261:217–229
739 740 741 742 743 744 745 746 747 748 749 750 751 752 753 754 755 756 757 758 759 760 761 762 763 764 765 766 767 768 769 770 771 772 773 774 775 776 777 778 779 780 781 782 783 784 785 786 787 788 789 790 791 792 793 794 795 796 797 798 799 800 801 802 803 804 805 806 807 808 809 810 811 812 813