HAL Id: hal-01971706
https://hal.archives-ouvertes.fr/hal-01971706
Submitted on 4 Dec 2020HAL is a multi-disciplinary open access archive for the deposit and dissemination of sci-entific research documents, whether they are pub-lished or not. The documents may come from teaching and research institutions in France or abroad, or from public or private research centers.
L’archive ouverte pluridisciplinaire HAL, est destinée au dépôt et à la diffusion de documents scientifiques de niveau recherche, publiés ou non, émanant des établissements d’enseignement et de recherche français ou étrangers, des laboratoires publics ou privés.
Gas-induced selective re-orientation of Au-Cu
nanoparticles on TiO 2 (110)
Axel Wilson, Aude Bailly, Romain Bernard, Yves Borensztein, Alessandro
Coati, Bernard Croset, Hervé Cruguel, Ahmed Naitabdi, Mathieu Silly,
Marie-Claire Saint-Lager, et al.
To cite this version:
Axel Wilson, Aude Bailly, Romain Bernard, Yves Borensztein, Alessandro Coati, et al.. Gas-induced selective re-orientation of Au-Cu nanoparticles on TiO 2 (110). Nanoscale, Royal Society of Chemistry, 2019, 11 (2), pp.752-761. �10.1039/C8NR07645F�. �hal-01971706�
Gas‐induced selective re‐orientation of Au‐Cu nanoparticles on TiO
2(110)
Axel WILSONa,c,*, Aude BAILLYd, Romain BERNARDa, Yves BORENSZTEINa, Alessandro COATIc, Bernard CROSETa, Hervé CRUGUELa, Ahmed NAITABDIe, Mathieu SILLYc, Marie‐Claire SAINT‐LAGERd, AlinaVLADc, Nadine WITKOWSKIa, Yves GARREAUb, c, Geoffroy PREVOTa,*
a Sorbonne Université, CNRS, Institut des NanoSciences de Paris, UMR 7588, F‐75005, Paris, France b Université Paris Diderot, Sorbonne‐Paris‐Cité, MPQ, UMR 7162 CNRS, Bâtiment Condorcet, Case 7021, 75205 Paris CEDEX 13, France c Synchrotron SOLEIL, L’Orme des Merisiers Saint‐Aubin ‐ BP 48 91192 Gif‐sur‐Yvette CEDEX, France d Institut Néel, CNRS et Université Joseph Fourier, BP 166, F‐38042 Grenoble Cedex 9, France e Sorbonne Université, CNRS, Laboratoire de Chimie Physique Matière et Rayonnement, 4, place Jussieu 75005 Paris * Corresponding authors: axel.wilson@diamond.ac.uk, prevot@insp.jussieu.fr
Abstract
Au‐Cu bimetallic nanoparticles (NPs) grown on TiO2(110) have been followed in‐situ using grazing
incidence x‐ray diffraction and x‐ray photoemission spectroscopy from their synthesis to their exposure to a CO/O2 mixture at low pressure (P < 10‐5 mbar) and at different temperatures (300 K–
470 K). As‐prepared samples are composed of two types of alloyed NPs: randomly oriented and epitaxial NPs. Whereas the introduction of CO has no effect on the structure of the NPs, an O2
introduction triggers a Cu surface segregation phenomenon resulting in the formation of a Cu2O
shell reducible by annealing the sample over 430 K. A selective re‐orientation of the nanoparticles, induced by the exposure to a CO/O2 mixture, is observed where the randomly oriented NPs take
advantage of the mobility induced by the Cu segregation to re‐orient their Au‐rich core relatively to the TiO2(110) substrate following specifically the orientation ((111)NPs//(110)TiO2) when others
epitaxial relationships were observed on the as‐prepared sample.
I) Introduction
Supported metallic nanoparticles (NPs) have a prominent place in the field of catalysis. Haruta’s discovery showing that Au NPs activity exceptionally improves when their size is reduced down to a few nm1,2,3 triggered an intense and fruitful research activity in catalysis.4,5,6,7,8 This activity was further stimulated by studies showing that the addition of a second metal could improve the catalytic properties of NPs by either promoting their activity and selectivity or increasing their stability.9, 10, 11, 12, 13
The enhancement of the activity and/or the stability of the NPs is often attributed to synergistic effects where the presence of more than one metal in the catalyst improves its catalytic properties beyond the sum of the properties of the different metals tested separately. In the case of Au‐Cu NPs it has been shown that the addition of Cu to Au has a promoting effect on different reactions such as carbon monoxide oxidation reaction,14,15,16,17,18 PROX reaction (preferential CO oxidation in the presence of hydrogen),15,19,20,21,22,23,24 propene epoxidation,25,26 selective hydrogenation of butadiene27,28 and cinnamaldehyde29. More recently Au‐Cu NPs have shown a promising efficiency in the challenging fields of fuel production from carbon dioxide30,31,32,33 and of wastewater treatment,34 combining the catalytic properties of the NPs and the photo‐catalytic properties of a TiO2 support. However, synergistic effects alone do not explain all the discrepancies
between monometallic and bimetallic NPs regarding the catalytic performance and it is often difficult to determine the origin of this difference.35
Several studies have shown that in addition to the size, the structure of the NPs and the ability of Au and Cu to form an alloy, and/or Cu to form an oxide, have a crucial influence on the activity of the NPs. For Au‐Cu NPs deposited on silica gel15 and SBA‐15,14 X‐Ray Diffraction (XRD) spectra measured after reduction under H2 at 820K for a series of composition ranging from pure Au
to pure Cu showed the formation of alloyed particles of about 3 – 4 nm in diameter. In the case of TiO2 supported Au‐Cu NPs, the presence of a Cu oxide layer sandwiched between the substrate and
the Au NPs has been shown to improve the activity of the NPs.16 It was thus suggested that the synergistic effect occurs between Au and Cu oxide.36 Bauer et al. have compared the activity of Au‐ CuOx/SiO2 NPs to Pt/Al2O3 NPs for the CO oxidation below 150°C and measured a significant
improvement for Au‐CuOx/SiO2 as well as a stabilisation attributed to an ‘anchoring’ effect of the
NPs over the silica support.37 Delannoy et al. reached a similar conclusion for selective oxidation of butadiene by Au‐Cu NPs on TiO2.28 An initial activation phase of the catalyst was observed during the
reaction which was tentatively attributed to the segregation of Cu at the surface of the NPs. The influence of catalyst pre‐treatments such as reduction and calcination have recently been investigated by Liao et al. for the PROX reaction for Au‐Cu on CeO223 and on Al2O3 NPs.24 In both
cases, a reduction pre‐treatment leading to alloyed NPs was shown to improve the CO conversion and the stability of the NPs in the presence of reactants. Liquid phase selective hydrogenation of cinnamaldehyde by Au‐Cu/CeO2 NPs was investigated in mild conditions (70°C, 1 atm).29 The
structure of the NPs after the reduction pre‐treatment was investigated using HAADF‐STEM and was shown to form alloyed NPs with no visible segregation.
to poisoning. Grazing incidence x‐ray diffraction (GIXD) using synchrotron radiation is an excellent technique to carry out this type of investigation as the low incidence angle allows to be extremely sensitive to the surface and the high photon energy used (5 – 25 keV) allows the beam to penetrate dense reactive phases (gas or liquid) with limited absorption. In this study, in‐situ GIXD was used to fully characterize the structure of Au‐Cu NPs deposited onto TiO2 (110) single crystals. The evolution
of the structure of each type of Au‐Cu NPs was monitored in‐situ during subsequent and simultaneous exposure to oxygen and carbon monoxide. The structural characterization was then complemented with x‐ray photoemission spectroscopy (XPS) investigation that corroborates GIXD findings and unveils the diffusion mechanisms leading to the formation of Cu oxide that may explain the enhanced activity of bimetallic Au‐Cu NPs.
II) Experiment
All experiments were performed on UHV set‐ups with a base pressure of a few 1 × 10‐10 mbar. Rutile TiO2 (110) single crystals (from MaTecK GmbH) were cleaned by several cycles of Ar
sputtering (PAr = 7 × 10⁻⁵ mbar, 20 minutes, E = 1 keV) and annealing under UHV (10 minutes at 1000
K), leading to slightly reduced samples. Au and Cu were evaporated in situ under UHV either from e‐ beam evaporators or from effusion cells, using high purity Au and Cu (Alfa Aesar). The amounts of Au and Cu evaporated were measured during the experiments with a flux monitor in the case of the e‐ beam evaporators and with a quartz microbalance in the case of the effusion cells. During each experiment a calibration sample was realized by depositing a large amount of Au and Cu (typically 2 ML of each) on a TiO2 sample. The quantity of Au or Cu present on the calibration samples was
precisely determined using Rutherford backscattering spectroscopy (RBS) performed with a van de Graaff accelerator at INSP. An excellent agreement was found between doses estimated using the flux monitor or the quartz microbalance and the values obtained using RBS. Ultrapure O2 and CO
were introduced in the chambers using precision leak valves.
GIXD experiments were performed at the SixS beamline of SOLEIL synchrotron and at the BM32 beamline of ESRF synchrotron. GIXD measurements were performed at an energy of 15 keV and a grazing incidence angle of 0.2°. The x‐ray diffraction data presented in this study are indexed according to the surface unit cell of TiO2 (110) described by the following parameters: a = 0.296 nm, b = c = 0.648 nm, and α = β = γ = 90°. h, k, and l Miller indices are used for indexing reflections in the reciprocal space. As a matter of clarity some of the data have been plotted against the modulus of the momentum transfer corresponding to 2 1 2 2 2 2 2 2 2 c l b k a h q
. The NPs lattice parameters were determined for each peak using the centre of a Gaussian fit. The size of as‐prepared NPs were determined after the synthesis using the Scherrer equation38 and a height/diameter parameter forthe NPs of 0.89, obtained from previous investigations.42 However, due to the experimental set‐up utilised (point detector and detector slits) and the fact that the aspect ratio of the crystalline domain of the NPs was evolving during the experiment, no adequate parameter was found to input in the Scherrer formula to satisfactorily represent the evolution of the size of the NPs.
XPS experiments were performed at the TEMPO beamline of SOLEIL synchrotron. Au 4f and Cu 3p core levels were recorded in the same kinetic energy window using normal emission of the photoelectrons and photon energies of 250 eV, 700 eV and 1050 eV with an overall resolution E/E of about 5000. Intensities were normalized to the incoming photon flux recorded on a gold mesh located prior to the analysis chamber. Shirley background has been removed from all XPS spectra. The binding energy (BE) has been calibrated with respect to the Fermi energy measured on the Ta stripes holding the sample. III) GIXD results a) NPs structure under UHV Hereafter, we present the results obtained under UHV on a reference sample composed of Au52Cu48 NPs of about 2 nm in size grown on a rutile TiO2(110) substrate. Those NPs have been
obtained by the successive evaporations of 9.5 × 10¹⁴ at.cm‐2 of Au at 570K and 8.8 × 10¹⁴ at.cm‐2 of Cu at room temperature. This procedure has previously been shown to lead to the formation of bimetallic particles.42
Figure 1(a) shows a (h, k, l=0.05) map of the intensity scattered by the sample in the reciprocal space. Intense sharp peaks (red/black) matching integer values of h and k, correspond to Bragg reflections of the TiO2 substrate. The broad spots at non‐integer values of h and k and the ring
centred at the origin are due to the scattering by the NPs. The broad spots are attributed to crystalline NPs that have grown on the TiO2(110) substrate with specific epitaxial relationships
detailed in figure 1(b). The ring corresponds to randomly oriented NPs. In the following, the first type of NPs will be referred as epitaxial NPs and the second type as randomly oriented NPs. Figure 1(b) is a schematic representation of the different features present in figure 1(a). The black spots correspond to the substrate Bragg peaks, blue, red and green spots to diffraction peaks of oriented NPs and the purple arc to the signal obtained from randomly oriented NPs.
FIG 1: (a Au52Cu48 Bragg r scattere the direc spots sh indexing a (110) disorder with the compos peak wa structur Cu evap structur experim belong t studies3 For each with an (hkl)(mnp) to the (1 a) 2D (h, k, 8 NPs evapo reflections, r ed by random ction of the r The structur hown on the g all the spot peak demon red fcc struc e slightly qu ition. For all as not prese e. A small di poration. For
e and the ments.
Even if they to a single e 9,40,41,42 for A h of these ep intense (22 ) where (hkl) 110)TiO2 surfa l = 0.05) m rated on ru red, green a mly oriented reference sca
re and epita map 1(a). A ts. All diffrac nstrates a c cture for wh uadratic L10 l the other d nt. However stortion with r the sake o specific lat y correspon epitaxial rela Au NPs are p pitaxial relati 20)common pea ) is a given B ace. Hence, u
ap of the x‐ tile TiO2(110 and blue do NPs. The thr ans drawn in axial relation As in previous tion spots m hemical ord
ich this pea structure ( deposits stud r, we always h respect to of simplicity, ttice consta d to the sa tionship. Th present: (111 ionships, the ak. For the s Bragg reflect using GIXD, i ‐ray intensity 0). (b) schem ots: reflectio ree red lines n figure 2.
nship of orie s studies, th match a slight
er of the ep k is extinct. c/a = 0.935 died, corresp s found a sim a cubic struc , the spots ants for eac
me cubic st ree epitaxia 1)NPs//(110)T
e [1‐10]NPs//[
sake of clarit tion which a
it is possible
y scattered matic represe ons for epita marked ‘k‐s ented NPs w e epitaxial re tly distorted pitaxial NPs, These obse 5) that is th ponding to d milar matchin cture was als have been i ch spots w tructure, all l relationshi iO2, (001)NPs/ 001]TiO2 cond
ty, the refle rises from N to follow th
by a sample entation of axial NPs, p can’, ‘hk‐sca ere determi elationships cubic struct as compare ervations are e stable bu different com ng with a sli so found for indexed with were measur diffraction ps, already /(110)TiO2 an dition is also ctions meas Ps whose (m he evolution e composed (a). Black d purple ring: an’ and ‘h‐sca
ined by inde were determ ture. The pre ed with a ch e in good ag
lk structure mpositions, t ghtly distort pure Au NPs h respect to red through spots found reported in nd (112)NPs// o satisfied, as sured are ind mnp) plane is of each spec of 2 nm dots: TiO2 intensity an’ show exing the mined by esence of hemically greement for this the (110) ted cubic s prior to o a cubic hout the d do not previous /(110)TiO2. ssociated dexed as s parallel cific type
of NPs upon gas exposure by collecting the intensity scattered in the reciprocal space (red lines in figure 1(b)). The NPs lattice parameter measured from the (111)112 spot is 0.382 nm, it corresponds
to a Au47Cu53 alloy according to the Vegard’s law. This is consistent with the average sample
composition (Au52Cu48) and indicates that the successive evaporation of Au and Cu forms bimetallic
alloyed NPs of the desired composition.
b) CO exposure followed by CO + O2 exposure
In a second experiment, Au38Cu62 NPs obtained by the successive deposition of 8.6 × 10¹⁴
at.cm‐2 of Au and 1.4 × 10¹⁵ at.cm‐2 of Cu on a TiO2 substrate at 415 K have been exposed, at room
temperature, to CO and to a CO+O2 mixture. In order to follow the evolution of the structure of each
type of NPs the h‐, k‐ and hk‐ reference scans corresponding to the red lines shown in figure 1(b) have been acquired repeatedly before and during gas exposure.
Figure 2 shows the comparison between the same h‐, k‐ and hk‐scans acquired in UHV after growth (green triangles in figure 2(a), (b) and (c) respectively), after a first CO exposure (PCO = 1 × 10‐ 6 mbar; red squares) and after a subsequent exposure to a CO + O
2 (1:1) mixture (PCO+O2 = 2 × 10‐6
mbar; blue circles). The structure of the as‐prepared Au‐Cu NPs is determined from the reference scans realized under UHV condition (green triangles). The peak around 28.7 nm‐1, which is present on all the scans, corresponds to the (111) ring feature previously ascribed to randomly oriented NPs on the substrate. In the case of UHV, it is associated with a lattice parameter of 0.380 nm indicating that NPs are alloyed. The presence of a small (220)common peak on the h‐scan around 45.6 nm‐1 shows
the presence of epitaxial NPs. However, the absence of the (220)001 peak in the k‐scan and the weak
intensity of the (220)111 peak in the hk‐scan as compared to the ring intensity, suggest that most of
the NPs are randomly oriented. A lattice parameter of 0.390 nm was extracted from the (220)common
peak showing that epitaxial NPs are also alloyed. From the width of the diffraction spots, we estimate that the randomly‐oriented particles have a mean size of 1.8 nm, whereas (112) epitaxial nanoparticles have a mean size of 2.0 nm. The difference in lattice parameter between epitaxial and randomly oriented NPs could either be attributed to a slight difference in composition or to a different of strain between the two types of NPs. We have previously shown that for small Au particles, a decrease of the lattice constant is observed when the size decays. 42,43 In the present case, we do not observe significant differences between the value of the position of the (111) peak found for randomly‐oriented particles and for (112) oriented particles. The difference with the position of the (220)common peak could thus more probably reflect a lattice distortion of the cubic
lattice. However the proximity of the (220)common peak and the TiO2 Bragg peak may influence the
measure addition results i in figure FIG 2. Di direction h=0, l=0 mbar CO rectangl vertical been fitt fit for ea paramet fitted fr and the changes The introdu ed along the n of 10‐6 mba n a drastic c e 2). iffracted inte ns of the rec 0.05. (c), for O exposure. les indicate lines show th To follow pr ted with a Vo ach scan are ters of the (1 om the h‐sc parameters As already s of the latti
uction of 10 e h‐, k‐ and h ar of O2 lead hange of the ensity for Au ciprocal spac k=3.79h, l=0 Blue circles: the regions he shift of th recisely the s oigt profile. e shown in fi 111)ring and ( cans. The pa of the (220) mentioned, ce paramete 0‐6 mbar of hk‐ direction ing to a tota e structure fo 38Cu62/TiO2 N ce, the curves 0.05. Green : during 1 × where the (2 he peaks afte sample evolu The lattice p gure 3 (a) an (220)common p rameters of 111 (purple cr no evolutio ers occurred
CO has pra ns as can be l pressure of or both epita NPs, as a fun s have been triangles: as 10‐6 mbar C 220) reflecti er the introdu ution, all the parameter an nd (b) respe peaks (green f the (111)11 rosses) from on is observ d immediate actically no seen in figur f 2 × 10‐6 mb axial and ran nction of mo shifted for c s prepared N CO + 1 × 10‐6 ions of epita uction of oxy peaks prese nd integrated ctively, as a triangles an 2 (blue circle m the hk‐scan ed after int ely after the
influence o re 2 (red squ bar of CO + O ndomly orien mentum tran clarity. (a) fo NPs. Red squ 6 mbar O 2 ex axial NPs are ygen. ented in the r d intensity a function of d red square es) were fitt
ns.
roduction of introduction
on any of th uares). Howe O2 in (1:1) pr nted NPs (blu nsfer, along or k=0, l=0.0 uares: during xposure. The e expected. T reference sc ssociated to CO and O2 d es respective ted from the
f CO, but im n of O2 (firs he peaks ever, the roportion ue circles different 5. (b) for g 1 × 10‐6 e dashed The plain ans have the best dose. The ely) were e k‐scans mportant t dashed
line from from the nm for paramet exposur occurrin ring feat ratio as correspo favoured figure 3 intense is observ the dash Fig 3: Ev in the re squares: below th m the left) a e left). Event the (220)com ter found fo re under the ng to the int
ture drops to seen in fig
onds to the ( d, as shown (b)), which peak with th ved for the ( hed rectangle volution of th eference sca : (220)common, he backgroun nd on the in tually, the la mmon reflectio or pure Au N e same con egrated inte o a point wh gure 2(a) an (111)112 refle by the gain could not b he exception (111)112 refle e in figure 2 he lattice pa ans (h‐scan, h , purple cros nd level afte tegrated int attice parame
on to about NPs of simila ditions (10‐6 ensity of the ere after 300 nd (c). A sh
ection of epit in intensity. be fitted init
of the (220) ection and no (b). rameter (a) hk‐scan or k sses: (220)11 r 300 L of O2 tensity after eter shifts fr t 0.402 nm r size.42 At t 6 O 2). The m
e peaks depe 0L of O2, no
ifted (111)
taxial NPs. In The (220)111
ially due to )common peak. o peak can b and of the in k‐scan). Gree 11. The inten 2 exposure. exposure to rom 0.386 nm correspondi this point, no most remark end on the t
peaks can b reflection re
nterestingly,
1 contributio
a low signa In the mean be fitted for ntensity (b) a en triangles: sity associat o 100 L of O2 m for (111) r ng approxim o evolution kable point type of NPs. e fitted due emains on t a specific ep n (figure 2 (c l/noise ratio ntime, no dra the (220)001 associated w (111)ring, blu
ted with the
2 (second das
reflections a mately to th is seen upon
is that the The signal f to a low sign the figure 2 pitaxial relati c) and purple o, becomes t astic gain in reflection a with diffracti ue dots: (111 e (111)ring pe shed line nd 0.390 he lattice n further changes from the nal/noise 2(b) as it onship is e crosses the most intensity s seen in on peaks 1)112, red ak drops
was kep this step UHV. Du position paramet lattice p the initi paramet Figure 4 (respect increase 1014 at.c obtained Au51Cu49 an estim particles After this ex pt under UHV p. The NPs ha uring this pr s is represen ter remains parameter of al NP state, ter is not rec 4: Evolution o tively in blue ed progressiv
c) O2 exposu A third sam cm‐2 of Au an d have a latt 9. For this sa mated size a s correspond xposure to C V for severa ave then bee rocess, the e nted in figure close to the f the NPs is alloyed NPs covered. of the lattice e, red and p vely to 365K,
ure followed mple has bee nd 8.8 × 101 tice paramet mple, partic after growth ded to small CO and O2, th
al hours. No
en annealed evolution of e 4. Up to 42 one of pure measured w . However, f e parameter urple) as a f 420K and 47 d by CO + O2 n prepared 4 at.cm‐2 of ter equal to les were ma h of around NPs with a m he gas was e evolution o progressive the lattice p 20 K, no sign e Au. At a te which could for the anne measured fo function of 70K. exposure at room tem Cu, which sh 0.384 nm, w ainly epitaxia 1.9 nm. Th mean size of evacuated fro of the diffrac
ly from room parameter o nificant varia emperature o be associate ealing condit or the (111)1
time as the
mperature w hould lead to which corres al following (
e signal ass around 1 nm om the cham ction signal w m temperatu btained from tion can be of 470 K, a c ed with the
ions used he
112, (220)comm
temperature
with the co‐e o Au49Cu51 co sponds to a c 111) and (11 ociated with m. mber and the was observe ure up to 470 m the differ observed: th clear decreas partial recov ere, the initi mon and (220)
re of the sub
evaporation omposition. composition 12) epitaxies h randomly e sample ed during 0 K under ent peak he lattice se of the vering of ial lattice 111 peaks bstrate is of 8.3 × The NPs n close to s and had oriented
evolutio (220)com at room significa this oxyg room te period, sample tempera observe of CO. the latti annealin of as pre exposed As compare on as a func
mon peak dur During the s m temperatu nt variation gen exposur emperature. which indica was then e ature increa d, showing t However du ce paramete ng up to 500 epared NPs. During step d to O2 duri d with samp ction of tim ring the diffe step 1, the sa re. A clear s of the relat re. After O2 No significa ates that th exposed dur sing from 3 that the stru uring step 4, er. This thre K, the lattice 5 the samp ng step 6. T ple 2, sample me of the la erent steps o
ample was ex shift of the l
ive intensity exposure, th nt evolution e structure ing step 3 t 00 K up to ucture forme annealing th shold is indi e parameter ple was coole The lattice p e 3 has thus attice param of gas exposu xposed to ap lattice param y between th he sample h n of the diffr formed dur to approxim 380 K, and ed during ox he sample at icated by the r of the NPs r ed down to parameter o a higher Au meter of ep ure and anne pproximately meter from 0 he different as been mai raction signa ring oxygen mately 10‐6 m no evolutio ygen exposu t 430 K unde e third verti reaches a va room tempe of the NPs i content. Th itaxial NPs ealing (Figure y 1 × 10‐6 mb 0.384 to 0.3 peaks could ntained in U al has been o exposure is mbar of CO on of the lat ure is also st er CO induce cal dashed l lue of 0.387 erature unde ncreases aga he figure 5 sh measured f e 5). bar O2 (purpl 392 nm is vi d be observe UHV during s observed du s stable in U (blue triang ttice parame table in the p es a slow dec ine in figure nm, close to er UHV and ain to highe
hows the from the e circles) sible. No ed during step 2 at uring this UHV. The gles), for eter was presence crease of e 5. After o the one then re‐ er values
showing that a reversible process is occurring between oxygen introduction and annealing.
Figure 5: Time of evolution of: a) lattice parameter of Au51‐Cu49 NPs measured from the position of
the (220)common peak, (b) O2 (blue) and CO (purple) pressures and (c), temperature.
IV) XPS results
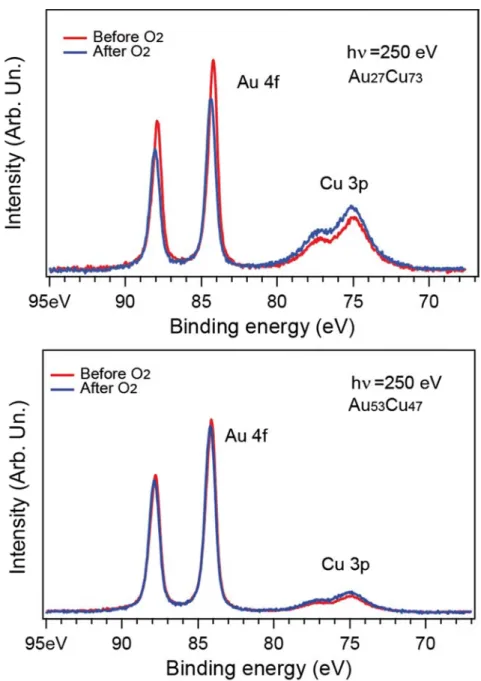
Two other samples have been prepared for XPS experiments with compositions of Au27Cu73
and Au53Cu47. The XPS spectra of Au 4f and Cu 3p core‐levels, recorded on these two samples for a
photon energy of 250 eV, are displayed in the figure 6. The top spectra corresponds to the Au27Cu73
sample, whose composition has been obtained from Rutherford Backscattering Spectroscopy (RBS) measurement after the removal of the sample from the XPS chamber. The Au 4f and Cu 3p intensities have been extracted by the deconvolution of each component using Voigt functions. Taking into account the cross section at 250 eV of photon energy44 and the mean free path of electrons in copper and gold,45 the quantitative analysis of Au 4f and Cu 3p leads to a composition of Au24Cu76, close to the one obtained using RBS. This validates the procedure used to determine the
atomic fraction of Cu and Au by XPS. The bottom spectra of the figure 6 have been recorded on a second sample, with Au53Cu47 composition, as given by the flux of evaporation. This composition is
Figure 6 at a pho W tempera samples and a sl observe substrat cannot chemica 6: Au 4f and oton energy o When the pa ature, a dec s. In the case
ight energy d, which is i te, the O 1s give informa al shift could
Cu 3p XPS sp of 250 eV bef
articles are rease of the e of the cop shift to high in the limits s core‐level
ation on the be seen on
pectra recor fore and afte
exposed to e 4f peak an pper rich nan her binding e of the ener (not shown e possible o the Auger C rded on the A er exposition up to 2 × nd an increa noparticles, energy of ab rgy resolutio here) is do oxidation of Cu LMM pea Au27Cu73 NP n to molecula × 10‐5 mbar ase of the C the change bout 50 meV on. Because t ominated by the NPs. W ks and on th (top) and Au ar oxygen. of molecul Cu 3p peak i in intensity of the gold the NPs are the substra Within the en he Cu2p pea u53Cu47 NPs lar oxygen is observed
is more pro and copper deposited o ate contribu nergy resolu ks. Further e (bottom) at room for both nounced r peaks is on a TiO2 tion and ution, no exposure
to a mix XPS spec Fig for as p tabulate related t clear se stronges from th observe phenom core, an Figure 7 (triangle V) Discu Fo higher v the pres show th intensity peak rel xture of CO+O ctra. gure 7 displa prepared NP ed values of to these val egregation f st variations
e near surfa d after O2 e menon where d a Cu‐rich s 7: Atomic frac e) and Au27Cu ussion a) Cu surfac or both NPs s values is obse sence of CO. hat samples y and a deca ated to cryst O2 or to pure ays the evolu Ps (blue) and the XPS cro ues, it is not for as‐prepa are observe ace region o exposure. Th e a demixing surface. ction of copp u73 (dot) befo e segregatio samples pres erved imme This indicate of close co ay of the Au talline coppe e CO (up to 2 ution of the d after O2 e oss‐sections t possible to red NPs. Af ed for low ph of the NPs.
us, both GIX of Au and C per vs photon ore (red) and on phenome sented in sec diately after es the forma omposition e 4f peak inte er (with a lat 2 × 10‐5 mba Cu fraction exposure (re and electro o relate the e fter oxidatio hoton energ
In this regio XD and XPS u occurs in t n energy, ob d after (blue) non and for ction III.b) an r the introdu ation of a Au exposed to ensity. In add ttice parame r) does not l as a functio ed). The valu
n mean free energy depe on, the Cu y, for which on, an increa results are i the NPs, lead btained from ) oxidation. mation of a nd c), a shift uction of mo u‐rich phase. O2 display dition, GIXD ter close to t ead to notic n of the inci ue has been e path. Due ndence of th
atomic frac the escapin ase of the C
n agreemen ding to the fo XPS measur copper oxid of the lattice lecular oxyge The photoe an increase results show the one of bu ceable chang dent photon n obtained f to the unce he values fo ction increa g electrons Cu atomic fr nt with a seg ormation of rements, for de shell e parameter en, indepen emission exp of the Cu w the absenc ulk Cu = 0.36 ges in the n energy, from the ertainties ound to a ses. The originate raction is gregation a Au‐rich Au53Cu47 r towards dently of eriments 3p peak ce of any 61 nm).
From XPS, we can exclude the formation of a large amount of a CuO oxide, which would have led to a chemical shift larger than 1 eV on the Cu 2p and Cu 3p peaks. The small chemical shifts observed with XPS may be associated with the formation of a shell of Cu2O or to chemisorbed
oxygen. However, the absence of significant shift on the Auger peak indicate that most Cu atoms remain in a metallic state. This high stability towards oxidation could be due to the low O2 partial
pressure used in the present experiments. It has been shown using Scanning Tunneling Microscopy (STM) that the morphology of Au‐Cu NPs of about 1 nm in size remains stable during the introduction of 10‐6 mbar of oxygen if they incorporate more than 20% of Au.46 The fact that the individual volume of the NPs remains the same means that the Cu does not diffuse away from the particles but forms a core‐shell structure with a Au‐rich core and a Cu2O shell too poorly crystallised
to scatter significant intensity.
Such a phenomenon was studied using XPS and density functional theory (DFT) for Au‐rich polycrystalline surfaces by Völker and co‐workers47 and for Cu3Au(111) by Tsuda and co‐workers.48, 49
In both cases the XPS/DFT interplay shows that the alloyed surfaces under UHV are slightly enriched in Au and that a clear inversion occurs during the introduction of oxygen with Cu diffusing to the outermost layers of the surface. More recently, Dhifallah and co‐workers have suggested using first‐ principles calculation that the Cu segregation may also depend on the surface orientation.50
b) Thermal stability of the core/shell structure
In each of the GIXD experiments presented in figure 4 and 5 the gas has been pumped down and the system maintained under UHV at room temperature to investigate a possible diffusion of the Cu atoms back into the Au enriched core of the NP. Indeed, it has been shown that Cu atoms deposited onto ≈ 2 nm Au NPs at room temperature diffuse into them to form an alloy.42 The fact that such diffusion could not be observed reinforce the interpretation made previously that the copper forms an oxide shell when exposed to oxygen. This shell is stable at room temperature, under UHV or when exposed to 10‐6 mbar of CO (see figure 5). This interpretation is in agreement with the conclusion of Sandoval and co‐workers18 regarding the formation of Cu oxide but in the present case, XPS demonstrate that the amorphous Cu oxide cannot be ‘sandwiched’ between the substrate and Au clusters. Moreover, in such a configuration, the epitaxial relationship between the NPs and the substrate would have been lost, which is not the case here.
The Cu oxide shell can be reduced by annealing the sample as shown in figure 4 and 5 at a temperature above 430 K. The decrease of the lattice parameter is therefore interpreted as Cu atoms being progressively released from the shell and forming a Au‐Cu alloy within the NP. As expected from this scenario, the re‐introduction of oxygen at room temperature after annealing
regenerates the Cu oxide shell through a segregation phenomenon as seen in figure 5 during the second introduction of oxygen.
c) Gas‐induced selective re‐orientation/crystallisation of the NPs
The disappearance of the ring feature upon introduction of a mix of CO + O2 implies a deep
and global reorganisation of individual NPs. The sample presented in section b) for which the re‐ orientation was observed, was synthesized under UHV on a substrate at 415 K to improve the diffusion of individual Au and Cu atoms and obtain larger NPs. Despite this procedure, the signal scattered by randomly oriented NPs was the majority. In other experiments, we observed that sample annealing up to 670 K in UHV does not change the intensity of the ring and does not improve the epitaxial relationships of the NPs (not shown here).
Two interpretations can be made to explain the total disappearance of randomly oriented NPs in the presence of the gas mixture. i), a NP to NP diffusion mechanism occurs where randomly oriented NPs, which may also be the smallest, sinter. Au and Cu atoms diffuse from these small NPs toward larger, epitaxial and more stable NPs, resulting in an increase of the corresponding diffracted intensity. ii) an intra‐atomic mobility triggers the NP re‐crystallisation, favouring a (111)NPs//(110)TiO2 epitaxy. The second hypothesis is more likely because a ripening mechanism cannot explain that a specific epitaxial relationship is favoured. The irreversibility of the disappearance of the ring feature, even after annealing, is in agreement with both previous interpretations. The disappearance of randomly oriented NPs is probably triggered by the fact that the chemical potential is higher for these NPs than for epitaxial ones. This could be due to a weaker interfacial bonding or to a smaller size (1.8 nm instead of 2.0 nm). On the one hand, the adhesion energy of a Au particle on TiO2(110) has been shown to depend on its geometry.51 On the other hand, from the surface energy of Au and Cu52, a difference in chemical potential of 0.05 eV/at is expected between 1.8 nm and 2.0 nm size Au50Cu50 particles. At this point, one has to determine whether the disappearance of randomly oriented NPs is induced by the mixture of gas or if such effect could be seen for pure oxygen exposure. The segregation mechanism has been shown to occur in the presence of oxygen only (see figure 5) and if, as stated above, the re‐orientation mechanism was a consequence of Au and Cu atoms segregating it would happen in these conditions as well. However, if this phenomenon has been observed under a CO+O2 mixture on the Au38Cu62 sample, it has not been measured on the Au49Cu51 sample under
pure O2. Nevertheless, in that case, a higher Au content may enhance the NP stability. We have
It is worth to note that the atomic mobility needed for the reorientation of the NPs is greater than the one required for Cu segregation to the surface, since it implies that all atoms, including those at the interface with the substrate, are involved. Au‐Cu/TiO2 NPs have also been
shown to catalyse the carbon monoxide oxidation at room temperature and above.18 Thus, considering that the reaction is exothermic (2.93 eV per CO2 molecules), one can suggest that the
energy released by the reaction, occurring here at room temperature, leads to an enhanced atomic mobility, and then to a gas‐induced selective re‐orientation of the NPs at the pressure at which this study has been performed.
VI) Conclusion
The combined use of GIXD and XPS allows us to comprehend the atomic diffusion and oxidation mechanisms at play in the case of 2 nm Au‐Cu NPs exposed to oxygen and carbon monoxide. When exposed to 10‐6 mbar of oxygen the Cu atoms, initially alloyed with Au, segregate to the surface of the NPs to form a Cu oxide shell stable in UHV at room temperature and reducible by annealing the sample over 430K. In the presence of a CO + O2 mixture, this segregation
phenomenon triggers a second phenomenon referred here as gas‐induced selective re‐orientation where randomly oriented NPs use the mobility induced by the segregation to re‐orient their Au‐rich core following the specific epitaxial relationship (111)NPs//(110)TiO2, [1‐10]NPs//[001]TiO2. It remains
unsure whether the presence of carbon monoxide is mandatory to trigger the re‐orientation mechanism. After reduction, the alloyed NPs keep their epitaxial relationship making this procedure an efficient way to selectively orient Au‐Cu NPs on a rutile TiO2(110) substrate.
Acknowledgements
Axel Wilson has received funding from the European Union’s Horizon 2020 research and innovation programme under the Marie Skłodowska‐Curie grant agreement (GA) No 665593 awarded to the Science and Technology Facilities Council. Experiments were performed on the SixS and TEMPO beamlines at SOLEIL Synchrotron, France and on the BM32 beamline at the ESRF, France. 1 M. Haruta, T. Kobayashi, H. Sano, and N. Yamada, Chemistry Letters, 1987, 405. 2 M. Haruta, N. Yamada, T. Kobayashi, and S. Iijima, J. Catal., 1989, 115, 301. 3 M. Haruta, Now & Future, 1992, 7, 13. 4 M. Kralik, A. Biffis, Journal of Molecular Catalysis A: Chemical, 2001, 177, 113‐138. 5
6 F. Raimondi, G. G. Scherer, R. Kötz, and A. Wokaun, Angew. Chem. Int. Ed., 2005, 44, 2190‐2209. 7 S. Cheong, J. D. Watt, R. D. Tilley, Nanoscale, 2010, 2, 2045‐2053. 8 P. Hervés, M. Pérez‐Lorenzo, L. M. Liz‐Marzán, J. Dzubiella, Y. Lu and M. Ballauff, Chem. Soc. Rev., 2012, 41, 5577‐5587. 9 A. Cao, R. Lu and G. Veser, Physical Chemistry Chemical Physics, 2010, 12, 13499‐13510. 10 H.‐L. Jiang, Q. X, Qiang, Journal of Materials Chemistry, 2011, 21, 13705‐13725. 11 A. K. Singh and Q. Xu, Chemcatchem, 2013, 5, 652‐676. 12 M. B. Gawande, A. Goswami, T. Asefa, H. Guo, A. V. Biradar, D.L Peng, R. Zboril and R. S. Varma, Chem. Soc. Rev., 2015, 44, 7540‐7590. 13 M. B. Gawande, A. Goswami, F. X. Felpin, T. Asefa, X. Huang, R. Silva, X. Zou, R. Zboril, and R. S. Varma, Chemical Reviews, 116, 2016, 3722‐3811. 14 J. C. Bauer, D. Mullins, M. J. Li, Z. L. Wu, E. A. Payzant, S. H. Overbury, and S. Dai, Physical Chemistry Chemical Physics, 2011, 13, 2571. 15 X. Y. Liu, A. Q. Wang, X. D. Wang, C. Y. Mou, and T. Zhang, Chemical Communications, 2008, 0, 3187 ‐ 3189. 16 J. C. Bauer, D. Mullins, M. J. Li, Z. L. Wu, E. A. Payzant,S. H. Overbury and S. Dai, Phys. Chem. Chem. Phys., 2011, 13, 2571–2581. 17 X. Y. Liu, A. Q. Wang, T. Zhang, D. S. Su, and C. Y. Mou, Catalysis Today, 2011, 160, 103. 18 A. Sandoval, C. Louis, and R. Zanella, Applied Catalysis B‐Environmental, 2013, 140, 363. 19 X. Li, S. S. S. Fang, J. Teo, Y. L. Foo, A. Borgna, M. Lin, and Z. Y. Zhong, Acs Catalysis, 2012, 2, 360. 20 D.I. Potemkin, E.Yu. Semitut, Yu.V. Shubin, P.E. Plyusnin, E.V. Makotchenko, D.Yu. Osadchii, D.A. Svintsitskiy, S.A. Venyaminov, S.V. Korenev and V.A. Sobyanin, Catalysis Today, 2014, 235, 103. 21 R. Fiorenza, C. Crisafulli, G. G. Condorelli, F. Lupo, and S. Scire, Catalysis Letters, 2015, 145, 1691. 22 T. S. Mozer, D. A. Dziuba, C. T. P. Vieira, and F. B. Passos, Journal of Power Sources, 2009, 187, 209. 23 X. Liao, W. Chu, X. Dai and V. Pitchon, Applied Catalysis B: Environmental, 2013, 142‐143, 25‐37. 24 X. M. Liao, V. Caps, W. Chuc and V. Pitchon, RSC Adv., 2016, 6, 4899. 25 J. Llorca, M. Dominguez, C. Ledesma, R. J. Chimentao, F. Medina, J. Sueiras, I. Angurell, M. Seco and O. Rossell, J. Catal., 2008, 258, 187–198. 26 R. J. Chimentao, F. Medina, J. L. G. Fierro, J. Llorca, J. E. Sueiras, Y. Cesteros, and P. Salagre, Journal of Molecular Catalysis a‐Chemical, 2007, 274, 159. 27 J. W. Lee, X. Y. Liu and C. Y. Mou, J. Chin. Chem. Soc., 2013, 60, 907–914. 28 L. Delannoy, G. Thrimurthulu, P. S. Reddy, C. Méthivier, J. Nelayah, B. M. Reddy, C. Ricolleaud and C. Louis, Phys. Chem. Chem. Phys., 2014, 16, 26514‐26527 29 X.‐M. Liao, V. Pitchon, P.‐H. Cuong, W. Chu, V. Caps, Chinese Chemical Letters, 2017, 28, 293‐296. 30 Z. C. Xu, E. C. Lai, Y. Shao‐Horn, and K. Hamad‐Schifferli, Chemical Communications, 2012, 48, 5626. 31 S. Neatu, J. A. Macia‐Agullo, P. Concepcion, and H. Garcia, Journal of the American Chemical Society, 2014, 136, 15969. 32 D. Kim, J. Resasco, Y. Yu, A. M. Asiri, and P. D. Yang, Nature Communications, 2014, 5, 4948. 33 N. K. Gamboa‐Rosales, J. L. Ayastuy, M. P. Gonzalez‐Marcos, and M. A. Gutierrez‐Ortiz, International Journal of Hydrogen Energy, 2012, 37, 7005. 34 Z. B. Hai et al., Journal of Materials Chemistry A, 2013, 1, 10829. 35 D. M. Alonso, S. G. Wettstein, J. A. Dumesic, Chem. Soc. Rev., 2012, 41, 8075‐8098 36 J. D. L. Fonseca, H. S. Ferreira, N. Bion, L. Pirault‐Roy, M. D. Rangel, D. Duprez, and F. Epron, Catalysis Today, 2012, 180, 34. 37 J. C. Bauer, T. J. Toops, Y. Oyola, J. E. Parks, S. Dai, and S. H. Overbury, Catalysis Today, 2014, 231, 15. 38 A. L. Patterson, Physical Review, 1939, 56, 978. 39 R. Lazzari, G. Renaud, J. Jupille, and F. Leroy, Physical Review B, 2007, 76, 125412. 40 L. Zhang, R. Persaud, and T. E. Madey, Physical Review B, 1997, 56, 10549. 41 F. Cosandey, L. Zhang, and T. E. Madey, Surface Science, 2001, 474, 1. 42 A. Wilson, R. Bernard, A. Vlad, Y. Borensztein, A. Coati, B. Croset, Y. Garreau, and G. Prevot, Physical Review B, 2014, 90, 075416. 43 M.‐C. Saint‐Lager, I. Laoufi, A. Bailly, Faraday Discuss., 2013, 162, 179‐190 44 J. J. Yeh and I. Lindau, Atomic Data and Nuclear Data Tables, 1985, 32, 1. 45 C. J. Powell and A. Jablonski, NIST Electron Inelastic‐Mean‐Free‐Path Database ‐ Version 1.2, National Institute of Standards and Technology, Gaithersburg, 2010. 46 A. Wilson, R. Bernard, Y. Borensztein, B. Croset, H. Cruguel, A. Vlad, A. Coati, Y. Garreau, and G. Prevot, Journal of Physical Chemistry Letters, 2015, 6, 2050.
47 E. Volker, F. J. Williams, E. J. Calvo, T. Jacob, and D. J. Schiffrin, Physical Chemistry Chemical Physics, 2012, 14, 7448. 48 Y. Tsuda, K. Oka, T. Makino, M. Okada, W. A. Dino, M. Hashinokuchi, A. Yoshigoe, Y. Teraoka, and H. Kasai, Physical Chemistry Chemical Physics, 2014, 16, 3815. 49 K. Oka, Y. Tsuda, T. Makino, M. Okada, M. Hashinokuchi, A. Yoshigoe, Y. Teraoka, and H. Kasai, Physical Chemistry Chemical Physics, 2014, 16, 19702. 50 M. Dhifallah, A. Dhouib, S. Aldulaijan, F. D. I. Renzo, and H. Guesmi, Journal of Chemical Physics, 2016, 145, 024701. 51 S. Tosoni and G. Pacchioni, J. Phys. Chem. C, 2017, 121, 28328. 52 L. Vitos, A.V. Ruban, H.L. Skriver, J. Kollár, Surf. Sci., 1998, 411, 186