HAL Id: insu-02985650
https://hal-insu.archives-ouvertes.fr/insu-02985650
Submitted on 2 Nov 2020
HAL is a multi-disciplinary open access
archive for the deposit and dissemination of
sci-entific research documents, whether they are
pub-lished or not. The documents may come from
teaching and research institutions in France or
abroad, or from public or private research centers.
L’archive ouverte pluridisciplinaire HAL, est
destinée au dépôt et à la diffusion de documents
scientifiques de niveau recherche, publiés ou non,
émanant des établissements d’enseignement et de
recherche français ou étrangers, des laboratoires
publics ou privés.
The inner dust coma of Comet 26P/Grigg-Skjellerup:
multiple jets and nucleus fragments?
Neil Mcbride, Simon F. Green, Anny Chantal Levasseur-Regourd, Blandine
Goidet-Devel, Jean-Baptiste Renard
To cite this version:
Neil Mcbride, Simon F. Green, Anny Chantal Levasseur-Regourd, Blandine Goidet-Devel,
Jean-Baptiste Renard. The inner dust coma of Comet 26P/Grigg-Skjellerup: multiple jets and nucleus
fragments?. Monthly Notices of the Royal Astronomical Society, Oxford University Press (OUP):
Policy P - Oxford Open Option A, 1997, 289 (3), pp.535-553. �10.1093/mnras/289.3.535�.
�insu-02985650�
1997MNRAS.289..535M
Mon. Not. R. Astron. Soc. 289,535-553 (1997)
The inner dust coma of Comet 26P/Grigg-Skjellerup: multiple jets and
nucleus fragments?
Neil McBride,
1
Simon
F.
Green,
l
A. Chantal Levasseur-Regourd,2 Blandine Goidet-Deve1
3
and Jean-Baptiste Renard
41 Unit for Space Sciences and Astrophysics, Physics Laboratory, University of Kent, Canterbury
cn
7NR2 Universite Paris 6, Service d'Aeronomie CNRS, BP 3,91371 Verrieres, France
3 Observatoire de Besan{:on, 41 avenue de l'observatoire, BP 1615, 25010 Besan{:on Cedex, France
4 LPCE-CNRS, 3A avenue recherche scientijique, 45701 Orleans Cedex 2, France
Accepted 1997 March 5. Received 1997 March 5; in original form 1996 July 8
1 INTRODUCTION
ABSTRACT
On 1992 July 10 the European Space Agency's spaceprobe
Giotto passed the nucleus of the
comparatively inactive comet 26P/Grigg-Skjellerup at a relative velocity of 14 km
S-I.This
Giotto Extended Mission (GEM) followed a highly successful encounter in 1986 with Comet
1PlHalley. We present results returned from the Optical Probe Experiment (OPE) and in
particular consider data gathered by the channels sensitive to the scattering of solar light by
cometary dust grains, in emission-free continuum bands. Owing to the demise of the Halley
Multicolour Camera (HMC) during the Halley encounter, and the low number of impacts
registered by the Dust Impact Detection System (DIDSY), OPE data offer the best indication
of the actual encounter geometry. We find that it is likely that
Giotto was on the sunward side of
the shadow tenmnator plane at closest approach, with our modelling results suggesting that
Giotto passed -100 km from the nucleus (although distances of up to 300 km cannot be ruled
out). We investigate possible causes of the striking 'spike' features, or 'events', in the OPE
data. While scattering of sunlight from ejecta particles as a result of dust impacts on the
spacecraft body cannot be ruled out, considerations of the hypervelocity impact mechanisms
and impact geometry show that this explanation is not without problems, and more
investiga-tion is needed before it can be conclusively accepted. As an alternative soluinvestiga-tion, we find that
the complex data profiles can be fitted by jet activity in the innennost coma (which was not
resolvable by ground-based observers). One particular event occurring at least 1000 km from
the nucleus can be fitted if the OPE line of sight passes close to a nucleus fragment of radius
10-100 m which is situated around 50 km from the spacecraft and which is producing a small
dust coma.
Key words: instrumentation: detectors instrumentation: miscellaneous space vehicles
-comets: general - -comets: individual: 26P/Grigg-Skjellerup.
Mission (GEM) promised a very different encounter from that of Comet Hall~y.
On 1986 March 13 the European Space Agency's spaceprobe Giotto passed within about 600 km of the nucleus of the highly active comet 1PIHalley at a relative velocity of 68 km S-I. This hazardous encounter did not leave the probe unscathed, although the condition of the spacecraft and on-board experiments was such that a second flyby of a cometary nucleus could be undertaken. On 1992 July 10 Giotto passed through the innermost coma of the comet 26P/Grigg-Skjellerup. This comet had an observed gas production rate that was 2 orders of magnitude less than Halley, which, partnered with the lower encounter velocity of 14 km S-1
(and different encounter geometry), meant that the Giotto Extended
The spacecraft was targeted directly at the nucleus, but, owing to the uncertainties in the position of the nucleus, the actual flyby distance and geometry of the nucleus were unknown prior to encounter. The demise of the Halley Multicolour Camera (HMC) during the 1986 encounter meant the Optical Probe Experiment (OPE) was the only optical sensor active for the Grigg-Skjellerup encounter, and, without direct imaging of the nucleus, OPE would offer the best estimate of the closest approach distance of the nucleus. Although the geometry of the encounter did not permit a local inversion of the data, subsequent analysis has indicated that the dust coma was entered at a distance of at least 20 000 km from
© 1997 RAS
1997MNRAS.289..535M
536
N.
McBride et al.
the nucleus (Levasseur-Regourd et al. 1993a). The reduced relative velocity (compared with the Halley encounter) has allowed an excellent spatial resolution (14 kIn parallel to the trajectory) to be obtained as the line of sight of the OPE telescope passes through the inner coma. This has enabled the detection of some unexpected and striking inner coma features.
In this paper, we present the results obtained by OPE at the Grigg-Skjellerup encounter from the dust continuum channels, with particular reference to possible explanations for the unusual features in the data.
2
GRIGG-SKJELLERUP FLYBY GEOMETRY
The OPE had been proposed and selected for the Giotto spacecraft mission to Comet IPlHalley to provide the first in situ measure-ments of brightness and polarization from within a cometary coma (Levasseur-Regourd et al. 1984). The operation of the experiment relied on the fact that if the line of sight of the optical telescope was parallel to the spacecraft trajectory and if the coma is optically thin then the difference between two consecutive measurements is directly proportional to the light scattered by dust or emitted by gases inside a small volume element centred on the moving probe (Levasseur-Regourd et al. 1981). The geometry of the Halley encounter meant that the phase angle of the OPE observations (the Sun-scattering particle-OPE angle) would be equal to either 107?2 (for forward viewing with respect to the probe's motion) or 72?8 (for rearward viewing). Since typical phase curves are rather flat in the 700 to 1100 domain, almost no additional information
would have been obtained from measurements performed in both directions. A rearward-looking instrument was chosen, to avoid the inevitable damage that would occur as a result of dust impacts on a forward-looking instrument.
The Giotto encounter with Comet Grigg-Skjellerup differed from that with Halley in two major respects. Since Grigg-Skjel-lerup has a prograde orbit (unlike Halley), the relative velocity at encounter was about five times lower, with the comet overtaking the spacecraft, approaching from south of the ecliptic. In addition, the spacecraft's spin axis (which was parallel to the OPE line-of-sight axis) was not aligned with the relative velocity vector as it had been at Halley, but was oriented at an angle of 68?8. This was because of the requirements for pointing the communication high-gain antenna towards the Earth and the fact that the spacecraft's cylindrical solar array had to be perpendicular to the Sun direction to maximize available power. Such a geometry produced a phase angle for dust particles observed by OPE of 90?4 (see Fig. 1). The observed polarization is at a maximum when the phase angle is around 900
(Levasseur-Regourd 1992) and so the Grigg-Skjellerup encounter offered a favourable geometry for retrieving the polarization data with maximum signal-to-noise ratio. The heliocentric and geocentric distances of the comet were 1.01 and 1.43 au respectively (compared to 0.90 and 0.96 au respectively at the Halley flyby, with a phase angle of 72? 8).
In order to interpret the OPE data it is essential to understand the geometry of the Grigg-Skjellerup encounter, and this is shown in Fig. 1. An orthogonal frame is shown centred on the nucleus such that the x-axis points to the Sun. The
y-axis
is such that thex-y
plane is parallel to Giotto's trajectory vector, which makes an angle of 1O? 6 with the z-y terminator plane. The relative position of the trajectory vector is defined here such that the vector passes through the
x-z
plane at a point defined byXo
andzo,
this giving rise to a closest approach distance to the nucleus ofao.
Although the relative orientation of the trajectory vector is well known, the absolutez
Trajectory-...
..
~...
nucleus~
x
Sun in x directionif!';
Giotto:~.-
...
y
Figure 1. Geometry of the Giotto Extended Mission flyby with Comet 26P/ Grigg-Skjellerup. The orthogonal coordinate system, centred on the nucleus, has the x-axis pointing towards the Sun, with the x-y plane parallel to the spacecraft's relative velocity vector. Giotto's spin axis was almost parallel to the y-z plane and at an angle of 68?8 to the velocity vector. The solar phase angle of dust particles in the OPE line of sight was therefore 90?4. The location of the nucleus relative to the trajectory is defined by the parameters Xc and Zo which may have been positive or negative. ao indicates
the closest approach distance of the spacecraft to the nucleus.
position is not determined, i.e. the values of Xo and Zo are unknown. This is due of course to the absolute position in space of the cometary nucleus being unknown (as opposed to uncertainty in Giotto's trajectory). However, to aid visualization (and for the purposes of the modelling presented later), it is easier to maintain our reference frame on the nucleus and try to determine likely values of Xo and Zo. The OPE telescope was situated near the outer edge of the 'rear' of Giotto, and the line of sight was parallel to the spacecraft's spin axis (where the spin axis was almost parallel to the z-y terminator plane). Note that the phase angle of90?4 for sunlight being scattered from a dust particle in the OPE line of sight is maintained throughout the near-nucleus encounter.
It is clear from the geometry shown in Fig. 1 that the location of the path of Giotto with respect to the nucleus would make a crucial difference to the gathered experimental data. With positive values of Zo and near-zero values of
xo,
then the nucleus could appear in the OPE line of sight. Alternatively, if Zo were significantly negative, then OPE would never sample the near-nucleus region ..At the Halley flyby the targeting of the spacecraft was aided by the 'pathfinder concept', using imaging from the VEGA missions several days before to reduce the uncertainties in the nucleus position. Subsequent determination of the flyby distance was performed using HMC imaging. Neither technique was possible at the Grigg-Skjellerup flyby since it was the only spacecraft and the HMC was inoperable. The estimated targeting uncertainty pre-encounter was around 200 kIn (1 sigma; T. A. Morley, personal communication), the targeting being at the nominal nucleus position.
Three large impacts were detected by DIDSY, indicating that the mass loss is dominated by large particles as at Halley (McDonnell et al. 1993). This low detected fluence, owing to the combination of low cometary activity, low flyby velocity and the tilt of the Giotto
1997MNRAS.289..535M
The inner coma of Comet 26PIGrigg-Skjellerup
537
Table 1. The OPE filters.
Filter Ao FWHM (run) (nm) OH 310 6.0 ICN 390 4.0 IC2 515 4.0 2CO+ 425 4.0 'Blue' Dust 442 4.5 'Green' Dust 577 10.0 3 'Red' Dust 717 3.5
Notes: ICN and C2 channels multi-plexed. 2CO+ channel did not have polaroid foils. 3No useful data owing to a loss in sensitivity after Halley encounter.
bumper shield to the relative velocity, places only poor constraints on the nucleus miss distance (approximately 50 to 1000 km depending on the nucleus model parameters). However, since OPE was sensitive to all scattering particles along a line of sight passing right through the coma, the shape of the brightness profile provided the possibility of a reasonable determination of the miss distance.
3 OPE
3.1 The instrument
To constrain models describing the physical properties of the dust, OPE was chosen to measure the brightness at various wavelengths and states of polarization. To guarantee its reliability, the polari-meter was designed with no moving parts. Imaging was performed through a mosaic of interference filters (which were arranged in such a way so as to compensate for chromatic effects) placed in front of the objective lens of the refracting telescope. By imaging on to a microchannel plate, spectral discrimination could be achieved. A polaroid foil, placed on all filters but one, allowed the polarization to be determined as the analyser turned along with the spinning spacecraft. The resulting instrument was light (1.3 kg) with an undemanding power consumption (1.1 W) as required on an interplanetary space vehicle (Levasseur-Regourd et al. 1986a).
OPE was located on the rearward-facing platform of the space-craft (relative to the motion of the probe at the Halley encounter). A single stage cylindrical baffle was designed to minimize light scattered from the rear of the antenna and tripod. A baffle cover holding a tritium-phosphor calibration source (later released by firing a pyrotechnic device) avoided contamination of the optics during launch and allowed the sensitivity of the instrument to be checked prior to launch and in space before the Halley encounter. The objective lens was used to image the light from the comet on to a field stop, providing a 2~62 field of view. The mosaic was imaged on to the photocathode of the microchannel plate photomultiplier by a field lens behind the field stop. Photoelectrons generated at the photocathode were amplified and focused to an anode segment corresponding to a single filter and thus a distinct channel (Giovane et al. 1991).
The polarized components of the light were measured in seven bandpasses or channels, ranging from the ultraviolet to the near-infrared. Three channels, the so-called blue, green and red channels, were devoted to the observation of the scattering of solar light by cometary dust grains, in emission-free continuum bands (see Table 1).
© 1997 RAS, MNRAS 289, 535-553 Before and after encounter Closest approach and event 3
<J
<J
Clock sectors used to retrieve the intensity and polarisation
Clock sectors not used
Figure 2. OPE clock sectors used during the encounter. Eight sectors were sampled during one spacecraft revolution (lasting 4 s). Sectors 0, 1 and 2, however, were contaminated with stray light (thought to be from the antenna dish) and so were not used, except when the signal levels were high enough such that the contamination did not dominate (i.e. near closest approach and event 3). Polarization pairs were calculated from sectors (0,2), (1,3), (2,4), etc.
Four other channels, the so-called OH, CN, C2, and CO+ channels (with no polaroid foil in front of the CO+ filter), were devoted to the observation of light emitted by cometary gases. During a spacecraft spin period (of -4 s), eight consecutive measurements of the polarized brightness, 2 j, 2 j+1, 2 j+2 etc. (each of them integrated over a 45° rotation of approximately -0.5 s), were performed in eight clock sectors, simultaneously for the seven channels. Fig. 2 illustrates the clock sectors.
3.2 Data reduction procedure
The polarized light intensity can be retrieved from the measured signals, by removing the average dark count (smaller than 5 counts per half second interval in the blue and the green channels), then removing the astronomical background and finally applying the absolute calibration factor. These contributions were estimated for all the clock sectors of each channel and did not significantly change from before to after encounter. The appropriate values for each filter were subtracted from all the data.
The total intensity
Ztot
was obtained by adding two perpendicu-larly polarized components i.e.Ztot
=
2j+
2j+2 , (1)where 2j is the polarized intensity on clock sector i (see Fig. 2). The polarization P is obtained by
P
=
2y'(2j - 2i+2)2 + (2j+1 - 2 j+3)2(2j
+
2 j+2)+
(2i+1 + 2 j+3 )(2) The polarization measurement uses intensities taken from four consecutive clock sectors, these data being gathered over half a spacecraft spin period i.e. 2 s. It should be noted, however, that during this period some variation in intensity may occur owing to the changing field of view as Giotto travels through the coma as well as the changing polarization itself. To minimize this potential source of error the data from the CO+ channel, which is unpolarized and dominated by dust scattering in the inner coma, is used to normalize the intensity changes for each rotation before the polarization is calculated.
As the rotation of the spacecraft (which defines the sector positions) is continuous, the polarized intensity for each sector
1997MNRAS.289..535M
538
N.
McBride et al.
Table 2. Background intensity components of tbe OPE blue, green and red channels. Because of tbe higher sensitivity of tbe green channel, counts obtained in tbe blue channel are a factor 0.46 tbat of tbe green channeL The red channel suffered a drastic loss of sensitivity during tbe Halley encounter.
Channel Blue Green Red Background signal (counts, DC removed)
position is a sum over a 45° sector rather than measured at a single position as would occur in conventional polarimeters. The max-imum underestimation of the true polarization would occur when the polarization vector is aligned exactly with one of the sectors. However, even in this case the measured value would be 0.975 times the true value.
During the flyby, all the housekeeping data (high voltage, low voltage, temperature) remained nominal. A few telemetry losses took place during the flyby, and a few suspect data points, probably arising from telemetry faults, were removed. Near closest approach,
-10000 -5000 0 5
(a)
4 CIl....
1:1 3 ;:::I 0 U 00 0 ....:I 2 """ 30 ~ ' - ' 1:1 0 20 .~ CIl .~ 10"0
0... Response (10-7 W m-2 sr-I fLm-1 ce l ) 2.6±1.3 1.2±0.6 -24 Pre-launch estimate 2.09 0.88 4.40data corresponding to one spin period were lost, most likely because of instrumental effects on the spacecraft radio system, immediately before a slight nutation was noticed and dust impacts were recorded (Patzold et al. 1993; McDonnell et al. 1993).
OPE had remained operational after the Halley flyby, as demon-strated during the 1990 April and 1992 June tests. However, a stray light contamination, which was almost certainly due to solar light scattered from the despun antenna during part of the Giotto rotation and which reached 300 counts per half second interval for the blue channel, was seen on clock sectors 0, 1 and 2 (Fig. 2). The intensity
5000 10000 15000
1.8
-10000 -5000
o
5000 10000 15000Distance along trajectory
(km)Figure 3. (a) Upper panel: OPE data in tbe green (577-nm) channel (-10 000 km to + 15000 km is shown). Counts per second are shown calculated for tbe polarized sector pairs (see text). Middle panel: polarization. Lower panel: ratio of green- to blue- (442-nm) channel data. (b) As in (a) but for -750 km to
+1750km.
1997MNRAS.289..535M
The inner coma of Comet 26PIGrigg-Skjellerup
539
-750 -500 -250
o
250 500 750 1000 1250 1500 1750 5(b)
Main peak 4 <Il....
=
;:::l 0 Eventl U OJ) 3 0 ....:l 2 0~~~++~~~~~~~~-r~~~~~++~~+1~~~~~~++~~ 2.4 II).E
~ 2.2 II) ~----r---~--__
~ 2.0o
1.8 -750 -500 -250o
250 500 750 1000 1250 1500 1750Distance
along trajectory
(km) Figure 3 - continued was therefore computed only three times per rotation of thespace-craft, spaced at 0.5-s intervals, from the combination of the polarized brightness in clock sectors (3,5), (4,6) and (5,7). The polarization was retrieved once per rotation, from the combination of polarized brightness in clock sectors 4, 5, 6 and the mean of sectors 3 and 7. During closest approach, however, all the clock sectors could be used because of the high level of the signals, so obtaining more continuous intensity and polarization data sets.
3.3 Sensitivity and calibration at the Grigg-Skjellerup encounter
As a result of the absence of the on-board calibration lamp after the baffle was fired prior to the Halley encounter, the sensitivity had to be checked through observations of the astronomical background in the field of view of the instrument. This background is built up of three components: (1) the zodiacal light from solar light scattered by interplanetary dust which (along with planetary light) produces the Solar system component; (2) stellar light scattered by interstellar dust which (along with the light from stars) produces the diffuse Galactic component; (3) the very faint extragalactic component.
Prior to the Grigg-SkjeUerup flyby, an OPE calibration test was
© 1997 RAS, MNRAS 289, 535-553
performed. The Giotto spin axis was such that the OPE line of sight was pointing to a field in Sagittarius with right ascension 19h21m
and declination -22°06' (Morley 1991). The helioecliptic coordi-nates were (:A -~) - 90°,
/3 -
0°, i.e. the observations were made in the vicinity of the ecliptic plane, at 90° from the Sun. The Galactic coordinates were I= 16°,
b= -17°, i.e. the observations
were reasonably close to the Galactic plane. From the determination of the zodiacal light component (see the table published in Levas-seur-Regourd & Dumont 1980), the estimation of integrated star-light (Roach & Gordon 1973) and the general trend of the diffuse Galactic and extragalactic components (Toller 1990), the total background is computed to be equal to 530 ± 70 SlO(V) (a unit of SlO(V) being the equivalent number of tenth visual magnitude solar-type stars per deli). This corresponds to 6.7 ± 0.9 x 10⁻⁶ W m-2
sr-I /-Lm -I for the blue and the green channels and 4.8 ± 0.7 x 10⁻⁶
W m-2 sr-I /-Lm-I for the red channel.
The background brightness detected prior to and after the Grigg-SkjeUerup flyby, produced from the combination of two clock sectors free of stray light contamination, is given in Table 2, together with the resulting sensitivity. The ratio of the signals from the blue and the green channels is -0.46. This value is consistent with the estimated pre-launch sensitivities (Giovane et al. 1991), indicating
1997MNRAS.289..535M
540
N.
McBride et al.
Table 3. The OPE data for the green (577-nm) channel. d equals distance along the trajectory from the nominal assumed peak (at 15:30:45 GRT). Counts are
number s -1. The blue-channel data follow the same general form. (For example in the d = ::': 1000 km region, the blue counts are a factor ~0.47Iower than those for the green.)
d(km) -19754 -17433 -15566 -13643 -11323 -9408 -8003 -7078 -6153 -5210 -3993 -3002 -2109 -1438 -1130 -963 -795 -789 -746 -740 -733 -691 -683 -677 -635 -627 -621 -578 -572 -565 -558 -551 -544 -530 -523 -516 -509 -502 -468 -460 -454 -412 Counts 3 3 5 7 8 10 10 13 16 21 26 33 43 51 54 64 55 55 47 55 70 80 65 63 71 65 83 69 89 108 722 1030 1202 534 276 280 135 117 98 95 d (km) -404 -398 -355 -349 -341 -300 -293 -286 -244 -237 -230 -188 -181 -175 -132 -126 -118 -76 -70 -62 36 43 50 57 64 71 78 85 92 99 106 127 134 141 148 155 162 169 176 183 190 197 Counts 95 96 91 113 79 88 132 113 145 119 145 145 162 127 210 219 341 353 304 358 64757 40828 35349 29990 30608 24316 21947 17430 16472 11983 11336 16002 11191 9849 8727 7596 7453 7501 7011 6076 4890 4024 d(km) 204 211 218 225 232 253 260 267 274 281 288 295 302 309 315 322 329 336 343 350 357 364 371 378 385 392 399 406 413 427 433 439 482 489 497 537 545 552 593 601 607 650
little relative change in the behaviour of the green and the blue channels. The red channel, however, suffered a drastic loss of sensitivity during the Halley encounter. We present here, therefore, only results for the blue and the green dust continuum channels.
4 GRIGG-SKJELLERUP FLYBY DATA
Data from the blue and the green channels follow almost identical trends and for subsequent modelling we have simply used the green (577-nm) channel as this receives more counts (owing to the higher sensitivity as discussed above). All data are given as a function of distance, d, along the Giotto trajectory with zero denoted by the estimated time of the maximum intensity, which we take to be 15:13:45 Ground Received Time (GRT). The green intensity data are plotted in Fig. 3(a), for the range d
=
-10 000 to + 15000 km, together with the polarization and the colour ratio greenlblue. TheCounts 3617 3393 3276 3469 3246 22168 9585 3472 3203 2920 2830 2712 2682 2387 2298 1994 1977 1698 1665 1675 1524 1598 1307 1261 1147 1072 1052 1029 1003 889 924 832 612 703 578 491 545 505 391 459 377 351 d(km) 656 663 706 712 719 759 764 776 817 825 831 873 879 886 936 941 947 986 993 999 1040 1047 1054 1068 1075 1089 1096 1103 1110 1117 1124 1131 1138 1145 1152 1173 1180 1187 1194 1207 1215 1221 Counts 366 312 269 296 249 268 280 242 251 212 223 199 200 177 169 152 147 150 171 128 135 138 139 123 2255 10883 22669 12129 6575 5850 3686 2086 1944 1402 1453 1765 966 872 720 711 768 603 d(km) 1264 1271 1277 1320 1327 1334 1375 1382 1389 1431 1438 1446 1488 1494 1501 1543 1578 1690 1802 1914 2024 2164 2331 2527 2750 2974 3309 3755 4450 5374 6299 7242 8629 10731 14148 18762 23488 29298 37003 48780 62905 76974 Counts 310 414 301 279 222 274 191 221 189 116 249 124 128 140 99 108 103 82 81 67 55 43 39 36 36 32 23 22 18 16 14 12 10 9 6 6 4 3 3 1
actual data values are tabulated in Table 3 for the range approxi-mately d
=
-20000 to +77000 km. Where possible:'individual intensity (Zrot) values are given (generally where-the signal is highest; in the innermost coma) although values are averaged (to increase the signal-to-noise ratio) where count rates were low (generally whenIdl
> 1000 km) using between 1 and 200 rotations depending on the signal. The brightness is given as an instrumental count, as the calibration discussed above is tentative.Fig. 3(b) shows the data for the innermost coma from d
=
-750 km to + 1750 km. We have labelled the main peak and three main 'events'. Note the data dropout near the O-km region. It is likely that the peak OPE brightness occurred in this dropout region, and it is here that we have chosen the d= 0 position, at 15: 13:45 GRT. This
choice is of course arbitrary. The true closest approach time is likely to be somewhat different from this, and in fact the peak signal might be due to another 'event' with the peak in brightness resulting from1997MNRAS.289..535M
The inner coma of Comet 26P/Grigg-Skjellerup
541
5
(a)
Xo = 20 kIn Zo = 150 kIn
Xo=
OkInzo=
5kIn
Xo= 20kInzo =800kIn
Xo = 800 kIn Zo = 20 kIn
OL-~~--~~--~~--~~--~-L--~~~--~~--~~--~~~
-10000
-5000
0
5000
10000
Distance along trajectory
(lan)
5
(b)
4
en...
s::
=
3
0 U b.{)5 2
1
0
-10000
o 0-5000
0
Xo = 20 kIn Zo = 150 kIn
Xo=
OkInzo=
5kIn
Xo = 20 kIn Zo = 800 kIn
Xo = 800 kIn Zo = 20 kIn
5000
10000
Distance along trajectory
(lan)
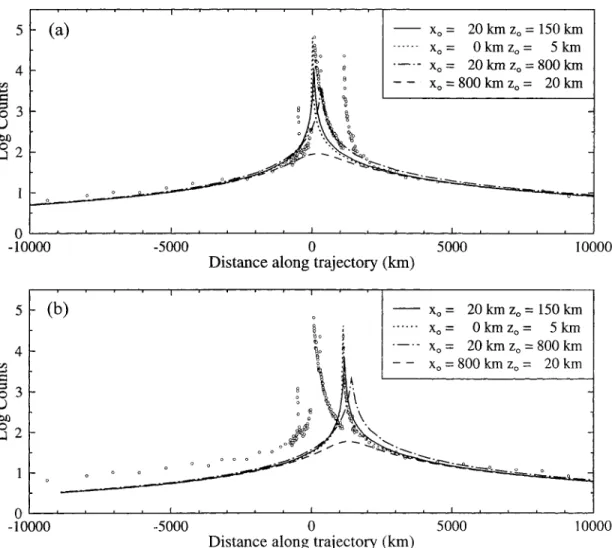
Figure 4. Overall coma dust models compared with data. (a) Fits assuming the coma dust spatial density obeys a simple r -2 law (r being cometocentric distance). (b) Fits assuming event 3 is a 'main peak' .
the cometary coma occurring later. This however does not affect the subsequent modelling in this paper as the exact relative position of the nucleus is a free parameter.
First inspection of the inner coma data (Fig. 3b) reveals that the data are significantly asymmetric around the closest approach point. Post-encounter shows a pronounced brightening compared to pre-closest approach. For pre-pre-closest approach, the form of the data approximates to a d-1 power law (i.e. counts proportional to d-1)
for at least -10000 km to -1000 km. This d-1 relation is also seen
post-encounter at distances greater than about +3000 km, although for d
<
+3000 km (post-closest approach) the form of the data follows more closely to a d-1.7 relationship (as was noted in Levasseur-Regourd et al. 1993a). Note that this refers only to the general trend of the data, and one should be careful when making immediate conclusions as to the variation of spatial dust density in the cometary coma. If considering the integrated brightness con-tribution from a cylindrical volume around a line of sight viewed through the entire coma, a d-1 relationship would be indicative of ar-2 (spherically symmetric) dust spatial density relationship (where
r is the distance from the nucleus). However, as Giotto was passing through the coma (and not necessarily directly bisecting a spheri-cally symmetric cloud), the brightness contribution in the OPE conic field of view cannot be taken to be a simple cylindrical contribution, and thus the peak intensity may not correspond to the closest approach point. For example, for an encounter geometry
© 1997 RAS, MNRAS 289,535-553
such that Xo
=
0 km and Zo=
200 km (i.e. ao is also 200 km), a passage through a spherically symmetric coma would yield the peak intensity at ~5 s after the closest approach point.Although the asymmetry in the data is clearly significant perhaps the most striking features are the 'spikes', which we have labelled as events 1,2 and 3 in Fig. 3(b). The approximate d-1.7 relationship that the data show in the d
<
3000 km post-closest approach region does not necessarily indicate a departure from a r -2 dust spatialdensity as the presence of these spike events shows that some activity or artefacts may be superimposed on a background r-2
coma. An in-depth discussion of possible explanations for the data profile is given in the following sections.
The polarization data are also shown in Fig. 3. The solar light scattered by cometary dust is linearly polarized. The degree of polarization depends upon the phase angle between the Sun and the observer as seen from the scattering dust particle, and the location within the coma. When considering whole-coma observations (see Levasseur-Regourd, Hadamcik & Renard 1996), all comets exhibit similar phase curves with a maximum polarization (P max) occurring near a 90° phase angle. However, a P max of around 25 per cent is noticed for comets such as IPlHalley, whereas a value below 15 per cent is obtained for relatively inactive comets (Levasseur-Regourd 1992; Levasseur-Regourd et al. 1996). Polarization maps of the coma, as compared with brightness maps, enhance some details; jets are revealed by an increase in polarization (e.g. Eaton, Scarrott
1997MNRAS.289..535M
542
N. McBride et ai.
4o
4 3 ~ :::s Logd (krn) 2.0 2.5 3.0 3.5 4.0 4.5 Event 1 Pre-closest approach.
.
Post-closest approach 5.082
.3
Event 2 o Event 3 ·l~~~~~~~~~~~~~~~ 1.5 2.0 2.5 3.0 3.5 4.0 4.5 5.0 Log d (krn)Figure 5. Intensity as a function of distance from encounter for the green dust channel. The three main events are labelled, with possible secondary peaks also indicated with arrows. The open symbols represent the data for which the fits to the 'background' (or, more correctly, the underlying trend in the data) have been made.
& Warren-Smith 1988); a circurnnucleus halo extends to nucleus distances of :52000 kID where a decrease in polarization is observed (Renard, Levasseur-Regourd & Dollfus 1992; Renard, Hadamcik & Levasseur-Regourd 1996). A change in the value of P =x' as well as
an increase or decrease at a given phase angle, is likely to be due to a change in the physical properties (e.g. size distribution) of the scattering dust.
During the Grigg-Skjellerup flyby, the phase angle remained constant at 90?4, i.e. in the phase range where the polarization reaches its maximum P =x' The polarization beyond 10 000 kID from the comet is around 15 per cent, consistent with the typical values for low-activity comets. Drastic changes take place closer to the nucleus (Fig. 3b). A sharp increase is correlated with event 2, and a smaller increase with event 1 (apparent even in the smoothed data shown in Fig. 3b). However, a significant decrease in polariza-tion occurs at the main peak, and in the region of event 3 .
The colour data, also shown in Fig. 3, show that the blue and the green channels remain virtually identical for most of the encounter, with a colour ratio that remains generally constant after the absolute calibration is taken into account. A slight reddening is apparent in the inner coma, for distances to the nucleus smaller than 5000 kID, and such an effect was observed for Comet Halley (Levasseur-Regourd et al. 1986b), and may indicate a change in the physical properties of the grains in this region.
In this paper we are concerned principally with the explanation for intensity variations in the inner coma, and in particular the OPE events. In order to explain these events as real cometary phenomena we must investigate the expected properties of a 'normal' coma, and investigate any possible instrumental or spacecraft-related effects. 5 GENERAL DUST COMA MODELS
A cometary dust coma density distribution depends on the total dust production rate, its variation with time and the position of active regions on the nucleus surface, and the dust grain size distribution and composition which determine the ratio of radiation pressure to gravitational forces ({3). The most trivial model would be a uniform and isotropic emission of grains with {3
=
0, resulting in an inverse square law fall-off in the dust spatial density. The fountain model (Divine 1981, 1983, 1985) provides a more realistic representation, but requires a number of nucleus and dust properties as inputTable 4. Properties of the OPE events. The contrast with the background is the factor by which the event peak appears to exceed the local background as shown in Fig. 5.
Event Main 2 3
Peak intensity (counts s -1 in green) 2::1130 2::65000 2::19900 2::22500
Contrast with background 15 9 185
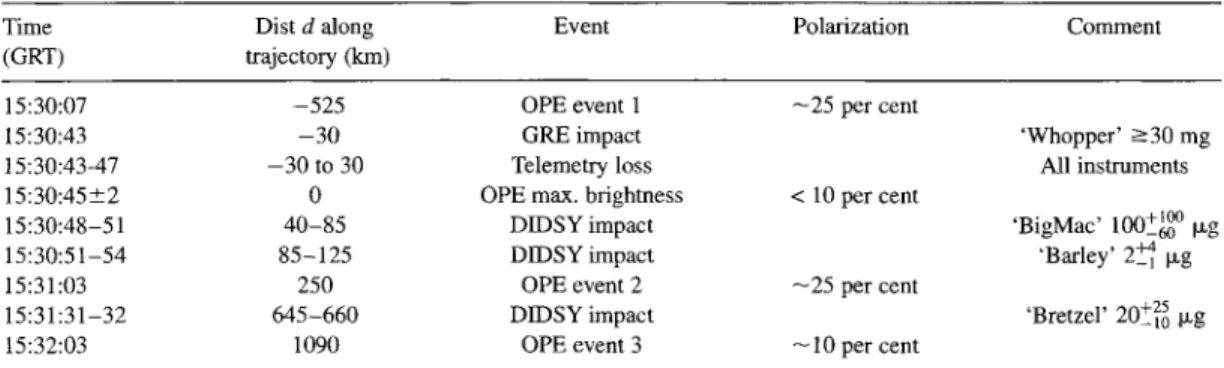
Ground Received Time 15:30:07 15:30:45 15:31:03 15:32:03 Distance d from main peak (km) -525 0 250 1095
Table 5. Time line of events at 26P/Grigg-Skjellerup encounter. Note the OPE events do not coincide with the DIDSYevents,. although the telemetry drop-out and the OPE brightness peak do appear to be correlated with the GRE impact e v e n t . ' Time Dist d along Event Polarization Comment (GRT) trajectory (km)
15:30:07 -525 OPE event 1 -25 per cent
15:30:43 -30 GREimpact 'Whopper' 2::30 mg
15:30:43-47 -30 to 30 Telemetry loss All instruments 15:30:45±2 0 OPE max. brightness < 10 percent
15:30:48-51 40-85 DIDSY impact 'BigMac' l00~~ IJ.g 15:30:51-54 85-125 DIDSY impact 'Barley' 2~ IJ.g 15:31:03 250 OPE event 2 -25 per cent
15:31:31-32 645-660 DIDSY impact 'Bretzel' 20~rg IJ.g 15:32:03 1090 OPE event 3 -10 per cent
"
1997MNRAS.289..535M
The inner coma of Comet 26P/Grigg-Skjellerup
543
'-l.t;' I I I I I I I : I I I I I I I I Secondary
t
t • •
fragmentsd e b a
a
c
Time exaggerated viewb
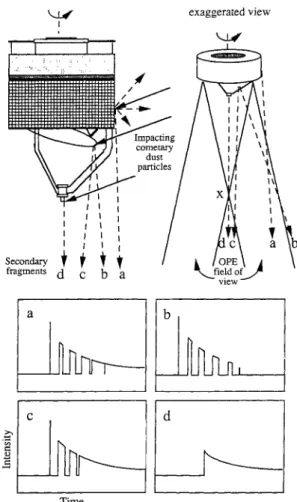
dFigure 6. Schematic of trajectories of ejecta from impacts of cometary dust
on Giotto. The conical field of view of OPE with half angle 1?3 rotates with a
period of 4 s. a, b, c and d are spherical ejecta which can enter the OPE field of view which would produce lightcurves as shown (in reality these would be sampled eight times per revolution as described in the text). The point X lies
~43 m from the spacecraft. Particles d and c must be produced by impact events on the antenna dish and the tripod struts.
parameters which for any given comet may be poorly understood or unknown. It has, however, provided a powerful tool for predicting the average coma properties for comets including Halley (Pankie-wicz 1989; Pankie(Pankie-wicz et al. 1989).
3.5
3.0
n=3.5 ~ ~ n=2.0 ~•
o~
is id. 2.5,3
2.0 ~~~--\.5Event 1
\.0 .f-,.~~,-..-~....,..~~-r~~ . . . -.J--700 ·600 ·500 -400 -300Log [Distance (km) along trajectory 1
5.0 4.5 4.0
~
~ 3.5,33.0
2.5 2.0 \.5Once a coma spatial density model has been produced, the observed intensity can be derived by applying a dust scattering model (Goidet-Devel1994; Goidet-Devel et al. 1997) and integrat-ing along the OPE line of sight as a function of time usintegrat-ing the flyby geometry as shown in Fig. 1. When doing this one must remember that the effective viewing area of OPE must be treated as a cone rather than a cylinder.
Fig. 4 shows fits to the data assuming a simple r-2 relationship
for dust particle spatial density (Le. spherically symmetric coma), with various flyby geometries as described by Xo and Zo0 The main peak is fitted in Fig. 4(a) and the outer coma is reasonably 'well-behaved', fitting quite well to a simple r -2 spherically symmetric
dust density. The fits are (as expected in the outer coma) not significantly dependent on the inner coma flyby geometry. The inner coma however is clearly complex and needs more in-depth modelling. In Fig. 4(b) the curves have been separately fitted to event 3, as if this was the main peak (i.e. the centre of a spherical coma). It is clear that the fit is not good, and that event 3 is indeed a feature superimposed upon the main activity curve, the cause of which needs to be explained.
6 OPE EVENTS
Before considering possible explanations for the OPE events, it is worth looking at their characteristics in more detail. Fig. 5 illus-trates the three main events as well as several others, together with fits to the nominal background intensity. For the background near events 1 and 2, power-law fits are appropriate:
background count near event 1
=
7885Idl-o.745 ,background count near event 2 = 1.447 X 1Q8Idl-2.0 ,
whereas higher order tenns are needed for event 3:
loglO(background count near event 3)
=
26.77 - 17.73 10glO d+
4.25(10glO d)2 - 0.36(lOglO d)3.The intensities of each event can then be obtained simply by subtraction of the calculated local background at each point. The basic properties of the three main events are listed in Table 4.
The shapes of the event profiles provide evidence for their origin. Instrumental effects would manifest themselves as either a discontinuity or drift in signal, or if an intermittent effect, a rapid rise and an exponential fall. The flawless stability of the house-keeping data (high voltage, low voltage, temperature) during the
n=2.1 ~ n=2.0
•
. 0•
o
e
o COo•
~
~~
1050~oo
oEvent 3
Cbco
0 1100 1150 1000 1500 2000 2500Log [Distance (km) along trajectory 1
Figure 7. Profiles of events 1 and 3. The white filled circles indicate the points assumed to be part of the decay of the event profiles. By subtracting the underlying local background (shown here as the solid curves; as shown in Fig. 5) we can fit the profile decrease to a Id -
do In
power law where do is the assumed start of the 'impact event'. The arrows indicate the position ofdo
corresponding to the value of n as labelled.© 1997 RAS, MNRAS 289, 535-553
1997MNRAS.289..535M
544
N.
McBride et al.
--.1.0...
~0.8 " -~ c;>0.6 .~ 0.4 <u Q 0.2 Trajectory 0.0 I....-""'--...L~-'-... _=--...x
-40 -20°
20 40Angular dist
1/1
(deg)
z
n('ljJ, r)
y
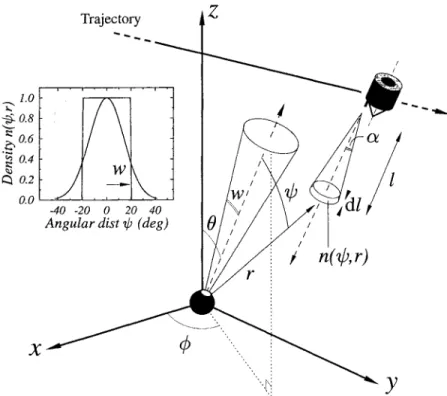
Figure 8. Schematic of the jet model. Particles in jets are asswned to be emitted radially. Ajet is defined by parametersf, the fraction of total dust emission from the comet emitted in the jet, and w, the angular half-width of the jet (see text). The dust spatial density n(I/t, r) at cometocentric distance r at an angular distance
I/t
from a jet goes to contribute to the observed brightness seen in the OPE conic field of view.flyby, and of the background signals before and after the flyby, rules out an electronic failure. In addition, event 3 does not exhibit an exponential decay and the time constants for events 1 and 2 are different.
Optical artefacts because of the damage caused at the Halley encounter can also be ruled out. Since the OPE telescope points along the central axis of the spacecraft which is aligned with the velocity vector, celestial sources would not move in the field of view. Reflection of sunlight from the spacecraft structure would be modulated with the spin period and is the likely cause for the high background signals in three sectors. In order to obtain a changing signal (events) either the source or the reflecting material must move. In either case, however, the reflection would still be modu-lated by the spin.
Individual cometary dust grains passing close to the spacecraft and through the OPE line of sight could produce a large signal which would decay with time. However, in order to produce a sufficiently large signal, a dust grain would have to be close to the spacecraft and hence would not remain in the line of sight for long enough as a result of the oblique angle at which the particle would enter the field of view. In order to be visible for a number of seconds, the object would have to be distant and therefore large. In this case the relative change of distance as the particle passed through the field of view would be small giving a negligible decay in brightness. In the case of event 3, with a duration of -100 s, the distance traversed in the field of view will be -1400 km and hence the distance of an object from Giotto would need to be 28 000 km. Assuming a lambertian sphere with geometric albedo of 0.04, a particle size of -9 km is required to provide the observed peak signal, but the profile shape would be virtually flat. It is clear that individual cometary particles cannot reproduce the properties of the observed events.
7 IMPACT ON G/OTTO AS AN EXPLANATION
FOR EVENTS
The impact of cometary dust particles on Giotto seriously affected the performance of a number of instruments at the Halley flyby. We now investigate the possible explanation of the OPE events as a consequence of such impacts during the Grigg-Skjellerup flyby.
Although only three impacts were detected by DIDSY, this experiment was located on the bumper shield, which at the Origg-Skjellerup flyby was inclined at an angle of 68?8 to the relative velocity vector. It presented a cross-sectional area of -0.76m2 compared with -3.6m2 for the whole spacecraft (McDonnell et al. 1993). The largest impact on the spacecraft, coinciding with the telemetry loss near closest approach, occurred on the rear of the spacecraft, as derived from the Giotto Radio Science Experiment (ORE) data (Patzold et al. 1993). It is therefore possible that some effect of impacts or their resultant plasma and debris could be responsible for the other events seep by OPE. DIDSYand ORE data allow us to estimate the mass-of the largest impacting particles.
The times of the DIDSY impacts were known to an accuracy of -3 s or better but did not coincide with OPE events (see Table 5). However, if the events are related to impacts, then those hitting near the OPE experiment (and therefore not detectable by DIDSY) are likely to have the maximum effect. Unfortunately, moderate-sized impacts near the rear of the spacecraft would only be detectable if they caused significant velocity or nutation shifts in the spacecraft's motion. The mass of the largest impact, near closest approach, was 30 mg or greater (Patzold et al. 1993). It dominated the total mass influx to the spacecraft and was consistent with the mass distribu-tion index for the DIDSY impacts (McDonnell et al. 1993). This implies a total of -15 impacts of particles with mass in the range
1997MNRAS.289..535M
The inner coma of Comet 26PIGrigg-Skjellerup
545
1 f.Lg to 1 mg and only one with mass> 1 mg on the whole spacecraft during the flyby. We must estimate effects of such impacts to determine if they are a possible source of the events seen in the OPE data.
An impact of a particle at 14 km S-1 on to a semi-infinite target
will vaporize the particle and a considerable mass of target material. The total charge liberated from a 1 f.Lg impact will be a few f.LC, and from a 1 mg impact a few mC (see e.g. Kruger 1984). The impact itself would produce an effectively instantaneous optical flash, and the local plasma density would decay with a time constant of much less than a second. It is difficult to conceive of a plasma mechanism which could produce the observed event signals from OPE since the decay of the events is much longer than this.
If a small object passed through the field of view at a very shallow angle relative to the line of sight and at a low relative speed to the spacecraft it might be possible to produce the observed brightness decay seen in the OPE events. This might be envisaged if an impact on the side of the spacecraft produced a small secondary fragment or cloud of particles (as suggested by Le Duin et al. 1996). However, the line of sight is hardly accessible to impacts on the majority of the surface of the spacecraft. In almost all of these cases, the ejecta would pass in and out of the field of view rapidly once, or several times owing to OPE's position offset from the spin axis of Giotto. Any irregular shaped object would produce rapid variations in scattered light as it tumbled. Fig. 6 shows the geometry and expected brightness profile of a spherical object as a function of time. The probability of obtaining secondary ejecta in the field of view, from three separate impacts of type d but none of types a, b or c, large enough to produce signals between 10 and 200 times the cometary brightness, in such a geometry that the OPE sampling produced a smooth intensity decay with time, is very low.
Consider also the profiles of the event data. If a spherical, or non-spinning, ejecta particle (produced by an impact event) travelled away from Giotto down the OPE line of sight at a constant relative velocity with respect to the spacecraft, the apparent brightness of the particle, as seen from Giotto, would fall as t-2 where t is the time
from the impact event. This means that the background-subtracted profiles of the events seen in the OPE data would fall as Id - dol-2
where d is the distance along the OPE trajectory (as in Fig. 3) and do is the distance along the trajectory at which the impact occurs. This condition also holds if we have many particles, perhaps constituting an ejecta cloud, travelling down the line of sight, even if they have different (but constant) individual velocities. However, the value of do is unknown, and its assumed position significantly affects the form of the profile decay derived from the data.
We can investigate whether aid - dol-2 behaviour is seen in the data. We will consider events 1 and 3 only, as events near the main brightness peak may be convolved with other events, i.e. event 2 cannot be background-subtracted unless one makes initial assump-tions about what convolved events exist in the complex main-peak region.
Fig. 7 shows in detail the data around events 1 and 3. The solid curve shows the assumed background (as in Fig. 5) which can be subtracted from the data points. We identify the data points we consider to be part of the event decay, i.e. where the ejecta is fully within the OPE field of view (open circles in Fig. 7). We can then pick an arbitrary do to indicate the start of the event (i.e. the point at which the ejecta particle, or particles, leave the spacecraft) and plot log [background-subtracted data] against log Id - dol to investigate the form ofthe profile decrease. A straight-line fit, with a gradient of n, would indicate that the event profile decrease varied as t-n , where
© 1997 RAS, MNRAS 289, 535-553
n = 2 would be consistent with ejecta travelling down the OPE line of sight at a constant velocity.
On investigation, we find that linear fits adequately describe the data obtained for a range of do values for both events 1 and 3, indicating that the event profiles could indeed decay as t-n . Strictly speaking, there is only one best-fitting power law at anyone time, although the data (particularly event 1) are sufficiently noisy that we could realistically fit a variety of do and n combinations without the quality of fit varying widely. The arrow labelled n
= 2 in the event 1
graph in Fig. 7 shows the required position of do needed to obtainn
= 2 (the linear fit yielding a regression coefficient of 0.99).
However, this nominal 'start of the event' occurs significantly after the apparent rise in the brightness data indicating that this value of do is not realistic. The arrow labelled n
= 3.5 shows the
position of do which might be chosen as a reasonable position for the start of the event just by inspection, although this do yields n= 3.5 (with a regression coefficient of 0.98) which is inconsistent
with the n= 2 requirement of the ejecta scenario. It is worth noting
that Le Duin et al. (1996) use data without combining sectors to obtain the true polarized intensity. We have also considered this but find that our conclusions do not change and the profile of the data does not change. It seems then that the profile of event 1 could not be produced by a spacecraft impact.Consider now event 3. The open circles in the event 3 graph in Fig. 7 show the data points we consider to be part of the decay of event 3. The inset shows the start of the event in detail, showing clearly the non-instantaneous rise of the event. We can perform the same reduction as described above and find the position of do which gives n
= 2, as indicated in the figure by the
n= 2.0 arrow. This
position occurs after the start of the event which is inconsistent with the ejecta scenario. However, by again picking a reasonable posi-tion for the start of the event by inspecposi-tion, we see this start point would yield n = 2.1 as indicated in Fig. 7. Both these fits yielded regression coefficients of 0.99. We investigated the effect of picking slightly different background curves for the background-subtrac-tion of the profiles (for example choosing the 'r-2 , profile forXo = 20 km and Zo = 150 km as shown in Fig. 4a) and we find that the values of n for a given do vary by up to 0.1 for a range of 'reasonable' backgrounds. We thus conclude that although the do position which produces n
= 2.0 for event 3 does occur slightly
after the data begin to rise, it is sufficiently close to the start of the event such that a t-2 decay is reasonable. Hence the event 3 profilecould be consistent with impact ejecta.
Le Duin et al. (1996) suggested that the main brightness peak was caused by a shell of ejecta associated with the GRE (~30 mg) particle impact (Piitzold et al. 1993), which is thought to have impacted on the side solar arrays near the rear of the spacecraft (i.e. nearest to the antenna tripod structure). The other events were also attributed to impact-related features. Although the profile decay of event 3 was shown above to be broadly consistent with ejecta moving down the OPE line of sight at constant relative velocity, we question the feasibility of this scenario by considering the impact dynamics and geometry.
The shell of ejecta as described by Le Duin et al. (1996) needs to be travelling at a relatively low velocity. Too high a velocity could not produce the long decay seen in event 3, and too low would produce 'flashing' as the ejecta entered the OPE line of sight (see Fig. 6). Le Duin et al. write 'in excess of 4 m s -1, and we calculate
of order 10 m S-1 is needed. However, impact ejecta speeds reflect the hypervelocity nature of the event, with small ejecta particles being closely coupled with the expanding vapour cloud, and travelling with the same velocity as the leading edge of the
1997MNRAS.289..535M
546
N.
McBride et al.
vapour cloud (Kadono & Fujiwara 1996). This means that likely lower limits for the ejecta velocity are around twice the impact speed (Eichhorn 1978; Kadono & Fujiwara 1996), which in this case means about 28 km s -1. This is clearly not consistent with the impact scenario suggested by Le Duin et al. (1996). However, one can consider spallation in brittle materials (e.g. Asay & Shahinpoor 1993) where a shock wave reflected from the rear surface can cause fracture and cracking of the material at its front surface, producing lower velocity ejecta. Schneider, Stilp & Kagerbauer (1995) note some ejecta velocities produced by this mechanism of around 0.3 km S-1 by hypervelocity impacts (6-9 km s-l) on 14 mm thick
panes of quartz glass. These sorts of velocities, although lower than those of the 'fast' ejecta, are still too high.
Although the solar array cover glass is a tempting explanation for brittle material spallation products from Giotto, the ejecta velocity is not the only problem with the explanation. By virtue of their production mechanism (e.g. Asay & Shahinpoor 1993) spallation products will leave the surface in the direction of the surface normal. This means that this ejecta could not get into the OPE line of sight if the impact was on the Giotto solar arrays. The majority of the fast ejecta leaves the surface at around 60° to the surface normal (Eichhorn 1978) and hence would not be able to enter the OPE line of sight.
The impact explanation offered by Le Duin et al. (1996) requires small (~I-J.Lm) particles to supply enough total cross-sectional area without the total mass ejected becoming unreasonable. However, ongoing studies of ~5 km S-1 light gas gun impacts using
comparable-sized impactors on glass targets at the University of Kent (e.g. Taylor & McDonnell 1997) show that the spallation products tend to be much bigger than the J.Lm-sized regime needed for the OPE impact scenario, with mm-size fragments being typical. There would be J.Lm-sized ejecta but this would be as part of the fast ejection component travelling at tens of km S-I. j,Lm-sized ejecta travelling at a few tens of m s -I, from a 14 km s -I impact, do not appear to be physically viable.
The proposed impact site used in the modelling ofLe Duin et al. (1996) is positioned exactly on the rear edge of Giotto, so allowing (at least potentially) ejecta products to form a spherical shell (hence with some fragments travelling down the OPE line of sight). The solar arrays of Giotto did not extend right to the edge of the spacecraft structure (they finished about 2 cm from the edge) and so this geometry precludes the solar array glass fragments getting into the OPE line of sight. The solar panel substructure (i.e. the spacecraft body itself) was made of aluminium honeycomb with glass fibre face sheets. If we allowed the last 1 cm of this structure to undergo impact fragmentation to produce some glass fibre frag-mentation products, then one can perhaps envisage some fragments entering the OPE line of sight. However this potential target area constitutes only around 0.5 per cent (max) of the total resolved spacecraft area (as seen by an impacting dust particle). It seems somewhat contrived to have this impact geometry for all the OPE events, and yet not to have detected more particles by DIDSY which presented a much greater detector area. This is in addition to the fragment size and velocity problems mentioned above.
In terms of impact geometry, we think the most likely site for an impact which allows ejecta to travel down the OPE line of sight is the antenna tripod (with the GRE particle impacting the part of the tripod nearest the edge of the solar arrays). The tripod is spinning with the spacecraft, but can present up to ~6 per cent of the total spacecraft resolved area (although only about 0.5 per cent at any one time would be consistent with the probable GRE particle impact site of Plitzold et al. 1993). The tripod was made of carbon
reinforced plastic box section structure, and most of the velocity/ spallation comments above would apply here also. There is the possibility of the impactor passing straight through the box section producing fragments from the exit hole in the second surface (see e.g. Christiansen 1990) although again geometry precludes the entry of these fragments directly into the OPE line of sight. A similar argument is appropriate to the antenna dish which was made of aluminium honeycomb with carbon reinforced plastic skins. The dish was despun and thus maintained a constant resolved area at encounter of ~5 per cent of the spacecraft total.
These considerations lead us to conclude that the impact-generated ejecta cloud model suggested by Le Duin et al. (1996), while superficially appealing, requires more work on the possible impact geometries to specific spacecraft structures, and a mechan-ism for production of slow-moving J-Lm-sized ejecta from a 14kms-1 impact, before it can be conclusively accepted. We feel
it is one possible explanation, but alternative explanations also need to be considered. Le Duin et al. quickly dismiss cometary explana-tions for the OPE events as 'ad hoc'. They also say that cometary jets would have to have unexpected dust spatial distributions, but do not investigate the effect of various geometries of jets. We will now describe a detailed geometrical dust jet model in order to investigate the possibility of the OPE events being of cometary origin, so offering one alternative explanation for the OPE events.
8 COMETARY EXPLANATION FOR EVENTS
8.1 Coma-jet model
In order to assess the geometrical possibility of cometary coma features giving rise to the overall shape of the OPE data and also the 'events', a model was constructed where asymmetric emission and dust jet activity can be accommodated, and the relative brightness observed by the OPE telescope on board Giotto could be simulated. In the model, the background cometary coma of light-scattering grains was assumed to be spherically symmetric (where the spatial density of scattering particles varies as the inverse square of the cometocentric distance). Complex structure (and sunward-biased emission, more akin to that obtained in fountain models) was obtained by superimposing, on this spherical coma, dust jets which can have various widths, directions and emission weightings. By using very wide 'jets', global asymmetric emission could be simulated.
Consider a jet, as shown in Fig. 8, initially assumed to be a simple cone pointing in a direction given by spherical polar coordinates <p,
O. The jet half-width angle (i.e. half the conic apex angle) is denoted by w, with the conic jet subtending a total solid angle of
n.
Scattering grains are assumed to flow radially an<! uniformly away from an active region on the nucleus such thal the spatial density of scattering grains along the cone falls with an inverse square law. No curvature of the jet due to radiation pressure need be considered as this model concentrates on the near-nucleus region (within 1000 km or so of the nucleus). If one normalizes the total emission of scattering grains from the nucleus to unity, then the fraction of material emitted in the jet is fJ. The fraction of the total emission accounted for by the remaining material in the general coma is then fe, given by 1 -!J.
Hence the relative emission per steradian for the jet and coma respectively is given by EJ = fJm andEe
=
fe/4TI. Many jets can thus be incorporated with relativeemissions given by fJl,j'J2,j'J3 .. fJi, such that
(3)
1997MNRAS.289..535M
The inner coma of Comet 26PIGrigg-Skjellerup
547
In this model, the scattering properties of the material are assumed to remain constant with time over the period of the encounter. Noting that the phase angle is constant for the viewing geometry from the Giotto spacecraft throughout the encounter, the contribution to the observed brightness from a unit volume element of space (which is in the OPE field of view) is simply proportional to the number of grains n within the element (i.e. spatial number density) and inversely proportional to the square of the distance 1
from the spacecraft to the element. Although it is convenient here to express the emission functions and scattering in terms of numbers of particles (implying identical particle properties with emission direction) the model is in fact more general if we consider n to be proportional to the amount of light scattered (i.e. proportional to the albedo-area product). Therefore, if the particle properties within jets are different from the average coma emission, then the difference in scattering properties is implicit in the value of
IJ.
In order to make the jet model more physical, the simple conic visualization is replaced with a jet such that the angular density profile is Gaussian in nature. This is depicted by the inset graph in Fig. 8. For any given distance
r
from the nucleus, the relative spatial density n(1/;, r) of scattering particles as a function of angular distance 1/; from the jet direction vector is shown for the conic jet and the Gaussian jet. The simple conic jet, of half-width w, has a square angular profile, whereas the more realistic jet has a Gaussian profile.The total emission in the Gaussian jet must still be equal to
IJ, and
this is satisfied by ensuring that the Gaussian angular profile retains the same peak height, and that the standard deviation of the profile is equal to wiy12.
The relative brightness contribution of a given unit volume element of space is proportional to the total number N of grains in the element, where N consists of ne(r) particles from the general coma background, and nJi(1/;i, r) particles from the ith jet present (each jet being angular distance 1/;i from the volume element being considered) such that
N
=
nC<r)+
LnJi(1/;i,r). (4)The contribution to particle number from the general coma is given by
R~/e
nC<r) = - - .
,.z
411" (5)As we are working in arbitrary units, the constant Ro (which has units of length) can be put to unity. For the ith jet, which has emission fraction/Ii and associated width Wi and hence subtends a
solid angle 0i, the contribution is given by
R~fu -1/;r
nJi(1/;i, r)
=?"
{l.,
exp ~,
(6)
with Ro again put to unity.
The relative intensity contribution B from material in a given unit volume element, which is in the field of view of the OPE telescope at distance 1 from it, is then given by
I)jN
B=T
(7)As above, Lo is a constant (with units of length) that can be put to unity.
To obtain a relative OPE lightcurve, points along Giotto's trajectory are selected. At each point, the relative brightness contributions from all volume elements within the OPE telescope field of view are added. The OPE field of view is a narrow cone of
© 1997 RAS, MNRAS 289, 535-553
half angle a, equal to 1?3, and so for simplicity it is sufficient to consider contributions from 'slices' of the conic field of view as a whole (see Fig. 8) where the spatial density distribution of particles associated with the background coma or jets is assumed to be constant within a given slice of the conic field of view. At any specific point at distance 1 along the line-of-sight direction, the point lies within an associated volume element which contributes a relative brightness B. The total relative intensity contribution
BOPE is therefore described by
J
I-BOPE
=
0 B'IT(itana)2d1. (8)As B is proportional to 1/l2 , then the relative brightness contribution from each slice is independent of distance 1, and just dependent on cometocentric distance r. The relative intensity contribution BOPE is
obtained by performing the numerical integration along the OPE line of sight given by (with constants put to unity)
~
[ Ie
"
fu -1/;;] BOPE=
~ 4 .,.+
~n .. ,.exp-2 .1=0 'IT,
i""
W,(9) The distance lmax is the maximum distance along the line of sight for which brightness contributions are added. If the coma were an infinitely extended homogeneous optically thin cloud, then each slice of the conic field of view would give an equal brightness contribution regardless of its distance 1 from the telescope. How-ever, as the brightness contribution essentially goes with l1r2 as shown in equation (9), then for any point along the Giotto trajectory within around 1000 kID of the closest approach point, and for closest approach distances within a few hundred kID, the brightness con-tribution BOPE has fallen to around 1 per cent of the near-field value
when 1-10000 kID. (Note that the contribution BOPE at 1= 1 0000 kID may in fact be much less if the field of view includes the near-nucleus region.) In the numerical integration, lmax was therefore put to 10 000 kID.
Running the model for the case where there is only a spherically symmetric coma yields results that do not fit the observed data well. Fig. 9( a) shows a representation of the spatial density distribution of the modelled spherically symmetric, 'r-2 , coma, for a ±250 kID
'slice' along the x-y plane. Although this plot shows the density variation at
z
=
0 only, whereas the OPE telescope samples space with a range ofz
values, it nevertheless offers a useful visualization of the emission function of the comet. The vertical axis represents the spatial density of scattering particles. Fig. 9(b) shows the modelled fit against the OPE data for two test fits using different values ofXo
andzoo
As one might expect, a simpler
-2 coma is inadequate to fit the data.It is clear that the OPE telescope sampled a significantly more asymmetric near-nucleus coma than a simple spherically symmetric model would suggest. In the jet model described above, broad asymmetries in emission function can be simulated by superimpos-ing one (or more) broad jets on the r -2 background coma. We would expect most of the emission to be towards the sunward hemisphere (i.e. sunward of the z-y terminator plane) but need not expect perfect symmetry about the sub-solar direction (the x axis). Fig. 9(c) shows the spatial density representation as in Fig. 9(a), but now a broad jet has been added to the r -2 background coma. This 'jet' has a half-width w of 40°. Broad jets were seen from HMC images at the
Giotto-Halley encounter, with three major jets having half-widths
of 37°,31° and 44°, accounting for 0.75 of the observed intensity (Keller et al. 1994). The modelled jet accounts for 0.8 of the total modelled emission, and is in the direction defined by f/>