HAL Id: hal-00301163
https://hal.archives-ouvertes.fr/hal-00301163
Submitted on 11 Apr 2005HAL is a multi-disciplinary open access
archive for the deposit and dissemination of sci-entific research documents, whether they are pub-lished or not. The documents may come from teaching and research institutions in France or abroad, or from public or private research centers.
L’archive ouverte pluridisciplinaire HAL, est destinée au dépôt et à la diffusion de documents scientifiques de niveau recherche, publiés ou non, émanant des établissements d’enseignement et de recherche français ou étrangers, des laboratoires publics ou privés.
Kinetic model framework for aerosol and cloud surface
chemistry and gas-particle interactions: Part 2 ?
exemplary practical applications and numerical
simulations
M. Ammann, U. Pöschl
To cite this version:
M. Ammann, U. Pöschl. Kinetic model framework for aerosol and cloud surface chemistry and gas-particle interactions: Part 2 ? exemplary practical applications and numerical simulations. Atmo-spheric Chemistry and Physics Discussions, European Geosciences Union, 2005, 5 (2), pp.2193-2246. �hal-00301163�
ACPD
5, 2193–2246, 2005
Kinetic model framework for aerosols and clouds,
Part 2 M. Ammann and U. P ¨oschl Title Page Abstract Introduction Conclusions References Tables Figures J I J I Back Close
Full Screen / Esc
Print Version Interactive Discussion
Atmos. Chem. Phys. Discuss., 5, 2193–2246, 2005 www.atmos-chem-phys.org/acpd/5/2193/
SRef-ID: 1680-7375/acpd/2005-5-2193 European Geosciences Union
Atmospheric Chemistry and Physics Discussions
Kinetic model framework for aerosol and
cloud surface chemistry and gas-particle
interactions: Part 2 – exemplary practical
applications and numerical simulations
M. Ammann1and U. P ¨oschl21
Paul Scherrer Institute, CH-5232 Villigen PSI, Switzerland
2
Technical University of Munich, Institute of Hydrochemistry, Marchioninistr. 17, D-81377 Munich, Germany
Received: 20 January 2005 – Accepted: 9 March 2005 – Published: 11 April 2005 Correspondence to: M. Ammann ([email protected])
© 2005 Author(s). This work is licensed under a Creative Commons License.
ACPD
5, 2193–2246, 2005
Kinetic model framework for aerosols and clouds,
Part 2 M. Ammann and U. P ¨oschl Title Page Abstract Introduction Conclusions References Tables Figures J I J I Back Close
Full Screen / Esc
Print Version Interactive Discussion Abstract
A kinetic model framework with consistent and unambiguous terminology and univer-sally applicable rate equations and parameters for aerosol and cloud surface chemistry and gas-particle interactions has been presented in the preceding companion paper by P ¨oschl, Rudich and Ammann (P ¨oschl et al., 2005), abbreviated PRA. It allows to
5
describe mass transport and chemical reaction at the gas-particle interface and to link aerosol and cloud surface processes with gas phase and particle bulk processes. Here we present multiple exemplary model systems and calculations illustrating how the general mass balance and rate equations of the PRA framework can be easily re-duced to compact sets of equations which enable a mechanistic description of time and
10
concentration dependencies of trace gas uptake and particle composition in systems with one or more chemical components and physicochemical processes.
Time-dependent model scenarios show the effects of reversible adsorption, surface-bulk transport, and chemical aging on the temporal evolution of trace gas uptake by solid particles and solubility saturation of liquid particles. They demonstrate, how the
15
transformation of particles and the variation of trace gas accommodation and uptake coefficients by orders of magnitude over time scales of microseconds to days can be explained and predicted from the initial composition and basic kinetic parameters of model systems by iterative calculations using standard spreadsheet programs. More-over, they show how apparently inconsistent experimental data sets obtained with
dif-20
ferent techniques and on different time scales can be efficiently linked and mechanisti-cally explained by application of consistent model formalisms and terminologies within the PRA framework.
Steady-state model scenarios illustrate characteristic effects of gas phase compo-sition and basic kinetic parameters on the rates of mass transport and chemical
re-25
actions. They demonstrate how adsorption and surface saturation effects can explain non-linear gas phase concentration dependencies of surface and bulk accommoda-tion coefficients, uptake coefficients, and bulk solubilities (deviations from Henry’s law).
ACPD
5, 2193–2246, 2005
Kinetic model framework for aerosols and clouds,
Part 2 M. Ammann and U. P ¨oschl Title Page Abstract Introduction Conclusions References Tables Figures J I J I Back Close
Full Screen / Esc
Print Version Interactive Discussion
Such effects are expected to play an important role in many real atmospheric aerosol and cloud systems involving a wide range of organic and inorganic components of con-centrated aqueous and organic solution droplets, ice crystals, and other crystalline or amorphous solid particles.
We hope that the presented model systems and simulations clearly demonstrate the
5
universal applicability and consistency of the PRA framework as a tool and common basis for experimental and theoretical studies investigating and describing atmospheric aerosol and cloud surface chemistry and gas-particle interactions.
1. Introduction
Surface processes and gas-particle interactions of aerosols and clouds are important
10
aspects of atmospheric chemistry and physics. They influence the atmospheric budget of ozone and other trace gases, the atmospheric residence time of particles and their influence on the hydrological cycle, the radiative properties of the atmosphere, and the health effects of inhaled particles. In the preceding companion paper by P¨oschl, Rudich, and Ammann (P ¨oschl et al., 2005), further on referred to as PRA, we have
pre-15
sented a kinetic model framework with consistent and unambiguous terminology and universally applicable rate equations and parameters, which allow to describe mass transport and chemical reactions at the gas-particle interface and to link aerosol and cloud surface processes with gas phase and particle bulk processes in systems with multiple chemical components and competing physicochemical processes.
20
As detailed in the preceding companion paper, the key elements and essential aspects of the PRA framework are: a simple and descriptive double-layer surface model (sorption layer and quasi-static layer); straightforward flux-based mass bal-ance and rate equations; clear separation of mass transport and chemical reaction; well-defined rate parameters (uptake and accommodation coefficients, reaction
prob-25
abilities, reaction rate coefficients, and mass transport rate coefficients); clear sep-aration of gas phase, gas-surface, and surface-bulk transport (gas phase diffusion
ACPD
5, 2193–2246, 2005
Kinetic model framework for aerosols and clouds,
Part 2 M. Ammann and U. P ¨oschl Title Page Abstract Introduction Conclusions References Tables Figures J I J I Back Close
Full Screen / Esc
Print Version Interactive Discussion
correction, surface and bulk accommodation); clear separation of gas-surface, sur-face layer, and sursur-face-bulk reactions (Langmuir-Hinshelwood and Eley-Rideal mech-anisms); mechanistic description of concentration and time dependencies; flexible in-clusion/omission of chemical species and physicochemical processes; flexible convo-lution/deconvolution of species and processes; and full compatibility with traditional
5
resistor model formulations. The PRA framework is meant to provide a common con-ceptual basis for experimental and theoretical studies of atmospheric aerosol and cloud surface chemistry and gas-particle interactions. Its practical applicability and flexibility shall be illustrated in this paper.
One of the primary aims of the flux-based PRA mass balance and rate equations
10
is the efficient mechanistic description of concentration and time dependencies of reactive and non-reactive gas uptake and particle surface aging. In Sect. 2 of this manuscript we show how the temporal evolution of surface composition, accommoda-tion and uptake coefficients can be efficiently followed over timescales from microsec-onds to days. Exemplary numerical simulations will be presented for model systems
15
referring to earlier studies and literature data of trace gas uptake onto solids (Sect. 2.1) and into liquids (Sect. 2.2). In Sect. 3 we illustrate characteristic effects of gas phase composition and basic rate coefficients on surface coverages, surface and bulk accom-modation coefficients, uptake coefficients, and bulk solubilities of trace gases interact-ing with solid and liquid particles under (quasi-)steady-state conditions. Throughout
20
this manuscript we will use the terminology of the PRA framework. For definitions and a list of symbols see the preceding companion paper (P ¨oschl et al., 2005).
2. Time dependencies of gas uptake and particle composition
The PRA flux formalism, mass balance and rate equations enable efficient descrip-tion of mass transport, chemical reacdescrip-tions, and surface composidescrip-tion in time-dependent
25
aerosol and cloud systems with multiple chemical species and competing processes. For such systems, the surface mass balance equations given in PRA Sect. 3.1 lead to
ACPD
5, 2193–2246, 2005
Kinetic model framework for aerosols and clouds,
Part 2 M. Ammann and U. P ¨oschl Title Page Abstract Introduction Conclusions References Tables Figures J I J I Back Close
Full Screen / Esc
Print Version Interactive Discussion
a set of coupled differential equations, which can be solved numerically by inserting the rate equations given in PRA Sects. 3.2–3.6 or alternative/complementary mathemati-cal descriptions of the involved physicochemimathemati-cal processes. Required input parameters are the initial concentrations of relevant chemical species and the corresponding mass transport and reaction rate coefficients.
5
Here we consider a few simple model systems and scenarios of gas uptake of onto solid and into liquid particles. The simulations were performed by iterative integration of the equations specified below with a standard spreadsheet program (Microsoft Excel 2000). The selected examples hve been chosen to show how reversible adsorption (accommodation and competition for surface area in the sorption layer) and chemical
10
aging (transformation of the quasi-static layer) can influence the time dependence of surface and bulk accommodation coefficients and uptake coefficients. Some of the input parameters for the numerical simulations have been adopted from experimental studies. The primary aim of the model systems and scenarios presented in this paper, however, is not to describe specific systems but to illustrate the flexibility of the PRA
15
framework and its suitability to describe generic features of gas-particle interaction kinetics.
2.1. Reactive gas uptake and transformation of solid particle surfaces
2.1.1. Model system Solid 1 (S1): adsorption and sequential surface layer reactions with particle components
20
In this model system we consider a trace gas X1, which undergoes reversible adsorp-tion and irreversible surface layer reacadsorp-tions on the surface of a solid particle, which initially consists of the non-volatile component Y1. In a sequence of three surface layer reactions, Y1 can be converted into the chemical derivatives Y2, Y3, and Y4, respec-tively: SLR1: X1 (s) + Y1 (ss) → Ys (ss); SLR2: X1 (s) + Y2 (ss) → Y3 (ss); SLR3:
25
X1 (s)+ Y3 (ss) → Y4 (ss). Surface-bulk transport processes as well as elementary gas-surface and surface bulk-reactions are assumed to be negligible. Under these
ACPD
5, 2193–2246, 2005
Kinetic model framework for aerosols and clouds,
Part 2 M. Ammann and U. P ¨oschl Title Page Abstract Introduction Conclusions References Tables Figures J I J I Back Close
Full Screen / Esc
Print Version Interactive Discussion
conditions, the general PRA surface mass balance and rate equations can be reduced to:
d[X1]s/dt= Jads,X1− Jdes,X1− Ls,ss,X1 (1)
d[Y1]ss/dt= −Lss,Y1 (2)
d[Y2]ss/dt= Pss,Y2− Lss,Y2 (3)
5
d[Y3]ss/dt= Pss,Y3 (4)
Ls,X1= kSLR1,X1,Y1[X1]s[Y1]ss+ kSLR2,X1,Y2[X1]s[Y2]ss+ kSLR3,X1,Y3[X1]s[Y3]ss (5)
Lss,Y1= kSLR1,X1,Y1[X1]s[Y1]ss (6)
Pss,Y2− Lss,Y2 = kSLR1,X1,Y1[X1]s[Y1]ss− kSLR2,X1,Y2[X1]s[Y2]ss (7)
Pss,Y3− Lss,Y3 = kSLR2,X1,Y2[X1]s[Y2]ss− kSLR3,X1,Y2[X1]s[Y3]ss (8)
10 Pss,Y4 = kSLR3,X1,Y2[X1]s[Y3]ss (9) Jads,X1= S0,X1ωX1/4[X1]gs(1 − θs) (10) SX1= S0,X1(1 − θs) (11) θs= [X1]s/[X1]s,max = σs,X1[X1]s (12) Jdes,X1= τd,X1−1 [X1]s (13) 15
γX1= γsor,X1= Jads,X1− Jdes,X1
Jcoll,X1 (14)
The model system and rate equations outlined above correspond to a Langmuir-Hinshelwood-type mechanism as discussed by Ammann et al. (2003). Note, however,
ACPD
5, 2193–2246, 2005
Kinetic model framework for aerosols and clouds,
Part 2 M. Ammann and U. P ¨oschl Title Page Abstract Introduction Conclusions References Tables Figures J I J I Back Close
Full Screen / Esc
Print Version Interactive Discussion
that the classical Langmuir-Hinshelwood mechanisms and rate equations known from the chemical engineering literature usually refer to reactions between two adsorbed species (heterogeneous catalysis) rather than one adsorbed species and one quasi-static surface layer component.
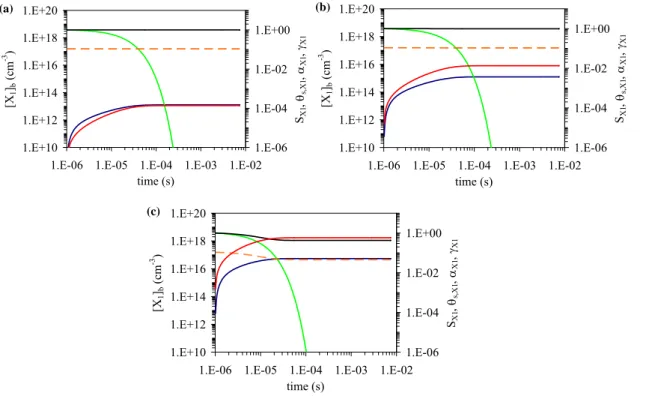
For the exemplary model simulations illustrated in Fig. 1, the following
5
input parameters have been used in the iterative calculation and integra-tion of Eqs. (1)–(10): S0,X1=10−3; ωX1=3.6×104 cm s−1; τd,X1=18×10−5 s;
σX1=1.8×10⁻¹⁵ cm2, kSLR1,X1,Y1=2.1×10⁻¹⁷cm2s−1, kSLR2,X1,Y2=2.1×10⁻¹⁹ cm2 s−1,
kSLR3,X1,Y3=2.1×10⁻²¹ cm2 s−1, [Y1]ss,ini=1×1014 cm−2, [X1]gs=2.5×1013 cm−3 (sce-nario S1-1) or 2.5×1011cm−3(scenario S1-2). ωX1, S0,X1, τX1, σX1, and kSLR1,X1,Y1 are
10
based on the values reported by P ¨oschl et al. (2001) for the interaction of ozone with the polycyclic aromatic hydrocarbon benzo[a]pyrene (BaP) on soot at ambient tem-perature and pressure. The experimental results of P ¨oschl et al. (2001) also support the assumption that the basic adsorption, desorption, and reaction rate parameters are not significantly affected by the chemical transformation of the quasi-static surface
15
layer (near-identical observations on soot particles which were fully or only partially covered with benzo[a]pyrene). Note, however, that ozone may be adsorbed either in the form of O3molecules or in the form of O atoms (P ¨oschl et al., 2001). In the latter case the actual surface accommodation coefficient might be significantly higher than the observed short-term uptake coefficients, which would convolute the actual
accom-20
modation process and a surface reaction (decomposition of O3 into O and O2). A detailed analysis and investigation of this aspect is beyond the scope of this paper, but we are planning to pursue this aspect in future studies applying the PRA framework. The reaction products Y2–Y4can be pictured as BaP derivatives with increasing num-ber of oxygenated functional groups and decreasing reactivity towards photooxidants
25
(BaP-quinones, hydroxy-ketones, acid anhydrides, lactones, etc.; Letzel et al., 1999a, b, 2001; P ¨oschl, 2002).
In the numerical simulations, the gas phase concentration of X1close to the surface, [X1]gs, was kept constant, i.e. it was assumed not to be depleted by the net uptake
ACPD
5, 2193–2246, 2005
Kinetic model framework for aerosols and clouds,
Part 2 M. Ammann and U. P ¨oschl Title Page Abstract Introduction Conclusions References Tables Figures J I J I Back Close
Full Screen / Esc
Print Version Interactive Discussion
into the condensed phase. Due to the relatively low uptake coefficients (γX1≤10−3) this assumption is very well justified for fine soot particles (particle diameters on the order of dp≈100 nm) interacting with ozone and similar low-molecular-mass photoxidants like OH, NO2, etc. (gas phase diffusion coefficients on the order of Dg,X1≈0.1 cm2s−1). In case of significant gas phase depletion, the influence of gas phase diffusion could be
5
described by the PRA gas phase correction factor Cg,X1 (PRA Sect. 2). Cg,X1 can be used in this as well as in all other model systems outlined below to account for gas phase diffusion effects and to relate [X1]gsto the average gas phase concentration of X1, [X1]g.
Figure 1a shows the surface concentrations of all involved chemical species and
10
the uptake coefficient γX1 as a function of time from one ms up to one day for sce-nario S1-1 ([X1]gs=2.5×1013cm−3). The initial plateau of γX1≈S0,X1=10−3 up to ∼1 s is determined by adsorption onto an essentially adsorbate free surface (θs≈0). The steep decrease of γX1 at ∼5 s is due to surface saturation with X1 (approach of quasi-steady-state surface concentration [X1]s≈5×1014cm−2), and the subsequent plateau
15
at ∼20 s and γX1≈4×10⁻⁶ is due to chemical reaction of X1 with the quasi-static layer consisting almost exclusively of Y1 (SLR1, [Y1]ss,ini≈[Y1]ss,ini=1×1014cm−2). The sec-ond steep decrease of γX1at ∼200 s is due to the depletion of Y1, and the subsequent plateau at ∼1000 s and γX1≈4×10⁻⁸ is due to chemical reaction of X1 with the quasi-static layer consisting almost exclusively of Y2 (SLR2, [Y2]ss≈[Y1]ss,ini=1×10
14
cm−2).
20
The third steep decrease of γX1 at ∼30 000 s is due to the depletion of Y2, and the subsequent plateau at ∼100 000 s and γX1≈4×10⁻¹⁰ is due to chemical reac-tion of X1 with the quasi-static layer consisting almost exclusively of Y3 (SLR3, [Y3]ss≈[Y1]ss,ini=1×1014cm−2).
Figure 1b shows the surface concentrations of all involved chemical species and
25
the uptake coefficient γX1 as a function of time from one ms up to one day for sce-nario S1-2 ([X1]gs=2.5×1011cm−3). The temporal evolution is analogous to Fig. 1a (scenario S1-1), but the substantially lower gas phase concentration of X1has the
fol-ACPD
5, 2193–2246, 2005
Kinetic model framework for aerosols and clouds,
Part 2 M. Ammann and U. P ¨oschl Title Page Abstract Introduction Conclusions References Tables Figures J I J I Back Close
Full Screen / Esc
Print Version Interactive Discussion
lowing consequences: (a) the plateaus of γX1 are more extended and the decreases are less steep (slower surface saturation and reactant depletion, respectively); (b) the plateau values of γX1corresponding to the different surface layer reactions are higher because the decrease of X1gas phase concentration and gas kinetic flux to the surface is much more pronounced than the corresponding decrease of X1 surface
concentra-5
tion and surface layer reaction rate (Langmuir adsorption effect). Similar non-linear gas phase concentration dependencies and effects of reversible adsorption followed by surface layer reactions (Langmuir-Hinshelwood reaction mechanisms) have already been outlined by Ammann et al. (2003) and will be further discussed in Sect. 3. They are particularly important when the gas phase and surface concentrations of volatile
10
species are high, i.e. when the (quasi-)steady-state surface coverage by adsorbate molecules is close to saturation (monolayer coverage).
Overall, Figs. 1a and b illustrate that the processes of adsorption and chemical re-action can transform the surface composition of solid particles (saturation of sorption layer and chemical aging of quasi-static surface layer), change the gas uptake coe
ffi-15
cient over several orders of magnitude, and exhibit non-linear gas phase concentration dependencies. They clearly demonstrate that the PRA framework formalism can be used to efficiently describe these processes and effects over time scales from millisec-onds to days. The time scales considered here are also covered by laboratory exper-iments ranging from seconds in flow reactors to days in large atmospheric simulation
20
chambers.
2.1.2. Model system Solid 2 (S2): adsorption and parallel surface layer reactions with particle components
Again we consider a trace gas X1, which undergoes reversible adsorption and irre-versible surface layer reactions on the surface of a solid particle, which initially consists
25
of two non-volatile components Y1and Y2. In this case X1can react in two parallel sur-face layer reactions, one of them converting Y1 into a volatile product, which desorbs immediately and do not interfere with the surface any further, while the other converts
ACPD
5, 2193–2246, 2005
Kinetic model framework for aerosols and clouds,
Part 2 M. Ammann and U. P ¨oschl Title Page Abstract Introduction Conclusions References Tables Figures J I J I Back Close
Full Screen / Esc
Print Version Interactive Discussion
Y1into the chemical derivative Y2: SLR1: X1(s)+ Y1(ss) → non-interfering products; SLR2: X1 (s) + Y2 (ss) → Y2 (ss). Surface-bulk transport processes as well as el-ementary gas-surface and surface bulk-reactions are again assumed to be negligible (Langmuir-Hinshelwood-type mechanism). Under these conditions, the general PRA surface mass balance and rate equations for X1and Y1are the same as above (model
5
system S1), except for Eq. (5), which has to be replaced by:
Lss,X1= kSLR1,X1,Y1[X1]s[Y1]ss+ kSLR2,X1,Y2[X1]s[Y2]ss (15) For the exemplary model simulations illustrated in Fig. 2a, the following input parameters have been used in the iterative integration: ωX1=3.6×104 cm s−1;
S0,X1=0.14; τd,X1=18 s; σX1=3×10⁻¹⁵ cm2, kSLR1,X1,Y1=7×10⁻¹⁸ cm2 s−1,
10
kSLR2,X1,Y2=8×10⁻¹⁹ cm2 s−1, [Y1]ss,ini=5×1014 cm−2, [Y2]ss,ini=1×1014 cm−2, [X1]gs=3×1011cm−3 (scenario S2-1) or 1×1012cm−3 (scenario S2-2). ωX1, S0,X1, τX1, and σX1 are based on experimental data for the adsorption and reaction of nitrogen dioxide (NO2) at the surface of soot particles on time scales of seconds to minutes in Knudsen cell experiments (Gerecke et al., 1998), an aerosol flow reactor experiment
15
(Ammann et al., 1998), and experiments, in which particles were deposited on filters for exposure to NO2 (Ammann et al., 1997). [Y1]ss,iniand [Y2]ss,inihave been constrained by the total yield of products observed in these experiments. S0,X1has been assumed to correspond to the low concentration limit of the initial uptake coefficient observed in the Knudsen cell experiments reported by Gerecke et al. (1998). kSLR1,X1,Y1 and
20
kSLR2,X1,Y2 have been adjusted to fit the experimental data from flow tube and filter exposure studies. The features of the temporal behaviour of the uptake coefficient are very similar to the example shown in Fig. 1. In this case, the slower, parallel surface layer reaction SLR2 weakens the decreasing slope at longer reaction times, becoming the dominant uptake pathway, once Y1is consumed.
25
Three more simulations are shown in Fig. 2b, in which S0,X1=0.01; τd,X1=0.1 s;
σX1=3×10⁻¹⁵ cm2, kSLR1,X1,Y1=3.5×10⁻¹⁶ cm2 s−1, kSLR2,X1,Y2=1×10⁻¹⁷ cm2 s−1, [Y1]ss,ini=1.2×1013 cm−2, [Y2]ss,ini=2.4×1014cm−2, [X1]gs=1×1011 cm−3 (scenario
S2-ACPD
5, 2193–2246, 2005
Kinetic model framework for aerosols and clouds,
Part 2 M. Ammann and U. P ¨oschl Title Page Abstract Introduction Conclusions References Tables Figures J I J I Back Close
Full Screen / Esc
Print Version Interactive Discussion
3), [X1]gs=3×1011 cm−3 (scenario S2-4) or 1×1012 cm−3 (scenario S2-5). These pa-rameters are based on experimental data for the adsorption and reaction of nitrogen dioxide (NO2) on diesel soot deposited on filters for exposure to NO2 (Arens et al., 2002). In this case, much less reactants were observed on the surface of this soot type, while the kinetics of the surface reaction is significantly faster than in the other
5
scenarios S2-1 and S2-2. The general features are similar to those in Fig. 2a, the long-term reactivity being even more dominated by the reaction with Y2 in the scenarios S2-3 to S2-5.
Many more laboratory studies on the subject of the NO2– soot reaction are available (Bedijanan et al., 2004, and references therein), and we are not attempting to discuss
10
all physico-chemical aspects of the methodologies and of the chemical reaction itself in detail, but rather to show the applicability of the PRA framework and the importance of considering long-enough time scales. The simulations demonstrate that the assump-tion of suitable microphysical and chemical mechanisms and rate parameters allows to reconcile short-term and long-term experimental results, which often appear to be
15
inconsistent at first sight. Moreover, they demonstrate the complexity induced into the system by just assuming two different reactants on the surface. It becomes strikingly obvious, that extensive parameter variations are necessary to reliably constrain all rel-evant parameters.
2.1.3. Model system Solid 3 (S3): adsorption and parallel surface layer reactions
20
including adsorbate self-reaction
In model system S3 a trace gas X1 undergoes reversible adsorption and irreversible surface layer reactions on the surface of a solid particle, which initially consists of the non-volatile component Y1. In this case X1can react in two parallel surface layer reac-tions, one of them converting Y1into the chemical derivative Y2, whereas the other one
25
is a self-reaction of X1leading to its decomposition into products which desorb immedi-ately and do not interfere with the surface any further (e.g. bath gas molecules): SLR1:
ACPD
5, 2193–2246, 2005
Kinetic model framework for aerosols and clouds,
Part 2 M. Ammann and U. P ¨oschl Title Page Abstract Introduction Conclusions References Tables Figures J I J I Back Close
Full Screen / Esc
Print Version Interactive Discussion
X1(s)+ Y1(ss) → Y2(ss); SLR2: X1(s)+ X1(s) → non-interfering products. Surface-bulk transport processes as well as elementary gas-surface and surface Surface-bulk-reactions are again assumed to be negligible (Langmuir-Hinshelwood-type mechanism). Under these conditions, the general PRA surface mass balance and rate equations for X1 and Y1are the same as above (model system S1), except for Eq. (3) which has to be
5
replaced by:
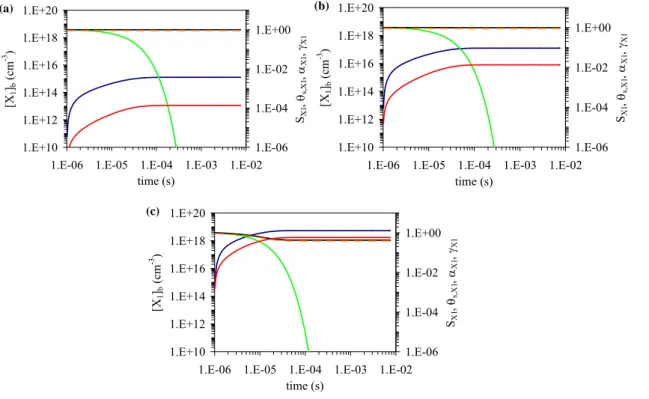
Ls,X1= kSLR1,X1,Y1[X1]s[Y1]ss+ kSLR2,X1,X1[X1]s[X1]s (16) For the exemplary model simulations illustrated in Fig. 3, the following input parameters have been used in the iterative integration: ωX1=3.6×104 cm s−1;
S0,X1=10−3; τd,X1=18 s; σX1=1.8×10⁻¹⁵ cm2, kSLR1,X1,Y1=1×10⁻¹⁹ cm2 s−1,
10
kSLR2,X1,X1=1×10⁻¹⁹cm2s−1, [Y1]ss,ini=1×1015cm−2, [X1]gs=2.5×1012cm−3(scenario S3-1) or 2.5×1013cm−3(scenario S3-2). ωX1, S0,X1, τX1, and σX1are based on exper-imental data for the adsorption of ozone at the surface of soot particles on time scales of seconds to minutes in Knudsen cell and flow tube studies (Stephens et al., 1986; Fendel et al., 1995; Rogaski et al., 1997; P ¨oschl et al., 2001; Sect. 2.1.1). [Y1]ss,ini
15
approximates the surface concentration of aromatic rings on a graphene layer (or large polycyclic aromatic hydrocarbon). kSLR1,X1,Y1 and kSLR2,X1,X1 have been adjusted to fit the experimental data for ozone uptake on soot over a time scale of hours in aerosol chamber studies (Kamm et al., 1999; Fig. 3). Experiments by Longfellow et al. (2000) suggest that the initial uptake coefficient (surface assommodation coefficient) and the
20
quasi-steady-state uptake coefficient at reaction times of 1–7 h may be as high as 10−2 and 10−4, respectively, for ozone uptake on fresh methane soot. These obser-vations could as well be simulated with the above model equations and different rate parameters or with a different set of reactions and equations more representative for the chemical composition and reactivity of the investigated surfaces. A
comprehen-25
sive analysis and consolidation of all available studies of ozone uptake on soot, the identification of specific surface properties responsible for the differences observed in different experiments performed with different types of soot, and the planning and
ACPD
5, 2193–2246, 2005
Kinetic model framework for aerosols and clouds,
Part 2 M. Ammann and U. P ¨oschl Title Page Abstract Introduction Conclusions References Tables Figures J I J I Back Close
Full Screen / Esc
Print Version Interactive Discussion
design of experiments (reaction conditions, time scales, etc.) for the development of consistent chemical mechanisms of soot surface reactions with ozone would go be-yond the scope of this paper. Nevertheless, the above model simulations illustrate the applicability and usefulness of the PRA framework for this aim, which we are planning to pursue in future studies.
5
2.2. Non-reactive gas uptake into liquid particles
2.2.1. Model system Liquid 1 (L1): adsorption and solubility saturation
In model system L1 a trace gas X1 undergoes reversible adsorption and surface-bulk transport (solvation and desolvation) onto and into a liquid droplet, but no chemical reactions. Under these conditions, the general PRA surface mass balance and rate
10
equations can be reduced to:
d[X1]s/dt= Jads,X1− Jdes,X1+ Jb,s,X1− Js,b,X1 (17) Js,b,X1= ks,b,X1[X1]s (18) Jb,s,X1= kb,s,X1[X1]bs (19) αX1= SX1 Js,b,X1 Js,b,X1+ Jdes,X1 (20) 15
The rate equations and parameters describing adsorption, desorption, and net uptake of X1are defined in the same way as in model system S1, Eqs. (10) to (14). Moreover, we assume that diffusion in the bulk liquid phase is fast and that the bulk phase is well mixed at all times, i.e. the near-surface bulk concentration and average bulk concen-tration of X1 are identical ([X1]bs=[X1]b). This is certainly the case for small particles
20
with diameters of about 100 nm or less and small molecules with diffusion coefficients, Db,X1, on the order of 10−5 cm2 s−1 or higher, leading to characteristic mixing times of dp2/(4π2)/Db,X1≈10−7s (Seinfeld and Pandis, 1998). Under these conditions, mass
ACPD
5, 2193–2246, 2005
Kinetic model framework for aerosols and clouds,
Part 2 M. Ammann and U. P ¨oschl Title Page Abstract Introduction Conclusions References Tables Figures J I J I Back Close
Full Screen / Esc
Print Version Interactive Discussion
balance for the bulk of a spherical particle (surface-to-volume ratio 6/dp) can simply be described by:
d[X1]b/dt = d[X1]bs/dt= (Js,b,X1− Jb,s,X1)(6/dp) (21) According to equations (PRA-72) and (PRA-73) the solubility saturation concentrations of X1in the gas phase and particle bulk ([X1]g,satand [X1]b,sat), and the gas-surface and
5
surface-bulk transport rate parameters of X1 under equilibrium conditions are related to its dimensionless gas-particle partitioning coefficient or solubility, Ksol,cc,X1:
Ksol,cc,X1 = [X1]b,sat [X1]g,sat = ks,b,X1 kb,s,X1 SX1ωX1 4kd,X1 (22)
At infinite dilution Ksol,cc,X1 equals the Henry’s law coefficient of X1 in the investigated condensed phase ([X1]b≈0, θS≈0, SXi≈S0,Xi, Ksol,cc,Xi≈Hcc,Xi; PRA Sect. 3.5.2). For
10
the exemplary model simulations illustrated in Figs. 4 to 6, the following input pa-rameters have been used in the iterative integration of Eqs. (17) and (21): S0,X1=1;
ωX1=3.1×104 cm s−1; σX1=1×10⁻¹⁴ cm2; [X1]s,ini=[X1]bs,ini=[X1]b,i ni=0, dp=100 nm. For τd,X1, ks,b,X1, kb,s,X1, and [X1]gs, which have been varied in scenarios L1-1 to L1-9, see Table 1.
15
The parameters for scenarios L1-1 to L1-3 are based on the experimental data re-ported by Jayne et al. (1990) for the uptake of sulfur dioxide into acidic aqueous solution droplets, assuming that the “surface complex” proposed in their study corresponds to an adsorbed molecule in the PRA framework. Here we assume that chemical reactions are negligible, which is reasonable for solutions sufficiently acidic to prevent significant
20
formation of sulfite from SO2. The data of Jayne et al. (1990) did not allow to fully constrain S0,X1, but they reported rate parameters equivalent to τd,X1and ks,b,X1for dif-ferent assumptions of S0,X1. For scenarios L1-1 to L1-3 we have set S0,X1to unity and used the corresponding values for τd,X1and ks,b,X1based on Jayne et al. (1990). Using Eq. (22), the bulk-to-surface transport rate constant kb,s,X1 for scenarios L1-1 to L1-3
25
ACPD
5, 2193–2246, 2005
Kinetic model framework for aerosols and clouds,
Part 2 M. Ammann and U. P ¨oschl Title Page Abstract Introduction Conclusions References Tables Figures J I J I Back Close
Full Screen / Esc
Print Version Interactive Discussion
corresponds to that of SO2at pH∼2 (Ksol,cp,X1=Hcp,X1=5 mol L−1 atm−1 for SXi=S0,X1). Here and below Henry’s law coefficient or solubilities in concentration and pressure units (index “cp”) have been converted into the corresponding dimensionless param-eters (index “cc”) by the relation Ksol,cc,X1=RT Ksol,cp,X1 (PRA Sect. 3.5.2). Note that this choice of parameters is not meant to pursue a specific investigation of SO2uptake
5
into aqueous droplets in this paper but just to establish a reasonable base case and starting point for the parameter variations in the different scenarios of model system L1 (Table 1). So far we have found no other published experimental data suitable to retrieve these basic rate parameters, although Dijkaev and Tabazadeh (2003) pointed out the potential importance of surface saturation effects on gas-particle partitioning,
10
in particular for organic surfactants.
In scenarios L1-4 to L1-6 and L1-7 to L1-9 (Table 1), τX1, ks,b,X1 and kb,s,X1 have been varied to simulate species with different adsorption properties and solu-bilities. The parameters have been adjusted to match the following Henry’s law co-efficients or solubilities at SX1=S0,X1: Hcp,X1=515 mol L−1 atm−1 (L1-4 to L1-6) and
15
Hcp,X1≈3.2×10⁶mol L−1atm−1 (L1-7 to L1-9), respectively.
Figure 4 shows the temporal evolution of the liquid phase bulk concentration [X1]b, sorption layer surface coverage θS, surface accommodation coefficient SX1, bulk ac-commodation coefficient αX1, and uptake coefficient γX1 for scenarios L1-1 to L1-3, respectively, in which [X1]gs is varied from 1×10¹¹ to 1×10¹⁵. In all scenarios except
20
L1-7 (Fig. 6a), solubility saturation equilibrium is achieved ([X]b=[X]b,sat) and γX1drops to zero within less than one millisecond. Moreover, αX1is significantly lower than SX1 because the rate of desorption is significantly higher than the rate of surface-to-bulk transport.
At low and moderate trace gas concentration levels (L1-1 and L1-2, Figs. 4a and
25
b), SX1 and αX1 are practically independent of time and [X1]gs, and also the temporal evolution of γX1 is essentially independent of [X1]gs. At high trace gas concentration (L1-3, Fig. 4c), however, SX1and αX1decrease from their initial values characteristic for
θS=0 to a lower value at equilibrium, which is due to surface saturation effects (θSclose 2207
ACPD
5, 2193–2246, 2005
Kinetic model framework for aerosols and clouds,
Part 2 M. Ammann and U. P ¨oschl Title Page Abstract Introduction Conclusions References Tables Figures J I J I Back Close
Full Screen / Esc
Print Version Interactive Discussion
to scenarios L1-4 to L1-6, which are analogous to L1-1 to L1-3 except that ks,b,X1was increased by a factor of 100 (Table 1). These parameters correspond to a Henry’s law coefficient a factor of 100 higher than for the base case, and thus solubility saturation is reached significantly later (after ∼1 ms for the lower concentration levels). Moreover, the increase of ks,b,X1makes the rate of surface-to-bulk transport substantially higher
5
than that of desorption, leading to a bulk accommodation coefficient just slightly lower than the surface accommodation coefficient.
In scenarios L1-7 to L1-9 (Fig. 6) τd,X1 was increased by almost five orders of mag-nitude whereas ks,b,X1and kb,s,X1have been reduced by about one order of magnitude, enhancing the Henry’s law coefficient by almost four orders of magnitude relative to
10
scenarios L1-4 to L1-6 (Table 1). These parameters represent a highly viscous particle interacting with a highly soluble gas with strong affinity to the surface, leading to very high saturation surface coverages (θS≈1) at all gas phase concentrations and very slow solubility saturation at low concentration (after ∼1 s in L1-7, Fig. 6a). Due to the high value of τd,X1 the rate of desorption is much lower than that of surface-to-bulk
15
transport, and αX1equals SX1at all times and concentration levels. Moreover, surface saturation effects and the decrease from initial to equilibrium values of SX1and αX1is particularly pronounced in L1-9 (Fig. 6c), which also clearly illustrates that SX1 limits both αX1and γX1(provided that gas-surface reactions are negligible; PRA Sect. 3.6).
Overall, the numerical simulations performed for model system L1 demonstrate that
20
adsorption and surface saturation effects (limitation of surface accommodation by sorp-tion layer capacity) can significantly influence αX1and SX1even in case of non-reactive uptake of highly soluble trace gases by liquid particles. The most important rate param-eters governing these effects are the desorption lifetime and the surface-to-bulk transfer rate coefficient. Besides the temporal evolution of gas uptake they also influence the
25
equilibrium values of solubility, especially at elevated trace gas concentrations.
In all scenarios except L1-7, equilibrium surface and bulk concentrations are largely established by 0.01 s (upper limit of time scale in Figs. 4–6). Due to the decrease of SX1 and αX1 at solubility saturation, however, the increase of [X1]b,sat is less than
ACPD
5, 2193–2246, 2005
Kinetic model framework for aerosols and clouds,
Part 2 M. Ammann and U. P ¨oschl Title Page Abstract Introduction Conclusions References Tables Figures J I J I Back Close
Full Screen / Esc
Print Version Interactive Discussion
proportional to that of [X1]g,satfrom L1-2 to L1-3 (Figs. 4b vs. c) and from L1-5 to L1-6 (Figs. 5b vs. c). From scenario L1-8 to scenario L1-9 (Figs. 6b vs. c; 0.01 s) almost no increase of the equilibrium bulk concentration is observed, in spite of the gas phase concentration increase by two orders of magnitude. These deviations from Henry’s law and non-linear dependencies of solubility on gas phase composition will be illustrated
5
and addressed in more detail below by exemplary calculations of Ksol,cp,X1as a function of S0,X1, kd,X1, ks,b,X1, kb,s,X1, and [Xi]gs(model system SS6, Sect. 3.6).
2.2.2. Model system Liquid 2 (L2): adsorption and bulk diffusion
Model system L2 is analogous to L1, except for considering large droplets where the gas uptake is influenced by liquid phase diffusion. Assuming that the particle bulk is
10
initially free of X1, the net transport flux of X1 from the surface to the near-surface particle bulk, Js,b,net,X1, can be matched with a quasi-steady-state dissolvo-diffusive flux of X1from the near-surface particle bulk towards the particle core, Jb,dd,X1 (analo-gous to the reacto-diffusive flux in systems with chemical reactions in the particle bulk; PRA Sect. 3.5.1), and approximated by (Finlayson-Pitts and Pitts, 2000; assumption of
15
quasi-planar surface geometry):
Js,b,net,X1= Js,b,X1− Jb,s,X1= Jb,dd,X1 = (Db,X1/(πt))1/2[X1]bs= ks,b,net,X1[X1]s (23) ks,b,net,X1= ks,b,X1 1+ kb,s,X1 q Db,X1/ (πt) −1 (24)
Equation (23) can be inserted for (Js,b,X1−Jb,s,X1) in Eq. (17) to describe the surface mass balance in model system L2 in analogy to model system L1. The ratio of the
20
near-surface bulk and surface concentrations of X1 can be obtained for quasi-steady
ACPD
5, 2193–2246, 2005
Kinetic model framework for aerosols and clouds,
Part 2 M. Ammann and U. P ¨oschl Title Page Abstract Introduction Conclusions References Tables Figures J I J I Back Close
Full Screen / Esc
Print Version Interactive Discussion
state conditions and in analogy to Eq. (PRA-69): [X1]bs [X1]s = ks,b,X1 kb,s,X1+ q Db,X1/ (πt) (25)
Much more elaborate formlisms for the description of time dependent diffusive transport in liquid droplets considering particle size and geometry are available (e.g., Hanson, 1995; Worsnop et al., 2002; Smith et al., 2003) and can be inserted into the PRA
frame-5
work (PRA Sect. 3.5). In the context of this paper, however, the simple approximations outlined above appear sufficient to demonstrate the potential effects of reversible ad-sorption and liquid phase diffusion on solubility saturation of large droplets.
For the exemplary model simulations illustrated in Figs. 7–9, the input parame-ters used in the iterative integration of Eq. (17) for scenarios L2-1 to L2-9 are the
10
same that have been used for scenarios L1-1 to L1-9, except for assuming a larger particle diameter (dp 100 nm): S0,X1=1; ωX1=3.1×104 cm s−1; σX1=1×10⁻¹⁴ cm2; [X1]s,ini=[X1]b,ini=0. For τX1, ks,b,X1, kb,s,X1, and [X1]gs, see Table 1. The particle is assumed to be large enough that the concentration of X1 in the particle core remains close to zero over the simulation time scale, justifying the simple form of the
dissolvo-15
diffusive flux introduced above and the use of Eq. (23) (Finlayson-Pitts and Pitts, 2000). For the liquid phase diffusion coefficient we have chosen the same value as used by Jayne et al. (1990) for SO2in acidic aqueous droplets, Db,X1=7.65×10⁻⁶ cm2 s−1. In scenarios L2-1 to L2-9 the near-surface bulk concentration of X1, [X1]bs, has been cal-culated iteratively using Eq. (25), based on the assumption of quasi-steady-state for
20
the near-surface bulk of the large particle, whereas in scenarios L1-1 to L1-9 the bulk concentration of X1, had been obtained by explicitly solving the bulk mass balance equation for a well-mixed small particle ([X1]b=[X1]bs).
Figures 7–9 (L2-1 to L2-9) are organized in analogy to Figs. 4–6 (L1-1 to L1-9), i.e. the scenario with the lowest gas phase concentration is displayed at the top (panel
25
a), followed by the corresponding scenarios with gas phase concentrations enhanced by factors of 100 (panels b and c; Table 1). Note, however, that Figs. 7–9 display the
ACPD
5, 2193–2246, 2005
Kinetic model framework for aerosols and clouds,
Part 2 M. Ammann and U. P ¨oschl Title Page Abstract Introduction Conclusions References Tables Figures J I J I Back Close
Full Screen / Esc
Print Version Interactive Discussion
near-surface bulk concentration of X1, while Figs. 4–6 display its bulk concentration. The temporal evolution and values of the sorption layer surface coverage θS, the surface accommodation coefficient SX1, and the bulk accommodation coefficient αX1 are very similar in the corresponding scenarios of model systems L2 and L1 (Figs. 7–9 and 4–6, respectively), which is due to the identical basic rate coefficients for the
pro-5
cesses governing surface mass balance and composition (S0,X1, τX1, ks,b,X1, kb,s,X1). The evolution of [X1]bs in scenarios L2-1 to L2-9 is also very similar to that of [X1]b in scenarios L1-1 to L1-9, i.e. solubility-driven gas uptake into the near-surface bulk of large particles proceeds essentially in the same way as the solubility saturation of small well-mixed particles (approaching Henry’s law equilibrium at long times and low
10
concentrations). At very short times up to 10−5-10−4s, the uptake coefficients γX1 of scenarios L2-1 to L2-9 also closely follow the temporal evolution of γX1 in scenarios L1-1 to L1-9. At the time scale of milliseconds (10−4–10−2s), however, where γX1 rapidly drops to zero for small particles due to solubility saturation (scenarios L1-1 to L1-9; Figs. 4–6), the net gas uptake into large particles continues and γX1exhibits only
15
a slow decrease proportional to (Db,X1t)−1/2 (scenarios L2-1 to L2-9; Figs. 7–9; liquid phase diffusion towards the particle core).
Overall, the initial non-linear increase of surface and near-surface bulk concentra-tions and the coincident decrease of the kinetic parameters SX1, αX1, γX1in both model systems and sets of scenarios (L2 and L1) are determined by adsorption and surface
20
saturation effects, whereas the establishment of constant equilibrium conditions at the end of the simulations for model system L1 and the continued gas uptake in the simu-lations for model system L2 are due to solubility saturation of the particle bulk (without or with limitation by liquid phase diffusion, respectively).
As mentioned above, the simulations L2-1 to L2-3 cover the conditions and time
25
scale of the droplet train experiments by Jayne et al. (1990). If we compare the uptake coefficient at 10−3s for the different gas phase concentrations, the numerical simula-tions predict a drop of γX1by a factor of ∼2 from L2-2 to L2-3 (Figs. 7b and c, respec-tively). This drop is consistent with the drop observed in the experiments by Jayne et
ACPD
5, 2193–2246, 2005
Kinetic model framework for aerosols and clouds,
Part 2 M. Ammann and U. P ¨oschl Title Page Abstract Introduction Conclusions References Tables Figures J I J I Back Close
Full Screen / Esc
Print Version Interactive Discussion
al. (1990), when the gas phase concentration was changed from 1013to 1015cm−3.
3. Gas phase concentration dependencies under steady-state conditions
Reversible and competitive adsorption on a quasi-static surface implies that the sur-face accommodation coefficient of every species Xidecreases with increasing surface concentration and thus with increasing gas phase concentration of all competitively
co-5
adsorbing species. Consequently, all kinetic parameters proportional to SXi, including bulk accommodation and sorption uptake coefficients (αXiand γsor,Xi, respectively) will also exhibit a dependence on gas phase composition, which can only be neglected when the total sorption layer surface coverage is much less than unity (θs 1; PRA Sect. 4.3.1).
10
To illustrate characteristic effects of gas phase concentrations and basic rate pa-rameters on surface concentrations, surface and bulk mass accommodation coe ffi-cients, and uptake coefficients of trace gases under (quasi-)steady-state conditions, we present exemplary simulations based on PRA Sect. 4.3.1 (adsorption-reaction steady-state, Special Case B) for selected model systems and scenarios. Steady-state
con-15
ditions are not only highly relevant for the determination of basic rate coefficients in laboratory experiments with aerosol and cloud model systems, quasi-steady-state con-ditions also do occur in the temporal evolution of real time-dependent systems. For example, such conditions are illustrated by the plateau values of near-constant uptake coefficients in the model systems and scenarios of the preceding section.
20
Model system Steady-State 1 (SS1) demonstrates the coupling of gas-surface trans-port (adsorption), surface-bulk transtrans-port (solvation), and chemical reaction at the sur-face, and the application of effective adsorption equilibrium constants, which are ex-pected to be relevant in particular for highly reactive trace gas species and highly vis-cous or solid particles. Model system Steady-State 2 (SS2) illustrates the interaction
25
of multiple competitively adsorbing species at the surface. Model system Steady-State 3 and 4 (SS3 and SS4) show differences between trace gas reactions at the surface
ACPD
5, 2193–2246, 2005
Kinetic model framework for aerosols and clouds,
Part 2 M. Ammann and U. P ¨oschl Title Page Abstract Introduction Conclusions References Tables Figures J I J I Back Close
Full Screen / Esc
Print Version Interactive Discussion
following Langmuir-Hinshelwood and Eley-Rideal mechanisms, respectively. Model systems Steady-State 5 and 6 (SS5 and SS6) illustrate effects of reversible adsorp-tion on gas uptake, which is purely solubility-driven (only gas-surface and surface-bulk transport, no chemical reactions).
3.1. Model system Steady-State 1 (SS1): adsorption, surface layer reaction with
par-5
ticle components, and surface-bulk transport
In model system SS1, we consider a trace gas X1, which undergoes reversible adsorp-tion (gas-surface transport), surface-bulk transport, and a surface layer reacadsorp-tion (SLR1: X1(s)+ Y1(s) → products) under (quasi-)steady-state conditions. In this case the PRA adsorption-reaction steady-state equations (PRA Sect. 4.3.1, Special Case B) for the
10
effective Langmuir adsorption equilibrium constant Kads,X10 , pseudo-first-order surface reaction rate coefficient ks,X1, sorption layer surface coverage θS, surface accommo-dation coefficient SX1, bulk accommodation coefficient αX1, and uptake coefficient γX1 can be reduced to:
Kads,X10 = S0,X1 σX1ωX1 4(kd,X1+ ks,X1+ ks,b,net,X1) (26) 15 ks,X1= kSLR1,X1,Y1[Y1]ss (27) θs = K 0 ads,X1[X1]gs 1+ Kads,X10 [X1]gs (28) SX1= S0,X1(1 − θs)= S0,X1 1+ Kads,X10 [X1]gs (29) αX1= SX1 ks,b,X1 ks,b,X1+ ks,X1+ kd,X1 (30) 2213
ACPD
5, 2193–2246, 2005
Kinetic model framework for aerosols and clouds,
Part 2 M. Ammann and U. P ¨oschl Title Page Abstract Introduction Conclusions References Tables Figures J I J I Back Close
Full Screen / Esc
Print Version Interactive Discussion
γX1= γsor,X1= SX1ks,X1+ ks,b,net,X1
kd,X1 (31)
For the exemplary model simulations illustrated in Fig. 10, the following in-put parameters have been used: S0,X1=10−3; ωX1=3.6×104 cm s−1; τX1=18 s and kd,X1=5.6×10⁻² s−1; σX1=1.8×10⁻¹⁵ cm2; kSLR1,X1,Y1=2×10⁻¹⁷ cm2 s−1; [Y1]ss=1×1014 cm−2. ks,b,net,X1was set equal to zero (scenario SS1-1), to ks,X1
(SS1-5
2), to kd,X1(SS1-3), and to multiples of 102and 104of kd,X1(SS1-4 and SS1-5); ks,b,X1 was set to 4×ks,b,net,X1. A listing of the parameter values and resulting effective adsorp-tion equilibrium constants Kads,X10 is given in Table 2. [X1]gs was varied from 109 cm−3 to 1015 cm−3, corresponding to volume mixing ratios of about 100 ppt to 100 ppm at ambient temperature and pressure.
10
ωX1, S0,X1, τX1, σX1, and kSLR1,X1,Y1 are based on the values reported by P ¨oschl et al. (2001) for the interaction of ozone with the polycyclic aromatic hydrocarbon benzo[a]pyrene on soot. The other values have been chosen to illustrate characteristic parameter dependencies and the differences between systems dominated by surface processes (SS1-1, solid particles), influenced by surface and bulk processes (SS1-2
15
to SS1-4; liquid particles with high viscosity and/or high surface reactivity), or domi-nated by bulk processes (SS1-5; liquid particles with low viscosity and/or low surface reactivity).
Figures 10a–d display θS, SX1, αX1, and γX1 as a function of gas phase concen-tration for the five scenarios SS1-1 to SS1-5 with different (net) surface-to-bulk mass
20
transport rate coefficients and effective adsorption equilibrium constants (Table 2). In all scenarios θS,X1 increases near-linearly with [X1]gs while SX1, αX1, and γX1 are in-dependent of [X1]gs as long as [X1]gs 1/Kads,X10 . At [X1]gs≈1/Kads,X10 the effects of reversible and competitive adsorption inhibit the increase of θS with [X1]gs (character-istic shape of Langmuir isotherm), and induce a decrease of SX1, αX1, and γX1 with
25
[X1]gs. At [X1]gs 1/Kads,X10 the sorption layer surface coverage approaches unity, lead-ing to a steep decrease of SX1, αX1, and γX1with [X1]gs(near-constant fluxes of surface
ACPD
5, 2193–2246, 2005
Kinetic model framework for aerosols and clouds,
Part 2 M. Ammann and U. P ¨oschl Title Page Abstract Introduction Conclusions References Tables Figures J I J I Back Close
Full Screen / Esc
Print Version Interactive Discussion
layer reaction and surface-to-bulk transport vs. linear increase of gas kinetic flux to the surface).
Scenario SS1-1 (blue lines in Figs. 10a–d) corresponds to a simple Langmuir-Hinshelwood-type reaction mechanism, as discussed in model systems S1-S3 and by Ammann et al. (2003). It exhibits the strongest gas phase concentration dependency,
5
the earliest onset of surface saturation and reduction of SX1, the lowest values of γX1, and αX1=0. In scenarios SS1-2 to SS1-4 the increase of ks,b,X1and ks,b,net,X1and the decrease of Kads,X10 , respectively, move the onset of surface saturation towards higher [X1]gs, and the values of αX1 and γX1 approach SX1 as an upper limit. In scenario SS1-5 (black lines in Figs. 10a–d) the sorption layer surface coverage remains far
be-10
low unity even at high gas phase concentration, and SX1=αX1=γX1are independent of [X1]gs. Under these conditions the gas-particle interactions are dominated by bulk pro-cesses, and the bulk accommodation coefficient convoluting surface accommodation and surface-bulk transport is suitable to describe the overall gas uptake.
3.2. Model system Steady-State 2 (SS2): competitive co-adsorption and surface layer
15
reaction with particle components
Model system SS2 is analogous to SS1, except that no surface-bulk transport of X1 is considered here. Instead, a second trace gas X2 competitively co-adsorbs to the surface. X2 is assumed to be non-reactive, and to undergo no surface-bulk trans-port either. In this case the PRA adsorption-reaction steady-state equations (PRA
20
Sect. 4.3.1, Special Case B) can be reduced to:
Kads,X10 = S0,X1 σX1ωX1
4(kd,X1+ ks,X1) (32)
Kads,X20 = S0,X2σX2ωX2
4kd,X2 (33)
ACPD
5, 2193–2246, 2005
Kinetic model framework for aerosols and clouds,
Part 2 M. Ammann and U. P ¨oschl Title Page Abstract Introduction Conclusions References Tables Figures J I J I Back Close
Full Screen / Esc
Print Version Interactive Discussion θs,X1 = K 0 ads,X1[X1]gs 1+ Kads,X10 [X1]gs+ Kads,X20 [X2]gs (34) θs = K 0 ads,X1[X1]gs+ K 0 ads,X2[X2]gs 1+ Kads,X10 [X1]gs+ Kads,X20 [X2]gs (35) SX1= S0,X1 1+ Kads,X10 [X1]gs+ Kads,X20 [X2]gs (36) ks,X1= kSLR1,X1,Y1[Y1]ss (37) γX1= γsor,X1= SX1ks,X1 kd,X1 (38) 5
θS,X1 represents the fractional surface coverage of X1 (θS,X1=σX1 [X1]s), whereas θS is the total sorption layer surface coverage (θS=σX1 [X1]s+σX2 [X2]s). For the exem-plary model simulations based on Eqs. (32)–(38) and illustrated in Fig. 11, the input parameters for X1have been the same as in scenario SS1-1 (Kads,X10 =2.7×10⁻¹³cm3). Except for its non-reactivity, X2 was assumed to have the same properties as X1
10
(Kads,X2=Kads,X20 =2.8×10⁻¹³ cm3). In scenarios SS2-1 to SS2-5 the gas phase con-centration of X2, [X2]gs, was set to 0, 2.5×1012 cm3, 2.5×1013 cm3, 2.5×1014 cm3, or 2.5×1015cm3, respectively (corresponding to about 0.1–100 ppm at ambient tempera-ture and pressure).
Figures 11a–d display θS, θS,X1, SX1, and γX1 as a function of gas phase
15
concentration for the five scenarios SS2-1 to SS2-5. In all scenarios θS,X1 in-creases near-linearly with [X1]gs while SX1 and γX1 are independent of [X1]gs as long as [X1]gs 1/Kads,X10 +[X2]gs Kads,X20 /KX10 (θS,X1 1). At [X1]gs ≈1/Kads,X10 + [X2]gsKads,X20 /Kads,X10 , the effects of reversible and competitive adsorption of X1
ACPD
5, 2193–2246, 2005
Kinetic model framework for aerosols and clouds,
Part 2 M. Ammann and U. P ¨oschl Title Page Abstract Introduction Conclusions References Tables Figures J I J I Back Close
Full Screen / Esc
Print Version Interactive Discussion
inhibit the further increase of θS,X1 with [X1]gs (characteristic shape of Lang-muir isotherm), and induce a decrease of SX1 and γX1 with [X1]gs. At [X1]gs 1/Kads,X10 +[X2]gsKads,X20 /Kads,X10 , the fractional surface coverage by X1 ap-proaches unity, leading to a steep decrease of SX1 and γX1 with [X1]gs (near-constant flux of surface layer reaction vs. linear increase of gas kinetic flux to the surface).
5
Scenario SS2-1 (blue lines in Figs. 11a–d; [X2]gs=0) is identical with scenario SS1-1 (Fig. SS1-10) and exhibits the same features as discussed in Sect. 3.SS1-1. In scenarios SS1-2 to SS1-5 the increase of [X2]gsenhances the total sorption layer coverage, θS, and and significantly decreases SX1, θS,X1, and γX1 for X1 gas phase concentrations up to [X1]gs≈1/Kads,X10 +[X2]gsKads,X20 /Kads,X10 . At [X1]gs 1/Kads,X10 +[X2]gsKads,X20 /Kads,X10 ,
10
the values of SX1and γX1become independent of [X2]gs(θSdominated by X1).
The outlined effects of competitive co-adsorption are consistent with the experi-mental data reported by P ¨oschl et al. (2001) for H2O and O3 interacting with soot aerosol particles (Kads,H2O0 Kads,O30 ), and more recent observations for NO2 and O3 (Kads,NO20 ≈Kads,O30 ; publication of measurement data in preparation; preliminary results
15
reported by P ¨oschl, 2002, and Schauer et al., 2004).
3.3. Model system Steady-State 3 (SS3): competitive co-adsorption and surface layer self-reaction of adsorbate molecules (Langmuir-Hinshelwood mechanism) Model system SS3 is analogous to SS2, except that X1undergoes self-reaction rather than reaction with quasi-static surface components. The self-reaction of X1is assumed
20
to proceed exclusively via a surface layer reaction (Langmuir-Hinshelwood mechanism; SLR1: X1(s) + X1(s) → products). The reaction products are assumed to be non-reactive and to have very low effective adsorption equilibrium constants, i.e. negligible influence on the surface concentrations of X1 and X2 and on the total sorption layer coverage. The overall process can be viewed as heterogeneous catalysis of X1
decom-25
position by self-reaction. In this case the same set of equations as in model system SS2 are applicable, except that the pseudo-first-order surface reaction rate coefficient
ACPD
5, 2193–2246, 2005
Kinetic model framework for aerosols and clouds,
Part 2 M. Ammann and U. P ¨oschl Title Page Abstract Introduction Conclusions References Tables Figures J I J I Back Close
Full Screen / Esc
Print Version Interactive Discussion
is given by
ks,X1= kSLR1,X1,X1[X1]s (39)
For the exemplary model simulations illustrated in Fig. 12, the input parameters for X1 and X2 have been the same as in scenarios SS1-1 and SS2-1, except the replacement of kSLR1,X1,Y1 by the surface layer self-reaction rate coefficient
5
kSLR1,X1,X1=2×10⁻¹⁷cm2s−1. In scenarios SS3-1 to SS3-5, the gas phase concentra-tion of X2, [X2]gs, was again set to 0, 2.5×1012 cm3, 2.5×1013 cm3, 2.5×1014 cm3, or 2.5×1015 cm3, respectively.
Figures 12a–d display θS,X1, θS, SX1, and γX1 as a function of gas phase concentration for the five scenarios SS3-1 to SS3-5. In all scenarios, θS,X1
10
and γX1 increase near-linearly with [X1]gs while SX1 is independent of [X1]gs as long as [X1]gs 1/Kads,X10 +[X2]gs Kads,X20 /Kads,X10 (θS,X1 1). At [X1]gs≈1/Kads,X10 + [X2]gsKads,X20 /Kads,X10 , the effects of reversible and competitive adsorption of X1 inhibit the further increase of θS,X1 with [X1]gs (characteristic shape of Langmuir isotherm), and lead to a decrease of SX1 and to a maximum of γX1 (maximum ratio between
15
the fluxes of surface reaction and surface collisions). At [X1]gs 1/Kads,X10 +[X2]gs
Kads,X20 /Kads,X10 the fractional surface coverage by X1 approaches unity, leading to a steep decrease of SX1 and γX1 with [X1]gs (near-constant flux of surface layer self-reaction vs. linear increase of gas kinetic flux to the surface).
The main feature differentiating SS3 from SS2 is the increase of γX1with increasing
20
[X1]gs at low concentration levels, which is due to the increasing rate of surface layer self-reaction with increasing surface coverage by X1 (second-order dependence on [X1]gs). At high concentration levels the surface is saturated with X1, and SX1 as well as γX1 decrease with further increasing [X1]gs in analogy to model system SS2 and SS1 (Figs. 10 and 11).
25
Scenario SS3-1 (blue lines in Figs. 12a–d, [X2]gs=0) exhibits the highest values of θS,X1, SX1, and γX1 and the lowest values of θS. In scenarios 2 to SS3-5 the increase of [X2]gs enhances the total sorption layer coverage, θS, and
![Fig. 1. Temporal evolution of particle surface composition and gas uptake coefficient in model system S1 (adsorption and sequential surface layer reactions): scenario S1-1 with [X 1 ] gs =2.5×10 13 cm −3 (a) and scenario S1-2 with [X 1 ] gs =2.5×10 11 cm −](https://thumb-eu.123doks.com/thumbv2/123doknet/14775992.593768/41.918.64.650.206.379/temporal-evolution-particle-composition-coefficient-adsorption-sequential-reactions.webp)
![Figure 3: Temporal evolution of particle surface composition and gas uptake coefficient in model system S3 (adsorption and parallel surface layer reactions including adsorbate self-reaction): scenario S3-1 with [X 1 ] gs = 2.5×10 13 cm -3 and scenar](https://thumb-eu.123doks.com/thumbv2/123doknet/14775992.593768/42.918.58.655.154.334/temporal-evolution-composition-coefficient-adsorption-reactions-including-adsorbate.webp)
![Figure 3: Temporal evolution of particle surface composition and gas uptake coefficient in model system S3 (adsorption and parallel surface layer reactions including adsorbate self-reaction): scenario S3-1 with [X 1 ] gs = 2.5×10 13 cm -3 and scenar](https://thumb-eu.123doks.com/thumbv2/123doknet/14775992.593768/43.918.99.604.142.429/temporal-evolution-composition-coefficient-adsorption-reactions-including-adsorbate.webp)