HAL Id: hal-00302151
https://hal.archives-ouvertes.fr/hal-00302151
Submitted on 26 Sep 2006HAL is a multi-disciplinary open access
archive for the deposit and dissemination of sci-entific research documents, whether they are pub-lished or not. The documents may come from teaching and research institutions in France or abroad, or from public or private research centers.
L’archive ouverte pluridisciplinaire HAL, est destinée au dépôt et à la diffusion de documents scientifiques de niveau recherche, publiés ou non, émanant des établissements d’enseignement et de recherche français ou étrangers, des laboratoires publics ou privés.
Aerosol-cloud interaction inferred from MODIS satellite
data and global aerosol models
G. Myhre, F. Stordal, M. Johnsrud, Y. J. Kaufman, D. Rosenfeld, T.
Storelvmo, J. E. Kristjansson, T. K. Berntsen, A. Myhre, I.S.A. Isaksen
To cite this version:
G. Myhre, F. Stordal, M. Johnsrud, Y. J. Kaufman, D. Rosenfeld, et al.. Aerosol-cloud interaction inferred from MODIS satellite data and global aerosol models. Atmospheric Chemistry and Physics Discussions, European Geosciences Union, 2006, 6 (5), pp.9351-9388. �hal-00302151�
ACPD
6, 9351–9388, 2006
Aerosol-cloud interaction inferred
from MODIS and models G. Myhre et al. Title Page Abstract Introduction Conclusions References Tables Figures J I J I Back Close
Full Screen / Esc
Printer-friendly Version Interactive Discussion
Atmos. Chem. Phys. Discuss., 6, 9351–9388, 2006 www.atmos-chem-phys-discuss.net/6/9351/2006/ © Author(s) 2006. This work is licensed
under a Creative Commons License.
Atmospheric Chemistry and Physics Discussions
Aerosol-cloud interaction inferred from
MODIS satellite data and global aerosol
models
G. Myhre1,2,3, F. Stordal1,2, M. Johnsrud2, Y. J. Kaufman4, D. Rosenfeld5, T. Storelvmo1, J. E. Kristjansson1, T. K. Berntsen1,3, A. Myhre6, and I. S. A. Isaksen1
1
Department of Geosciences, University of Oslo, Norway
2
Norwegian Institute for Air Research, 2027 Kjeller, Norway
3
Center for International Climate and Environmental Research – Oslo, 0318 Oslo, Norway
4
NASA Goddard Space Flight Center, Greenbelt Maryland 20771, USA
5
Institute of Earth Sciences, The Hebrew University of Jerusalem, Jerusalem 91904, Israel
6
Telemark University College, Bø, Norway
Received: 13 June 2006 – Accepted: 13 September 2006 – Published: 26 September 2006 Correspondence to: G. Myhre ([email protected])
ACPD
6, 9351–9388, 2006
Aerosol-cloud interaction inferred
from MODIS and models G. Myhre et al. Title Page Abstract Introduction Conclusions References Tables Figures J I J I Back Close
Full Screen / Esc
Printer-friendly Version Interactive Discussion
Abstract
We have used the Modis satellite data and two global aerosol models to investigate relationships between aerosol optical depth (AOD) and cloud parameters that may be affected by the aerosol concentration. The relationships that are studied are mainly be-tween AOD on the one hand and cloud cover, cloud liquid water path, and water vapour 5
on the other. Additionally, cloud droplet effective radius, cloud optical depth, cloud top pressure and aerosol ˚Angstr ¨om exponent, have been analysed in a few cases. In the Modis data we found as in earlier studies an enhancement in the cloud cover with in-creasing AOD. We find it likely that most of the strong increase in cloud cover with AOD, at least for AOD<0.2, is a result of aerosol-cloud interactions and prolonged cloud life-10
time. Meteorology seems not to be a cause for the increase in cloud cover with AOD in this range. When water uptake of the aerosols is not taken into account in the models the modelled cloud cover actually decreases with AOD. Part of the relationship found in the Modis data for AOD>0.2 can be explained by larger water uptake close to clouds since relative humidity is higher in regions with higher cloud cover. The efficiency of the 15
hygroscopic growth depends on aerosol type, hygroscopic nature of the aerosol, the relative humidity, and to some extent the cloud screening. By analysing the ˚Angstr ¨om exponent we find that the hygroscopic growth of the aerosol is not likely to be a main contributor to the cloud cover increase with AOD. Since the largest increase in cloud cover with AOD is for low AOD (∼0.2) and thus also for low cloud cover, cloud con-20
tamination is not likely to play a large role. However, interpretation of the complex relationships between AOD and cloud parameters should be made with great care and further work is clearly needed.
1 Introduction
Aerosols are known to impact the formation and the life cycle of clouds. A wide range 25
prop-ACPD
6, 9351–9388, 2006
Aerosol-cloud interaction inferred
from MODIS and models G. Myhre et al. Title Page Abstract Introduction Conclusions References Tables Figures J I J I Back Close
Full Screen / Esc
Printer-friendly Version Interactive Discussion
erties (Ackerman et al., 2000; Andreae et al., 2004; Kaufman et al., 2005a; Kim et al., 2003; Koren et al., 2004, 2005; Penner et al., 2004; Ramanathan et al., 2001; Rosenfeld, 2000; Rosenfeld et al., 2002; Schwartz et al., 2002). It is important to understand and quantify the microphysical impact of both natural and anthropogenic aerosols on clouds, in order to understand and predict climate change (Anderson et 5
al., 2003; Forest et al., 2002; Knutti et al., 2002). It is natural to seek information of aerosol-cloud interactions in observations. However, this is not straightforward, as aerosols and clouds are related also in ways other than through microphysics, most notably by both depending on meteorological conditions.
The identified aerosol indirect effects are several, complex and interlinked. An in-10
crease in the number of cloud condensation nuclei from anthropogenic aerosols yields an enhanced number of water cloud droplets with reduced sizes (Breon et al., 2002; Feingold et al., 2003; Kaufman and Fraser, 1997; Twomey, 1977) for similar liquid water path (LWP), resulting in increased cloud optical thickness. This cloud albedo effect is seen in various measurements of clouds but early experimental measurements for 50 15
years ago also showed that the size of newly formed cloud droplets was dependent on the aerosol concentration (Gunn and Phillips, 1957). The reduction in cloud droplet size inhibits precipitation (Albrecht, 1989; Rosenfeld, 1999, 2000), the cloud lifetime increases and the clouds can evolve to an increased cloud top height (Andreae et al., 2004; Khain et al., 2005; Williams et al., 2002) with an increased LWP. Aerosols may 20
thus lead to an increase in cloud optical thickness due to a combination of reduction in cloud droplet radius and increased water content. Lately the semi-direct aerosol effect of inhibition of cloud formation has attracted large attention (Ackerman et al., 2000; Cook and Highwood, 2004; Johnson et al., 2004; Kaufman et al., 2002; Koren et al., 2004; Menon et al., 2002; Ramanathan et al., 2001). It has potentially a strong impact 25
on the radiative balance, but is also very sensitive to the vertical distribution of aerosols and clouds (Johnson et al., 2004; Penner et al., 2003). There have been some pioneer-ing studies of ice clouds (see Lohmann and Feichter, 2005) showpioneer-ing potential for an-thropogenic influence on the number of ice nuclei. Estimates of the anan-thropogenic
ACPD
6, 9351–9388, 2006
Aerosol-cloud interaction inferred
from MODIS and models G. Myhre et al. Title Page Abstract Introduction Conclusions References Tables Figures J I J I Back Close
Full Screen / Esc
Printer-friendly Version Interactive Discussion
tion of aerosols are available from models (http://nansen.ipsl.jussieu.fr/AEROCOM/) as well as from advanced aerosol retrievals based on dedicated satellite instruments for aerosol studies (Kaufman et al., 2005b)
Observations show an increase in cloudiness at several locations in the early part of last century and often a decrease in the last decades (Houghton, 2001; Karl and 5
Steurer, 1990; Norris, 1999; Sun and Groisman, 2004; Tuomenvirta et al., 2000). A natural question is whether this is a coincidence or a result of aerosols prolonging the lifetime of clouds by suppression of precipitation since there has been a strong increase in the anthropogenic aerosols up to late 1980s. Later there has been more geograph-ical variation in trends in anthropogenic emissions of aerosols and precursors. Some 10
studies show a strong increase in cloud fraction as a function of AOD based on satellite data (Kaufman et al., 2005a; Koren et al., 2005; Rosenfeld et al., 2006; Sekiguchi et al., 2003). Rosenfeld et al. (2006) find that by suppression of precipitation aerosols can convert the cloud structure from open to closed Benard cells and thus increasing the cloud cover. This increase in cloud cover due to aerosols is largest for situations with 15
relatively small amount of aerosols. Lohmann et al. (2006) find that the aerosol indirect effect in simulations with a global climate model has the largest impact on the cloud water rather than the cloud fraction. This model study indicates that the cloud fraction increase is influenced more by meteorological factors than the aerosol indirect effect.
Several possibilities exist for aerosols and clouds to be interlinked through processes 20
other than physical aerosol-cloud interactions. One possibility is that meteorological situations with clouds nearby influence the AOD. Relative humidity increases the AOD due to more water uptake by the particles. Since relative humidity is usually higher in the vicinity of clouds than in completely clear sky regions an increase in cloud fraction with AOD may be strongly influenced by this effect. Further, larger scale meteorological 25
conditions may influence both AOD and cloud parameters and it is not intuitive to which extent and even in which direction this will impact the AOD – cloud relationships. Two examples illustrate this; 1) sea salt particles are generated under windy conditions, e.g. during frontal passages, when clouds are frequent 2) over industrialized regions
ACPD
6, 9351–9388, 2006
Aerosol-cloud interaction inferred
from MODIS and models G. Myhre et al. Title Page Abstract Introduction Conclusions References Tables Figures J I J I Back Close
Full Screen / Esc
Printer-friendly Version Interactive Discussion
high pressure systems with weak winds will normally allow aerosol to build up, but in this case clear sky conditions are most usual. Finally, cloud contamination in the AOD retrieval may be a problem causing an apparent increase in cloud fraction with AOD (Kaufman et al., 2005c; Zhang et al., 2005).
In this work we establish relationships between AOD and cloud parameters from 5
MODIS. In an attempt to isolate impacts of common meteorological influence such relationships have also been studied in two global aerosol models. The two global models are completely independent and are driven by quite different meteorologies. In one of the models (Oslo CTM2) assimilated meteorological fields from ECMWF are used whereas the other model is a GCM (CAM-Oslo) driving its own meteorology. 10
Three parameters have been chosen to investigate impacts of aerosols on clouds; namely cloud cover, water vapour, and liquid water path. All these parameters may be influenced by the “suppression of precipitation effect/second aerosol effect” as well as the semi-direct effect.
Little attention has been given to how water vapour is affected by aerosol-cloud in-15
teraction. Suppression of precipitation and prolonged lifetime of clouds may lead to more evaporation of clouds and thus more water vapour. However, also higher rainfall under certain circumstances with high aerosol abundance has been identified (Khain et al., 2005). This could lead to reduced water vapour. Also the semi-direct effect with absorbing aerosols causing evaporation and inhibition of cloud formation may lead to 20
more water vapour. On the other hand, water vapour abundance is important with re-spect to the speed of the hydrological cycle. An increase (or decrease) of the water vapour as a result of aerosol-cloud interaction will result in a slower (faster) hydrological cycle under conditions with no change in the surface evaporation.
In the two models used here aerosol-cloud interactions are not included and coupling 25
between aerosols and heating or cooling of the atmosphere is not incorporated. Thus output from the models is used in an attempt to identify relationships between AOD and the cloud parameters in the Modis data which could be related to meteorological conditions rather than physical aerosol-cloud interactions. We will specifically
ACPD
6, 9351–9388, 2006
Aerosol-cloud interaction inferred
from MODIS and models G. Myhre et al. Title Page Abstract Introduction Conclusions References Tables Figures J I J I Back Close
Full Screen / Esc
Printer-friendly Version Interactive Discussion
gate how relative humidity and thus water uptake influences the results. Other cloud parameters that may be influenced by the cloud albedo effect, such as effective radius and cloud optical depth, have also been included in our analyses to some extent.
2 Data and experimental design
The purpose of this study is to investigate and possibly quantify relations between 5
aerosols and clouds. Aerosols and clouds interact strongly in microphysical processes. This interaction depends on meteorological conditions. On the other hand distribu-tions and properties of aerosols and clouds are both influenced by other factors, most notably meteorology. Analyses of MODIS data on aerosols and clouds are a back bone in the present investigation. However, we also include results from models which 10
do not include explicit microphysical interaction between aerosols and clouds in an attempt to isolate such interaction. We use the Oslo CTM2 aerosol model, where aerosol transport (and in some cases aerosol production) is based on, and thus com-patible with, assimilated meteorological fields from ECMWF. The aerosols in the Oslo CTM2 model have technically no microphysical impact on the clouds in the ECMWF 15
product. However, the ECMWF clouds may still be influenced by aerosol cloud micro-physics (e.g. from the suppression of precipitation effect or semi-direct effect) through the ECMWF assimilation. Even microphysical impact of aerosols on clouds could thus be inherent in the assimilated data. Therefore we have also included in our study a model (an atmospheric climate model) without any aerosol influence on the clouds. 20
2.1 Modis
Data from the Modis instrument aboard the Terra satellite (launched December 1999) and Aqua (launched May 2002) for aerosols and cloud parameters are used. The aerosol retrieval is different over land (Kaufman et al., 1997) and ocean (Tanr´e et al., 1997) and with updated information on the retrievals and results from validations in 25
ACPD
6, 9351–9388, 2006
Aerosol-cloud interaction inferred
from MODIS and models G. Myhre et al. Title Page Abstract Introduction Conclusions References Tables Figures J I J I Back Close
Full Screen / Esc
Printer-friendly Version Interactive Discussion
Remer et al. (2005). The retrievals for the cloud parameters studied are described in Platnick et al. (2003). Data for 2001 (from the Terra satellite) is mostly used, unless otherwise stated. In some analyses data for 5 years from Terra and 2 years from Aqua are used. For water vapour the retrieval for the near infrared region is adopted. We have used the daily level 3 product with 1×1 degree spatial resolution.
5
2.2 Oslo CTM2
This is an off-line chemical-aerosol-transport model that is driven with meteorological data from ECMWF (Berglen et al., 2004). The meteorological input data have been generated by running the Integrated Forecast System (IFS) model at ECMWF in a se-ries of forecasts starting from the analyzed fields every 24 h. Each forecast is run for 10
36 h, allowing 12 h spin-up followed by 24 h to be diagnosed and used in our investiga-tion, with three hours resolution. The IFS model uses assimilated meteorological fields as input. The aerosol simulations are performed in a T42 resolution (2.8 degrees) with meteorological data for the year 2000. The modelled aerosols have no interaction with clouds. Clouds are not modelled in Oslo CTM2, but cloud data used in the investiga-15
tion here are taken from the ECMWF model described above. Thus, in the analysis of aerosol-cloud relations we refer to this system as Oslo CTM2-ECMWF.
Oslo CTM2 includes the main aerosol components (sea salt, mineral dust, sul-phate, organic carbon, and black carbon) (Myhre et al., 2006). Emissions for these species and their precursors are according to AEROCOM B (http://nansen.ipsl.jussieu.
20
fr/AEROCOM/). Hygroscopic growth is included for three of these components (sea salt, sulphate, organic carbon from fossil fuel). Since aerosol retrievals are only per-formed in clear sky pixels and models normally use grid box relative humidity (the same for both clear and cloudy sky) with substantially coarser resolution, an investigation of the influence of relative humidity on the AOD-cloud relationship is not trivial and sev-25
eral model simulations have been necessary to gain insight into this problem. Table 1 outlines the four simulations with the Oslo CTM2 in which various degrees of hygro-scopic growth have been taken into account to investigate relationships between AOD
ACPD
6, 9351–9388, 2006
Aerosol-cloud interaction inferred
from MODIS and models G. Myhre et al. Title Page Abstract Introduction Conclusions References Tables Figures J I J I Back Close
Full Screen / Esc
Printer-friendly Version Interactive Discussion
and various cloud parameters. Several cases are performed related to the hygroscopic growth of the particles which is very dependent on the relative humidity. We have experimented with the upper threshold in relative humidity as a limit for hygroscopic growth. We have tested the impact of using clear sky relative humidity instead of the grid box mean (including the clear sky and cloudy sky) that is applied to hydroscopic 5
growth. In addition we have experimented with the cloud screening thresholds in the analysis (Table 1).
2.3 CAM-Oslo
CAM-Oslo is a modified version of the National Center for Atmospheric Research (NCAR) Community Atmosphere Model Version 2.0.1 (CAM 2.0.1) (http://www.ccsm.
10
ucar.edu/models/atm-cam). For this study, the model was run with an Eulerian dy-namical core, 26 vertical levels and T42 horizontal resolution. We run the model with climatological Sea Surface Temperatures (SSTs). The model is run with an lifecycle model for sulfate and carbonaceous aerosol species (Iversen and Seland, 2002), with AEROCOM B emissions corresponding to present day. These are combined with dust 15
and sea salt background aerosols in multiple lognormal aerosol modes (Kirkev ˚ag and Iversen, 2002). In the model simulations used in this study aerosols have no interaction with the clouds.
Description of four cases for the CAM-Oslo is given in Table 1. Due to differences in the model designs the upper threshold for relative humidity is applied in slightly 20
different ways between the 2 models. Otherwise the cases described for Oslo CTM2 and CAM-Oslo in Table 1 are quite similar.
ACPD
6, 9351–9388, 2006
Aerosol-cloud interaction inferred
from MODIS and models G. Myhre et al. Title Page Abstract Introduction Conclusions References Tables Figures J I J I Back Close
Full Screen / Esc
Printer-friendly Version Interactive Discussion
3 Results
3.1 Aerosol optical depth
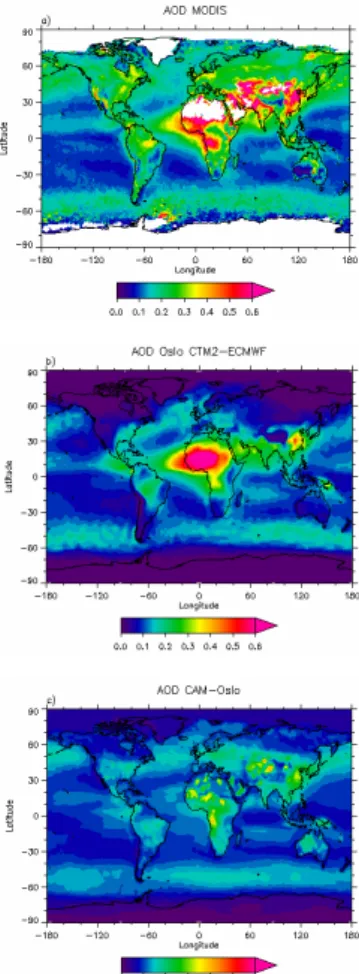
Figure 1 shows the annual mean distribution of the AOD for Modis, Oslo CTM2-ECMWF, and CAM-Oslo. The main areas of large AOD of natural and anthropogenic origin are similar. However, the magnitude of AOD differs. At high northern latitudes 5
there are particularly large differences in AOD between Modis and the two models. These results are likely to be a combination of too low AOD in the models due to low emissions in these areas and too small long range transport of aerosols to these re-gions. But the Modis data can also to some extent have been influenced by problems with aerosol retrieval under snow conditions.
10
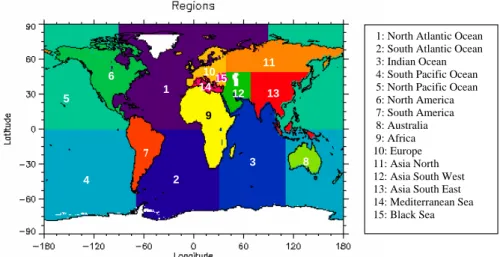
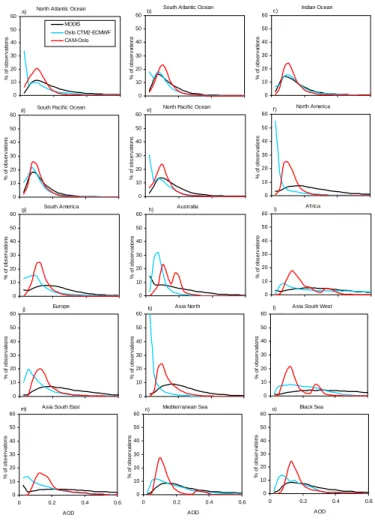
The regions defined in this study are shown in Fig. 2. The percentage distribution of AOD shown in Fig. 3 illustrates that there is reasonable agreement in many regions given the uncertainty that exists in the global distributions of aerosols. The largest differences are found over high latitude land areas as seen also in Fig. 1.
3.2 Cloud fraction 15
3.2.1 Regional scale
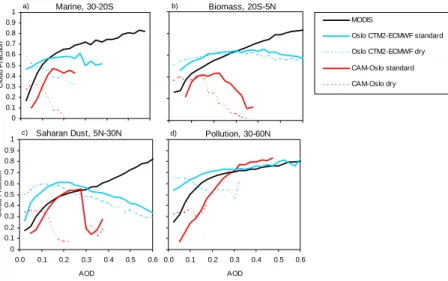
Kaufman et al. (2005a) analysed 4 regions in the Atlantic where the sources of the aerosols are relatively distinct. Figure 4 shows our results for cloud cover as a function of AOD in the same areas for the Modis data, and for the main cases described in Table 1 for Oslo-CTM2–ECMWF and Oslo CAM. In all the 4 regions Modis has a strong 20
increase in the cloud cover as AOD increases, consistent with the finding of Kaufman et al. (2005a). Note here also the strong increase in cloud cover with AOD in regions with aerosols which are relatively hydrophobic, such as biomass and dust aerosols. In the regions dominated by biomass and dust aerosols the increase in cloud cover is rather constant for AOD up to 0.6, whereas for the regions dominated by marine and 25
ACPD
6, 9351–9388, 2006
Aerosol-cloud interaction inferred
from MODIS and models G. Myhre et al. Title Page Abstract Introduction Conclusions References Tables Figures J I J I Back Close
Full Screen / Esc
Printer-friendly Version Interactive Discussion
polluted aerosols there is a strong increase in cloud cover for AOD below ∼0.2 and weaker increase for higher AODs. In Oslo CTM2-ECMWF there is a modest increase in the cloud cover as a function of AOD up to ∼0.2 and variable for higher AOD. In all regions this increase is weaker than in the Modis data except in the dust case. For higher AOD the increase in cloud cover with AOD levels off and eventually turns into 5
a decrease, except in the pollution case, where the increase follows the Modis data well. The difference between the standard and the dry case is largest in the marine and polluted regions since these are regions with the most hygroscopic aerosols. In the CAM-Oslo standard case the increase in cloud cover with AOD is really strong in the polluted region, this is the only region with larger increase than in Modis. In the 10
other regions the results vary substantially with AOD. As for Oslo-CTM2-ECMWF the difference between the standard and the dry case is largest in the marine and polluted regions, but in addition also the Saharan dust case differs substantially. In general, the difference between the standard case and dry case is larger in the CAM-Oslo model than in Oslo CTM2-ECMWF.
15
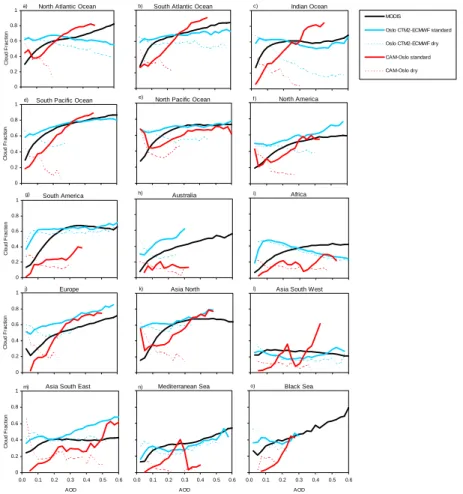
Figure 5 shows relationships between AOD and cloud fraction for various regions for the Modis data, Oslo-CTM2–ECMWF, and Oslo CAM. Modis shows an increase in the cloud cover with increasing AOD in all areas except for AOD above ∼0.2 in the Indian Ocean, Asia south west, and Asia south east and above ∼0.4 in South America and Asia north. The increase in cloud cover with AOD is particularly large for small AOD. In 20
the Modis data there are no large differences between land and ocean.
The cloud cover in the ECMWF data increases with AOD from the Oslo-CTM2 in the standard case in the same regions as the MODIS data with a few exceptions, most notably in the region of Africa. Even in the three regions with most pronounced decrease in MODIS cloud fraction for high AOD the agreement between MODIS and 25
Oslo-CTM2-ECMWF is quite good. In these regions the cloud cover in the ECMWF data shifts from a weak increase to a weak or more substantial decrease with AOD in Oslo-CTM2 from the standard to the dry case. In general the two cases rhclear and rhclear95 are as expected between the standard and dry cases, with rhclear close to
ACPD
6, 9351–9388, 2006
Aerosol-cloud interaction inferred
from MODIS and models G. Myhre et al. Title Page Abstract Introduction Conclusions References Tables Figures J I J I Back Close
Full Screen / Esc
Printer-friendly Version Interactive Discussion
the standard case and the rhclear95 close to the dry case (not shown). This finding, in addition to sensitivity simulations not shown, indicates first that the threshold for cloud screening in the analysis is not of great significance. Further, the largest importance of relative humidity is for values higher than 95%. For small AOD the Modis cloud fraction is smaller than in all the four Oslo-CTM2 AOD cases for all regions, but the Modis cloud 5
cover has generally a stronger increase with AOD, at least for small AOD.
For CAM-Oslo (standard case) the increase in the cloud cover with AOD is quite vari-able. In most regions there is a stronger increase in this relationship than the Modis and the Oslo-CTM2-ECWMF data show but in some regions a weaker increase. In the two cases with upper threshold of 95% relative humidity the results (not shown) are 10
substantially different from the standard case, indicating that for CAM-Oslo the stud-ied relationship is more strongly dependent on relative humidity than in Oslo CTM2-ECMWF. As for Oslo-CTM2-ECMWF the CAM-Oslo results are only weakly dependent on the threshold of the cloud screening. For the dry case in CAM-Oslo the change in cloud cover with AOD is quite different from the standard case and generally more 15
similar to the two cases with upper threshold of 95% relative humidity. In many regions there is a decrease in cloud cover with increasing AOD for the dry case in CAM-Oslo. Overall the modelled dry cases have a slight tendency to show a decrease in cloud cover with increasing AOD; however, the only region where this seems to be clearly consistent between the models is the Indian Ocean.
20
3.2.2 Global scale
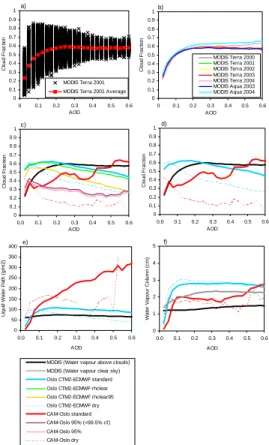
In Figure 6a the relationship between cloud cover and AOD is shown on a global scale for 2001 with an average curve as well as individual data grouped together. Modis data for various years are shown in Fig. 6b. Figures 6c and d show the Modis and models with all cases and the most important cases, respectively. For AOD below 0.2 Modis 25
shows a much stronger increase in cloud cover with AOD than the models do. This increase is consistent for the various years and the two satellite platforms for Modis. For AOD above 0.2 cloud fraction varies little with AOD in the Modis data. The results
ACPD
6, 9351–9388, 2006
Aerosol-cloud interaction inferred
from MODIS and models G. Myhre et al. Title Page Abstract Introduction Conclusions References Tables Figures J I J I Back Close
Full Screen / Esc
Printer-friendly Version Interactive Discussion
diverge between the two models. In both models the cloud cover decreases with AOD in the dry cases, indicating that large scale meteorological conditions globally favor high AOD under relatively clear sky conditions. The two models show a significant effect of the hygroscopic growth, but the difference in magnitude of the effect of water uptake in the two models is large. In this respect the difference is substantial both 5
below and above relative humidity of 95%. 3.3 Liquid water path
3.3.1 Regional scale
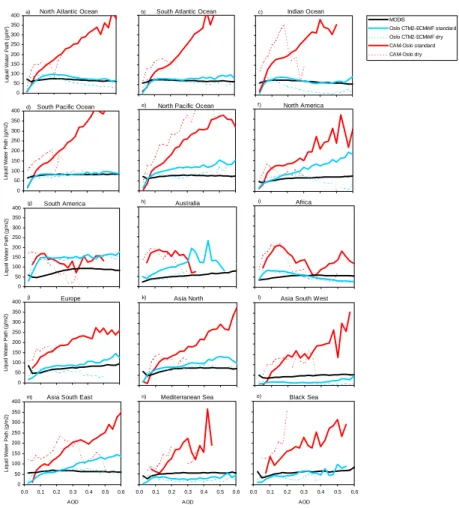
Figure 7 shows LWP as a function of AOD. For Modis it illustrates a modest change. There is a tendency for a weak increase in LWP with AOD which is stronger over land 10
than ocean. There is even a slight decrease over a few oceanic regions. Another distinct pattern for the Modis data is that inter regional differences in the relationship between LWP and AOD are quite small. For the Oslo-CTM2-ECMWF data inter re-gional variations are larger, but in several of the regions quite similar to the Modis data. For low AOD the Oslo CTM2-ECMWF data show a significant increase in LWP with 15
AOD in most of the regions. Further, in Oslo-CTM2-ECMWF hygroscopic growth plays only a minor role in the studied relationship. For CAM-Oslo the standard case shows in most of the regions a strong increase in LWP with AOD, with the dry case varying sub-stantially between various regions. The hygroscopic effect has therefore a large impact on the results from the CAM-Oslo model, in particular for relative humidity above 95%. 20
The Modis LWP has a weaker increase with AOD than the models and hygroscopicity can only to some extent explain the differences. Especially, at low AOD where the two models are rather consistent the increase is stronger than in the Modis data.
ACPD
6, 9351–9388, 2006
Aerosol-cloud interaction inferred
from MODIS and models G. Myhre et al. Title Page Abstract Introduction Conclusions References Tables Figures J I J I Back Close
Full Screen / Esc
Printer-friendly Version Interactive Discussion
3.3.2 Global scale
On a global scale there is a stronger increase in LWP for low AOD in the models than in Modis. In CAM-Oslo this is in general mainly due to the hygroscopic effect (see Fig. 6e). The relationship found in the models for low AOD must arises from meteorological factors. Whether microphysical aerosol-cloud interaction is the cause 5
for the results for LWP can not be concluded from the Modis data and the models used here.
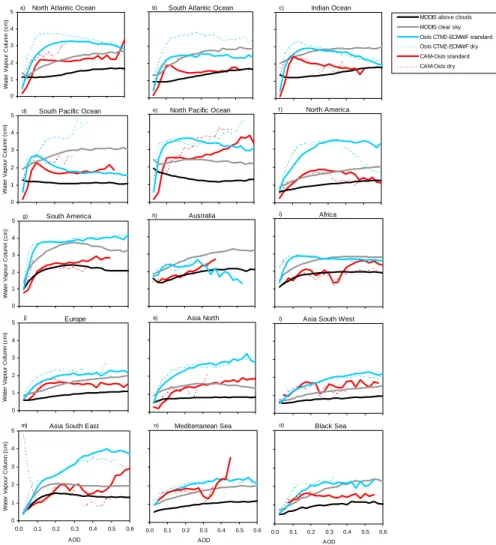
3.4 Water vapour 3.4.1 Regional scale
The Modis retrieval provides results for column water vapour in the clear sky and 10
above clouds separately (Fig. 8). Except over the North Pacific Ocean the Modis water vapour column increases mainly with AOD in all regions. The clear sky wa-ter vapour column shows a larger increase with AOD than the wawa-ter vapour column above clouds. The changes in the relationships in water vapour column with AOD in the Oslo-CTM2-ECMWF simulations are relatively similar for the four AOD simulations 15
(only two shown), even for the dry case in most regions. Also in CAM-Oslo the dif-ference between the four cases (only two shown) is small, indicating that hygroscopic growth is not playing a major role for the results of water vapour and their relationship with AOD. The Oslo-CTM2-ECMWF shows a larger increase and higher values in the water vapour with AOD than Modis and CAM-Oslo do. Meteorological conditions most 20
likely play a role in the relationship between AOD and water vapour since the models shows an increase in the water vapour with AOD which is caused neither by aerosol-cloud interactions nor by hygroscopic growth. One example of such a relation is that air masses from high latitudes are usually relatively dry and with lower aerosol abundance than air masses typically at mid-latitudes and tropical regions.
25
ACPD
6, 9351–9388, 2006
Aerosol-cloud interaction inferred
from MODIS and models G. Myhre et al. Title Page Abstract Introduction Conclusions References Tables Figures J I J I Back Close
Full Screen / Esc
Printer-friendly Version Interactive Discussion
3.4.2 Global scale
The increase in the water vapour column is much stronger in the two models than in Modis for low AOD (Fig. 6f). Significant differences between the results of the models cannot be explained by the hygroscopic effect of aerosols alone. The two models do not separate the water vapour column in clear sky and above clouds as in the Modis 5
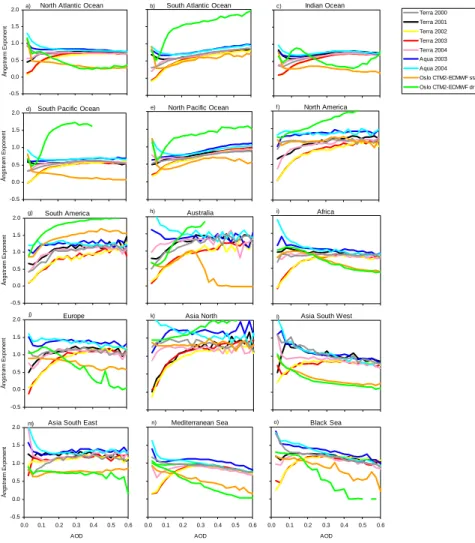
data, complicating the comparison somewhat. 3.5 Angstrøm exponent˚
The ˚Angstrøm exponent increases mostly with AOD in the Modis data, with some re-gional variations and interannual variations (Fig. 9). The results from the Aqua satellite differ from the results from Terra, especially for low AOD. Differing results between 10
Terra and Aqua are not seen in the results shown in Fig. 5 for cloud fraction, see also Fig. 6b. The general trend that the ˚Angstrøm exponent increases with AOD is opposite to what would be the case if swelling of particles due to hygroscopic growth near cloudy areas played a major role in the Modis data. In the Oslo CTM2 the ˚Angstrøm exponent follows the Modis ˚Angstrøm exponent in many regions but with a general tendency to 15
decrease slightly more with AOD than the Modis data do. In some of the regions the magnitude of the ˚Angstrøm exponent differs in the model compared to Modis, most notably in two of the Asian regions.
3.6 Cloud top pressure vs cloud cover
In Fig. 10 cloud top pressure (CTP) is shown as a function of AOD from Modis. Except 20
for very small AOD over some regions CTP decreases (higher cloud altitude) with in-creasing AOD in accordance with other studies (Kaufman et al., 2005a; Koren et al., 2005). This may be a result of the suppression of precipitation effect by extending the cloud lifetime (Andreae et al., 2004; Williams et al., 2002). Figure 11 shows cloud top pressure as a function of cloud cover. In the Modis data a significant decrease in the 25
ACPD
6, 9351–9388, 2006
Aerosol-cloud interaction inferred
from MODIS and models G. Myhre et al. Title Page Abstract Introduction Conclusions References Tables Figures J I J I Back Close
Full Screen / Esc
Printer-friendly Version Interactive Discussion
CTP as a function of the cloud fraction is found. This decrease is very similar in the various regions. The reduction in CTP is largest at high cloud fractions. A relationship between AOD and cloud cover will thus imply a relationship also between AOD and CTP.
4 Discussion
5
4.1 Causes for model differences
The two models used in this study show a large spread in results revealing differences that arise from the aerosol distribution, the effect of hygroscopic growth, other cloud processes, and meteorological situations. Most noticeable is the difference in the ef-fect of hygroscopic growth. The parameterizations made for the various hygroscopic 10
aerosols are rather similar in the two global aerosol models. These depend on aerosol size and relative humidity. The growth factor (relative increase in aerosol size from a dry aerosol) increases with aerosol size. Therefore if the CAM-Oslo model had larger aerosols than the Oslo-CTM2 this could contribute to the variation seen in the effect of water uptake between the two models. However, the global aerosol modelling (Ae-15
roCom) exercise (Textor et al., 2006) shows that in fact the opposite is the case since Oslo-CTM2 has slightly larger aerosols. Note here that both models had aerosol sizes in reasonable agreement with the models involved in this intercomparison. Myhre et al. (2004) found that the relative humidity in the NCAR model was much higher than in the ECMWF data. This actually strengthened the direct aerosol effect of sulphate 20
aerosols using the NCAR relative humidity compared to ECMWF relative humidity by 60%. E.g., the fraction of grid points with relative humidity over 95% in the ECMWF data below 8 km is around 5% whereas in the NCAR data it is closer to 20%. The discrepancy in relative humidity is likely to be the main cause of the difference in the hygroscopic effect between the two models. Notice, however, that different versions 25
of the NCAR model have been used in the NCAR based studies cited above and this 9365
ACPD
6, 9351–9388, 2006
Aerosol-cloud interaction inferred
from MODIS and models G. Myhre et al. Title Page Abstract Introduction Conclusions References Tables Figures J I J I Back Close
Full Screen / Esc
Printer-friendly Version Interactive Discussion
study.
4.2 Implications for cloud cover
No obvious relations between AOD and cloud cover were found in the two models without physical aerosol-cloud-interactions, in the case when hygroscopic growth was neglected. However, in general there was a weak tendency that cloud cover decreased 5
with AOD in these cases in the two models. This indicates that meteorological factors influence the relationship. E.g., over land AOD and cloud cover are often inversely related as high pressure systems favour low cloud amounts and build up of aerosols, whereas over ocean storms lead to more clouds as well as sea salt aerosols. There is in most cases a strong increase in cloud cover with AOD in the Modis data which 10
we interpret as a result of two factors. First, the largest impact seems to be a cloud cover increase, especially at low AOD, which is indicative of physical aerosol-cloud interactions. At low AOD (below ∼0.2) there is an increase in cloud cover with AOD in the Modis data which in almost all regions is stronger than in the models. Further, part of the increase in cloud cover, especially at larger AOD can to some extent be explained 15
by larger hygroscopic growth near clouds. As the efficiency of the hygroscopic growth is crucial, the screening criteria for clouds in the Modis retrievals are very important. Of crucial importance is also the hygroscopic nature of atmospheric aerosols and their representation in global aerosol models. Residual cloud contamination in the aerosol retrievals has been suggested to be a cause for the increase in cloud cover with AOD 20
(Zhang et al., 2005), but Kaufman et al. (2005c) found the contamination to be low and to play an insignificant role in studies of aerosol-cloud interactions. The largest increase in cloud cover with AOD is at low AOD where also cloud cover is small. This is the situation where cloud contamination is expected to be weakest (Kaufman et al., 2005c; Zhang et al., 2005). Based on the various model simulations we have performed 25
we find that use of relative humidity in the clear sky versus grid box averages and the choice of thresholds of cloud amount are not of major importance.
hygro-ACPD
6, 9351–9388, 2006
Aerosol-cloud interaction inferred
from MODIS and models G. Myhre et al. Title Page Abstract Introduction Conclusions References Tables Figures J I J I Back Close
Full Screen / Esc
Printer-friendly Version Interactive Discussion
scopic growth as the ˚Angstrøm exponent increases in many areas with AOD. This is opposite to what would be expected if water uptake was the primary cause. The model results for the ˚Angstrøm exponent also indicate that there is a large humidification ef-fect. In this respect there is reasonable agreement between the model and the Modis data. One conclusion from the analysis performed here could be drawn from the Modis 5
data in combination with the model simulations. On a global scale the reduced cloud cover from the semi-direct effect seems to be small at least for small AODs. The sup-pression of precipitation effect is more likely to play a role as a contributor to changed cloud cover from aerosol-cloud interactions. It is shown that the semi-direct effect may even increase cloud cover (Johnson et al., 2004) and it may therefore not be ruled out. 10
Further, the general lack of increase in cloud cover for AOD higher than ∼0.2 may be influenced by the semi-direct aerosol effect.
4.3 Consequences for other cloud parameters
The model simulations of the relationships between AOD and water vapour as well as AOD and LWP show that meteorological conditions influence the analysis significantly. 15
In a few results the hygroscopic growth of the aerosols also plays an important role. The Modis data shows generally weaker increase in these water quantities with AOD than the models but firm conclusions from these simulations seem difficult and further analysis is necessary.
Based on the analysis performed here Modis results of relationship between AOD 20
and cloud optical depth (Fig. 12) as well as AOD and effective radius (Fig. 13) must be treated with care. The cloud optical depth shows an increase with AOD and mostly effective radius shows a decrease with AOD in accordance with the classical the-ory (Twomey, 1977). The cloud effective radius appears in some places (e.g., the Mediterranean) to paradoxically increase with AOD. But this is probably mostly a man-25
ifestation of the observation that cloud top pressure decreases there too with AOD, because cloud effective radius increases with a decreasing cloud top pressure of con-vective clouds (Rosenfeld and Lensky, 1998). This is supported by the cloud fraction
ACPD
6, 9351–9388, 2006
Aerosol-cloud interaction inferred
from MODIS and models G. Myhre et al. Title Page Abstract Introduction Conclusions References Tables Figures J I J I Back Close
Full Screen / Esc
Printer-friendly Version Interactive Discussion
increase with AOD and cloud top pressure decrease with cloud fraction in the Mediter-ranean. The LWP increases also with AOD (Fig. 7) and thus contributes also to an in-creased cloud optical depth with AOD. However, since we have seen that hygroscopic growth and meteorological factors influence relationships of other cloud parameters with AOD, it is not obvious that this can be ruled out for cloud optical depth and e ffec-5
tive radius.
The Modis data consist of an enormous amount of data which are valuable for under-standing how aerosols influence clouds. The analysis here shows that the hygroscopic behaviour of aerosols introduces a complicating factor so that the aerosol-cloud anal-ysis needs to be made by combining several tools. Further, care must be taken since 10
several of the cloud parameters in the Modis data are correlated such as e.g. cloud cover and cloud top pressure. As AOD and cloud cover are related, AOD and cloud top pressure will also show a clear relation, but this may be fictitious (as cloud cover and cloud top pressure correlate) and be due to aerosol influence on clouds through the suppression of precipitation effect, as studies of modelling and observations show 15
this possibility.
5 Summary
Based on MODIS satellite data in combination with global aerosol models we have found that the cloud fraction increase with AOD on global scale and that most of this is likely linked to aerosol-cloud interactions. The most clear cloud-aerosol effect is ob-20
served for cloud fraction at AOD<0.2, in the most pronounced way over the “marine” ocean (Fig. 4) and it is limited to smaller AOD ranges over oceans than over land. As stated in the introduction, this supports the mechanism of transition change from open to closed Benard cells over ocean (Rosenfeld et al., 2006). Over land that mechanism has not been observed, and respectively the cloud fraction increase with AOD is more 25
blurred and occurs over a wider range of AOD. Over land the inverse occurs at the very large AOD, with the mechanism described by Koren et al. (2004). We find that the
ACPD
6, 9351–9388, 2006
Aerosol-cloud interaction inferred
from MODIS and models G. Myhre et al. Title Page Abstract Introduction Conclusions References Tables Figures J I J I Back Close
Full Screen / Esc
Printer-friendly Version Interactive Discussion
cloud fraction increase with AOD is relatively independent of aerosol chemical compo-sition in accordance with the finding in Dusek et al. (2006) that aerosol size distribution is much more important for the cloud condensation nuclei concentration. One uncer-tainty regarding the results for cloud fraction is related to the hygroscopic nature of the aerosols, complicating quantification of the impact of aerosol-cloud interactions. 5
We show that cloud top pressure decrease with AOD globally and impact how the cloud effective radius changes with AOD. Thus the suppression of precipitation effect impacts the cloud albedo effect by altering the cloud top pressure. It is difficult to draw conclusions from our results on the LWP and water vapour column indicating whether anthropogenic aerosols impact the hydrological cycle. In general there are 10
many relations between the various parameters, both related to cloud microphysics and meteorology. Thus establishing cause and effect relationships between parameters is difficult and must be made with care.
ACPD
6, 9351–9388, 2006
Aerosol-cloud interaction inferred
from MODIS and models G. Myhre et al. Title Page Abstract Introduction Conclusions References Tables Figures J I J I Back Close
Full Screen / Esc
Printer-friendly Version Interactive Discussion
References
Ackerman, A. S., Toon, O. B., Stevens, D. E., Heymsfield, A. J., Ramanathan, V., et al.: Reduc-tion of tropical cloudiness by soot, Science, 288(5468), 1042–1047, 2000.
Albrecht, B. A.: Aerosols, Cloud Microphysics, And Fractional Cloudiness, Science, 245(4923), 1227–1230, 1989.
5
Anderson, T. L., Charlson, R. J., Schwartz, S. E., Knutti, R., Boucher, O., et al.: Climate forcing by aerosols – a hazy picture, Science, 300(5622), 1103–1104, 2003.
Andreae, M. O., Rosenfeld, D., Artaxo, P., Costa, A. A., Frank, G. P., et al.: Smoking rain clouds over the Amazon, Science, 303(5662), 1337–1342, 2004.
Berglen, T. F., Berntsen, T. K., Isaksen, I. S. A., and Sundet, J. K.: A global model of the
10
coupled sulfur/oxidant chemistry in the troposphere: The sulfur cycle, J. Geophys. Res.-Atmos., 109(D19), 2004.
Breon, F. M., Tanre, D., and Generoso, S.: Aerosol effect on cloud droplet size monitored from satellite, Science, 295(5556), 834–838, 2002.
Cook, J. and Highwood, E. J.: Climate response to tropospheric absorbing aerosols in an
15
intermediate general-circulation model, Q. J. R. Meteorol. Soc., 130(596), 175–191, 2004. Dusek, U., Frank, G. P., Hildebrandt, L., Curtius, J., Schneider, J., et al.: Size matters more than
chemistry for cloud-nucleating ability of aerosol particles, Science, 312(5778), 1375–1378, 2006.
Feingold, G., Eberhard, W. L., Veron, D. E., and Previdi, M.: First measurements of the Twomey
20
indirect effect using ground-based remote sensors, Geophys. Res. Lett., 30(6), 2003. Forest, C. E., Stone, P. H., Sokolov, A. P., Allen, M. R., and Webster, M. D.: Quantifying
uncer-tainties in climate system properties with the use of recent climate observations, Science, 295(5552), 113–117, 2002.
Gunn, R. and Phillips, B. B.: An Experimental Investigation Of The Effect Of Air Pollution On
25
The Initiation Of Rain, J. Meteorol., 14(3), 272–280, 1957.
Houghton, J. T., Ding, Y., Griggs, D. J., Noguer, M., et al. (Eds): Climate Change 2001: The Scientific Basis. Contribution of Working Group I to the Third Assessment Report of the Intergovernmental Panel on Climate Change. Cambridge Univ. Press, UK/USA, 2001. Iversen, T. and Seland, O.: A scheme for process-tagged SO4 and BC aerosols in NCAR
30
CCM3: Validation and sensitivity to cloud processes, J. Geophys. Res.-Atmos., 107(D24), 4751, doi:10.1029/2001JD000885, 2002.
ACPD
6, 9351–9388, 2006
Aerosol-cloud interaction inferred
from MODIS and models G. Myhre et al. Title Page Abstract Introduction Conclusions References Tables Figures J I J I Back Close
Full Screen / Esc
Printer-friendly Version Interactive Discussion
Johnson, B. T., Shine, K. P., and Forster, P. M.: The semi-direct aerosol effect: Impact of absorbing aerosols on marine stratocumulus, Q. J. R. Meteorol. Soc., 130(599), 1407–1422, 2004.
Karl, T. R. and Steurer, P. M.: Increased Cloudiness In The United-States During The 1st-Half Of The 20th-Century – Fact Or Fiction, Geophys. Res. Lett., 17(11), 1925–1928, 1990.
5
Kaufman, Y. J., Boucher, O., Tanre, D., Chin, M., Remer, L. A., et al.: Aerosol anthro-pogenic component estimated from satellite data, Geophys. Res. Lett., 32(17), L17804, doi:10.1029/2005GL023125, 2005b.
Kaufman, Y. J. and Fraser, R. S.: The effect of smoke particles on clouds and climate forcing, Science, 277(5332), 1636–1639, 1997.
10
Kaufman, Y. J., Koren, I., Remer, L. A., Rosenfeld, D., and Rudich, Y.: The effect of smoke, dust, and pollution aerosol on shallow cloud development over the Atlantic Ocean, Proceedings Of The National Academy Of Sciences Of The United States Of America, 102(32), 11 207– 11 212, 2005a.
Kaufman, Y. J., Remer, L. A., Tanre, D., Li, R. R., Kleidman, R., et al.: A critical examination
15
of the residual cloud contamination and diurnal sampling effects on MODIS estimates of aerosol over ocean, Ieee Transactions On Geoscience And Remote Sensing, 43(12), 2886– 2897, 2005c.
Kaufman, Y. J., Tanre, D. and Boucher, O.: A satellite view of aerosols in the climate system, Nature, 419(6903), 215-223, 2002.
20
Kaufman, Y. J., Tanre, D., Remer, L. A., Vermote, E. F., Chu, A., et al.: Operational remote sensing of tropospheric aerosol over land from EOS moderate resolution imaging spectrora-diometer, J. Geophys. Res.-Atmos., 102(D14), 17 051–17 067, 1997.
Khain, A., Rosenfeld, D., and Pokrovsky, A.: Aerosol impact on the dynamics and microphysics of deep convective clouds, Q. J. R. Meteorol. Soc., 131(611), 2639–2663, 2005.
25
Kim, B. G., Schwartz, S. E., Miller, M. A., and Min, Q. L.: Effective radius of cloud droplets by ground-based remote sensing: Relationship to aerosol, J. Geophys. Res.-Atmos., 108(D23), 4740, doi:10.1029/2003JD003721, 2003.
Kirkev ˚ag, A. and Iversen, T.: Global direct radiative forcing by process-parameterized aerosol optical properties, J. Geophys. Res.-Atmos., 107(D20), 4433, doi:10.1029/2001JD000886,
30
2002.
Knutti, R., Stocker, T. F., Joos, F., and Plattner, G. K.: Constraints on radiative forcing and future climate change from observations and climate model ensembles, Nature, 416(6882),
ACPD
6, 9351–9388, 2006
Aerosol-cloud interaction inferred
from MODIS and models G. Myhre et al. Title Page Abstract Introduction Conclusions References Tables Figures J I J I Back Close
Full Screen / Esc
Printer-friendly Version Interactive Discussion
719–723, 2002.
Koren, I., Kaufman, Y. J., Remer, L. A., and Martins, J. V.: Measurement of the effect of Amazon smoke on inhibition of cloud formation, Science, 303(5662), 1342–1345, 2004.
Koren, I., Kaufman, Y. J., Rosenfeld, D., Remer, L. A. and Rudich, Y.: Aerosol invigora-tion and restructuring of Atlantic convective clouds, Geophys. Res. Lett., 32(14), L14828,
5
doi:10.1029/2005GL023187, 2005.
Lohmann, U. and Feichter, J.: Global indirect aerosol effects: a review, Atmos. Chem. Phys., 5, 715–737, 2005.
Lohmann, U., Koren, I., and Kaufman, Y. J.: Disentangling the role of microphysical and dy-namical effects in determining cloud properties over the Atlantic, Geophys. Res. Lett., 33,
10
L09802, L09802, doi:10.1029/2005GL024625, 2006.
Menon, S., Hansen, J., Nazarenko, L., and Luo, Y. F.: Climate effects of black carbon aerosols in China and India, Science, 297(5590), 2250–2253, 2002.
Myhre, G., Stordal, F., Berglen, T. F., Sundet, J. K., and Isaksen, I. S. A.: Uncertainties in the radiative forcing due to sulfate aerosols, J. Atmos. Sci., 61(5), 485–498, 2004.
15
Myhre, G., Bellouin, N., Berglen, T. F., Berntsen, T. K., Boucher, O., et al.: Comparison of the radiative properties and direct radiative effect of aerosols from a global aerosol model and remote sensing data over ocean, Tellus, in press, 2006.
Norris, J. R.: On trends and possible artifacts in global ocean cloud cover between 1952 and 1995, J. Climate, 12(6), 1864–1870, 1999.
20
Penner, J. E., Dong, X. Q., and Chen, Y.: Observational evidence of a change in radiative forcing due to the indirect aerosol effect, Nature, 427(6971), 231–234, 2004.
Penner, J. E., Zhang, S. Y., and Chuang, C. C.: Soot and smoke aerosol may not warm climate, J. Geophys. Res.-Atmos., 108(D21), 4657, doi:10.1029/2003JD003409, 2003.
Platnick, S., King, M. D., Ackerman, S. A., Menzel, W. P., Baum, B. A., et al.: The MODIS
25
cloud products: Algorithms and examples from Terra, Ieee Transactions On Geoscience And Remote Sensing, 41(2), 459–473, 2003.
Ramanathan, V., Crutzen, P. J., Kiehl, J. T., and Rosenfeld, D.: Atmosphere - Aerosols, climate, and the hydrological cycle, Science, 294(5549), 2119–2124, 2001.
Remer, L. A., Kaufman, Y. J., Tanre, D., Mattoo, S., Chu, D. A., et al.: The MODIS aerosol
30
algorithm, products, and validation, J. Atmos. Sci., 62(4), 947–973, 2005.
Rosenfeld, D.: TRMM observed first direct evidence of smoke from forest fires inhibiting rainfall, Geophys. Res. Lett., 26(20), 3105–3108, 1999.
ACPD
6, 9351–9388, 2006
Aerosol-cloud interaction inferred
from MODIS and models G. Myhre et al. Title Page Abstract Introduction Conclusions References Tables Figures J I J I Back Close
Full Screen / Esc
Printer-friendly Version Interactive Discussion
Rosenfeld, D.: Suppression of rain and snow by urban and industrial air pollution, Science, 287(5459), 1793–1796, 2000.
Rosenfeld, D., Kaufman, Y. J., and Koren, I.: Switching cloud cover and dynamical regimes from open to closed Benard cells in response to supression of precipitation by aerosols, Atmos. Chem. Phys., 6, 2503–2511, 2006.
5
Rosenfeld, D., Lahav, R., Khain, A. and Pinsky, M.: The role of sea spray in cleansing air pollution over ocean via cloud processes, Science, 297(5587), 1667–1670, 2002.
Rosenfeld, D. and Lensky, I. M.: Satellite-based insights into precipitation formation processes in continental and maritime convective clouds, Bull. Am. Meteorol. Soc., 79(11), 2457–2476, 1998.
10
Schwartz, S. E., Harshvardhan, and Benkovitz, C. M.: Influence of anthropogenic aerosol on cloud optical depth and albedo shown by satellite measurements and chemical transport modeling, Proceedings Of The National Academy Of Sciences Of The United States Of America, 99(4), 1784–1789, 2002.
Sekiguchi, M., Nakajima, T., Suzuki, K., Kawamoto, K., Higurashi, A., et al.: A study of the
15
direct and indirect effects of aerosols using global satellite data sets of aerosol and cloud parameters, J. Geophys. Res.-Atmos., 108(D22), 4699, doi:10.1029/2002JD003359, 2003. Sun, B. M. and Groisman, P. Y.: Variations in low cloud cover over the United States during the
second half of the twentieth century, J. Climate, 17(9), 1883–1888, 2004.
Tanr ´e, D., Kaufman, Y. J., Herman, M., and Mattoo, S.: Remote sensing of aerosol properties
20
over oceans using the MODIS/EOS spectral radiances, J. Geophys. Res.-Atmos., 102(D14), 16 971–16 988, 1997.
Textor, C., Schulz, M., Guibert, S., Kinne, S., Balkanski, Y., et al.: Analysis and quantification of the diversities of aerosol life cycles within AeroCom, Atmos. Chem. Phys., 6, 1777–1813, 2006.
25
Tuomenvirta, H., Alexandersson, H., Drebs, A., Frich, P., and Nordli, P. O.: Trends in Nordic and Arctic temperature extremes and ranges, J. Climate, 13(5), 977–990, 2000.
Twomey, S.: Influence Of Pollution On Shortwave Albedo Of Clouds, J. Atmos. Sci., 34(7), 1149–1152, 1977.
Williams, E., Rosenfeld, D., Madden, N., Gerlach, J., Gears, N., et al.: Contrasting convective
30
regimes over the Amazon: Implications for cloud electrification, J. Geophys. Res.-Atmos., 107(D20), 8082, doi:10.1029/2001JD000380, 2002.
Zhang, J. L., Reid, J. S., and Holben, B. N.: An analysis of potential cloud artifacts in
ACPD
6, 9351–9388, 2006
Aerosol-cloud interaction inferred
from MODIS and models G. Myhre et al. Title Page Abstract Introduction Conclusions References Tables Figures J I J I Back Close
Full Screen / Esc
Printer-friendly Version Interactive Discussion
MODIS over ocean aerosol optical thickness products, Geophys. Res. Lett., 32(15), L15803, doi:10.1029/2005GL023254, 2005.
ACPD
6, 9351–9388, 2006
Aerosol-cloud interaction inferred
from MODIS and models G. Myhre et al. Title Page Abstract Introduction Conclusions References Tables Figures J I J I Back Close
Full Screen / Esc
Printer-friendly Version Interactive Discussion
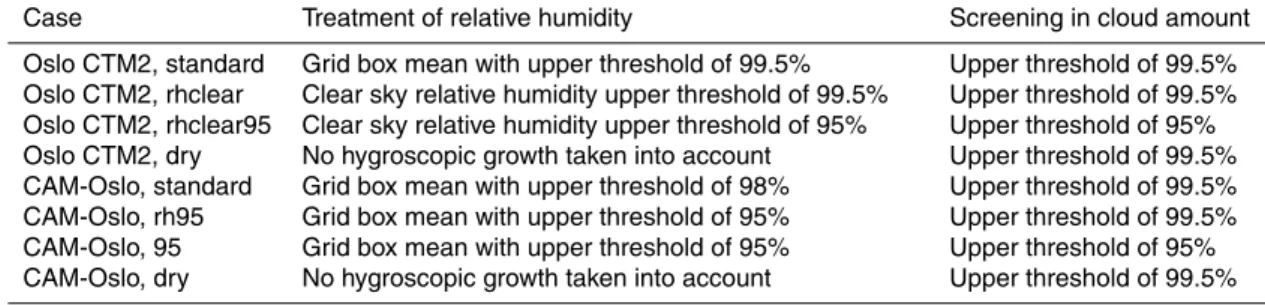
Table 1. Description of simulations performed. The column for the treatment of relative
hu-midity describes whether hygroscopic growth is taken into account and the upper bound in the hygroscopic growth when applied. The last column describes the cloud screening criteria in the model simulations.
Case Treatment of relative humidity Screening in cloud amount Oslo CTM2, standard Grid box mean with upper threshold of 99.5% Upper threshold of 99.5% Oslo CTM2, rhclear Clear sky relative humidity upper threshold of 99.5% Upper threshold of 99.5% Oslo CTM2, rhclear95 Clear sky relative humidity upper threshold of 95% Upper threshold of 95% Oslo CTM2, dry No hygroscopic growth taken into account Upper threshold of 99.5% CAM-Oslo, standard Grid box mean with upper threshold of 98% Upper threshold of 99.5% CAM-Oslo, rh95 Grid box mean with upper threshold of 95% Upper threshold of 99.5% CAM-Oslo, 95 Grid box mean with upper threshold of 95% Upper threshold of 95% CAM-Oslo, dry No hygroscopic growth taken into account Upper threshold of 99.5%
ACPD
6, 9351–9388, 2006
Aerosol-cloud interaction inferred
from MODIS and models G. Myhre et al. Title Page Abstract Introduction Conclusions References Tables Figures J I J I Back Close
Full Screen / Esc
Printer-friendly Version Interactive Discussion Figure 1.
Fig. 1. Annual mean AOD at 550 nm from (a) Modis, (b) Oslo CTM2-ECMWF, and (c)
CAM-Oslo. Modis data are from the standard Terra product (see text for references and details) for year 2001.
ACPD
6, 9351–9388, 2006
Aerosol-cloud interaction inferred
from MODIS and models G. Myhre et al. Title Page Abstract Introduction Conclusions References Tables Figures J I J I Back Close
Full Screen / Esc
Printer-friendly Version Interactive Discussion EGU Figure 2. 2 1 3 4 5 6 7 8 9 10 11 12 13 14 15
1: North Atlantic Ocean 2: South Atlantic Ocean 3: Indian Ocean 4: South Pacific Ocean 5: North Pacific Ocean 6: North America 7: South America 8: Australia 9: Africa 10: Europe 11: Asia North 12: Asia South West 13: Asia South East 14: Mediterranean Sea 15: Black Sea
12 14 15
Fig. 2. Geographical regions used in this study.
ACPD
6, 9351–9388, 2006
Aerosol-cloud interaction inferred
from MODIS and models G. Myhre et al. Title Page Abstract Introduction Conclusions References Tables Figures J I J I Back Close
Full Screen / Esc
Printer-friendly Version Interactive Discussion
26 North Atlantic Ocean
0 10 20 30 40 50 60 % of obs e rv a tions MODIS Oslo CTM2-ECMWF CAM-Oslo a) Indian Ocean 0 10 20 30 40 50 60 % of obs er v a tions c) South Atlantic Ocean
0 10 20 30 40 50 60 % of obs er v a tions b)
South Pacific Ocean
0 10 20 30 40 50 60 % of ob s e rv at ions
d) North Pacific Ocean
0 10 20 30 40 50 60 % of obs er v a tio n s e) North America 0 10 20 30 40 50 60 % of o b s e rv at ions f) South America 0 10 20 30 40 50 60 % of obs er v a tions g) Australia 0 10 20 30 40 50 60 % o f obs er v a tion s h) Africa 0 10 20 30 40 50 60 % of obs er v a tions i) Europe 0 10 20 30 40 50 60 % of obs er v a tions j) Asia North 0 10 20 30 40 50 60 % of obs er v a tions
k) Asia South West
0 10 20 30 40 50 60 % of obs er v a tions l)
Asia South East
0 10 20 30 40 50 60 0 0.2 0.4 0.6 AOD % of ob s e rv at ions m) Mediterranean Sea 0 10 20 30 40 50 60 0 0.2 0.4 0.6 AOD % of obs er v a tio n s n) Black Sea 0 10 20 30 40 50 60 0 0.2 0.4 0.6 AOD % of obs er v a tions o) Figure 3.
Fig. 3. AOD (550 nm) probability distribution (expressed as a percent frequency per 0.025 AOD
ACPD
6, 9351–9388, 2006
Aerosol-cloud interaction inferred
from MODIS and models G. Myhre et al. Title Page Abstract Introduction Conclusions References Tables Figures J I J I Back Close
Full Screen / Esc
Printer-friendly Version Interactive Discussion EGU Marine, 30-20S 0 0.1 0.2 0.3 0.4 0.5 0.6 0.7 0.8 0.9 1 C lou d F ra c tio n a) Biomass, 20S-5N MODIS
Oslo CTM2-ECMWF standard Oslo CTM2-ECMWF dry CAM-Oslo standard CAM-Oslo dry b) Saharan Dust, 5N-30N 0 0.1 0.2 0.3 0.4 0.5 0.6 0.7 0.8 0.9 1 0.0 0.1 0.2 0.3 0.4 0.5 0.6 AOD C lou d F ra c tio n c) Pollution, 30-60N 0.0 0.1 0.2 0.3 0.4 0.5 0.6 AOD d) Figure 4.
Fig. 4. Cloud fraction as a function of AOD (550 nm) for four Atlantic regions as defined in
Kaufman et al. (2005a). Modis data are from the standard Terra product (see text for references and details) for year 2001.
ACPD
6, 9351–9388, 2006
Aerosol-cloud interaction inferred
from MODIS and models G. Myhre et al. Title Page Abstract Introduction Conclusions References Tables Figures J I J I Back Close
Full Screen / Esc
Printer-friendly Version Interactive Discussion
EGU North Atlantic Ocean
0 0.2 0.4 0.6 0.8 1 C loud F rac tion
a) b) South Atlantic Ocean Indian Ocean
MODIS
Oslo CTM2-ECMWF standard Oslo CTM2-ECMWF dry
CAM-Oslo standard CAM-Oslo dry c)
South Pacific Ocean
0 0.2 0.4 0.6 0.8 1 C loud F rac tion
d) e) North Pacific Ocean f) North America
South America 0 0.2 0.4 0.6 0.8 1 C loud F rac tion g) h) Australia i) Africa Europe 0 0.2 0.4 0.6 0.8 1 C loud F rac tion
j) k) Asia North l) Asia South West
Asia South East
0 0.2 0.4 0.6 0.8 1 0.0 0.1 0.2 0.3 0.4 0.5 0.6 AOD C loud F rac tion m) Mediterranean Sea 0.0 0.1 0.2 0.3 0.4 0.5 0.6 AOD n) Black Sea 0.0 0.1 0.2 0.3 0.4 0.5 0.6 AOD o) Figure 5.
Fig. 5. Cloud fraction as a function of AOD (550 nm) for 15 regions. Ocean and land are
sep-arated in the regions. Modis data are from the standard Terra product (see text for references and details) for year 2001. Regions defined in Fig. 2.
ACPD
6, 9351–9388, 2006
Aerosol-cloud interaction inferred
from MODIS and models G. Myhre et al. Title Page Abstract Introduction Conclusions References Tables Figures J I J I Back Close
Full Screen / Esc
Printer-friendly Version Interactive Discussion 29 a) 0 0.1 0.2 0.3 0.4 0.5 0.6 0.7 0.8 0.9 1 0 0.1 0.2 0.3 0.4 0.5 0.6 AOD C loud F rac tion MODIS Terra 2001 MODIS Terra 2001 Average
b) 0 0.1 0.2 0.3 0.4 0.5 0.6 0.7 0.8 0.9 1 0 0.1 0.2 0.3 0.4 0.5 0.6 AOD C lo u d F rac tion MODIS Terra 2000 MODIS Terra 2001 MODIS Terra 2002 MODIS Terra 2003 MODIS Terra 2004 MODIS Aqua 2003 MODIS Aqua 2004 c) 0 0.1 0.2 0.3 0.4 0.5 0.6 0.7 0.8 0.9 1 0.0 0.1 0.2 0.3 0.4 0.5 0.6 AOD C loud F rac tion
MODIS (Water vapour above clouds) MODIS (Water vapour clear sky) Oslo CTM2-ECMWF standard Oslo CTM2-ECMWF rhclear Oslo CTM2-ECMWF rhclear95 Oslo CTM2-ECMWF dry CAM-Oslo standard CAM-Oslo 95% (<99.5% cf) CAM-Oslo 95% CAM-Oslo dry e) 0 50 100 150 200 250 300 350 400 0.0 0.1 0.2 0.3 0.4 0.5 0.6 AOD L iq u id W a te r P a th ( g /m2 ) f) 0 1 2 3 4 5 0.0 0.1 0.2 0.3 0.4 0.5 0.6 AOD W a te r V a p o u r C o lu mn ( c m ) d) 0 0.1 0.2 0.3 0.4 0.5 0.6 0.7 0.8 0.9 1 0.0 0.1 0.2 0.3 0.4 0.5 0.6 AOD C lou d F rac tio n Figure 6.
Fig. 6. Cloud properties as function of AOD (550 nm). (a) cloud fraction for each 1×1 degree
grid plotted with the global average for Modis for year 2001;(b) average cloud fraction for each
year by satellite platform;(c) cloud fraction for each of the cases described in the text; (d) same
as (c) but for a subset of the cases;(e) average LWP (f); average water vapour column. Modis
data are from the standard Terra product (see text for references and details) for year 2001, except for panel (b) which includes data for several years for Terra and Aqua.
ACPD
6, 9351–9388, 2006
Aerosol-cloud interaction inferred
from MODIS and models G. Myhre et al. Title Page Abstract Introduction Conclusions References Tables Figures J I J I Back Close
Full Screen / Esc
Printer-friendly Version Interactive Discussion
EGU North Atlantic Ocean
0 50 100 150 200 250 300 350 400 L iq u id W a te r P a th ( g /m 2)
a) b) South Atlantic Ocean Indian Ocean
MODIS
Oslo CTM2-ECMWF standard Oslo CTM2-ECMWF dry CAM-Oslo standard CAM-Oslo dry c)
South Pacific Ocean
0 50 100 150 200 250 300 350 400 L iq u id W a te r P a th ( g /m 2 )
d) e) North Pacific Ocean f) North America
South America 0 50 100 150 200 250 300 350 400 L iq u id W a te r P a th ( g /m 2 ) g) h) Australia i) Africa Europe 0 50 100 150 200 250 300 350 400 L iq u id W a te r P a th ( g /m 2 )
j) k) Asia North l) Asia South West
Asia South East
0 50 100 150 200 250 300 350 400 0.0 0.1 0.2 0.3 0.4 0.5 0.6 AOD L iq u id W a te r P a th ( g /m 2 ) m) Mediterranean Sea 0.0 0.1 0.2 0.3 0.4 0.5 0.6 AOD n) Black Sea 0.0 0.1 0.2 0.3 0.4 0.5 0.6 AOD o) Figure 7.
Fig. 7. LWP as a function of AOD (550 nm) for 15 regions. Modis data are from the standard
Terra product (see text for references and details) for year 2001. Regions defined in Fig. 2.
ACPD
6, 9351–9388, 2006
Aerosol-cloud interaction inferred
from MODIS and models G. Myhre et al. Title Page Abstract Introduction Conclusions References Tables Figures J I J I Back Close
Full Screen / Esc
Printer-friendly Version Interactive Discussion
EGU North Atlantic Ocean
0 1 2 3 4 5 W a te r V a p o u r C o lu m n (c m )
a) b) South Atlantic Ocean Indian Ocean
MODIS above clouds MODIS clear sky Oslo CTM2-ECMWF standard Oslo CTM2-ECMWF dry CAM-Oslo standard CAM-Oslo dry c)
South Pacific Ocean
0 1 2 3 4 5 W a te r V apo ur C o lu m n ( c m )
d) e) North Pacific Ocean f ) North America
South America 0 1 2 3 4 5 W a te r V a po ur C o lu mn ( c m ) g) h) Australia i) Africa Europe 0 1 2 3 4 5 W a te r V a po ur C o lu mn ( c m )
j) k) Asia North l) Asia South West
Asia South East
0 1 2 3 4 5 0.0 0.1 0.2 0.3 0.4 0.5 0.6 AOD W a te r V a po ur C o lu m n ( c m ) m) Mediterranean Sea 0.0 0.1 0.2 0.3 0.4 0.5 0.6 AOD n) Black Sea 0.0 0.1 0.2 0.3 0.4 0.5 0.6 AOD o) Figure 8.
Fig. 8. As in Figs. 7a–o, but for water vapour column.
ACPD
6, 9351–9388, 2006
Aerosol-cloud interaction inferred
from MODIS and models G. Myhre et al. Title Page Abstract Introduction Conclusions References Tables Figures J I J I Back Close
Full Screen / Esc
Printer-friendly Version Interactive Discussion
EGU North Atlantic Ocean
-0.5 0.0 0.5 1.0 1.5 2.0 Å n gs tr ø m E x ponent
a) b) South Atlantic Ocean Indian Ocean
Terra 2000 Terra 2001 Terra 2002 Terra 2003 Terra 2004 Aqua 2003 Aqua 2004 Oslo CTM2-ECMWF standard Oslo CTM2-ECMWF dry c)
South Pacific Ocean
-0.5 0.0 0.5 1.0 1.5 2.0 Å n gs tr ø m E x pon ent
d) e) North Pacific Ocean f) North America
South America -0.5 0.0 0.5 1.0 1.5 2.0 Å n gs tr ø m E x pon ent g) h) Australia i) Africa Europe -0.5 0.0 0.5 1.0 1.5 2.0 Å ngs tr ø m E x ponent
j) k) Asia North l) Asia South West
Asia South East
-0.5 0.0 0.5 1.0 1.5 2.0 0.0 0.1 0.2 0.3 0.4 0.5 0.6 AOD Å ngs tr ø m E x ponent m) Mediterranean Sea 0.0 0.1 0.2 0.3 0.4 0.5 0.6 AOD n) Black Sea 0.0 0.1 0.2 0.3 0.4 0.5 0.6 AOD o) Figure 9.
Fig. 9. As in Figs. 7a–o, but for ˚Angstrøm Exponent. Also shown are data from Oslo CTM2.
ACPD
6, 9351–9388, 2006
Aerosol-cloud interaction inferred
from MODIS and models G. Myhre et al. Title Page Abstract Introduction Conclusions References Tables Figures J I J I Back Close
Full Screen / Esc
Printer-friendly Version Interactive Discussion
33 North Atlantic Ocean
400 500 600 700 800 900 1000 C loud T op P res s u re Terra 2000 Terra 2001 Terra 2002 Terra 2003 Terra 2004 Aqua 2003 Aqua 2004
a) b) South Atlantic Ocean c) Indian Ocean
South Pacific Ocean 400 500 600 700 800 900 1000 C loud T op P res s u re
d) e) North Pacific Ocean f) North America
South America 400 500 600 700 800 900 1000 C loud T op P res s u re g) h) Australia i) Africa Europe 400 500 600 700 800 900 1000 C loud T op P res s u re
j) k) Asia North l) Asia South West
Asia South East 400 500 600 700 800 900 1000 0.0 0.1 0.2 0.3 0.4 0.5 0.6 AOD C loud T op P res s u re m) Mediterranean Sea 0.0 0.1 0.2 0.3 0.4 0.5 0.6 AOD n) Black Sea 0.0 0.1 0.2 0.3 0.4 0.5 0.6 AOD o) Figure 10.
Fig. 10. As in Figs. 7a–o, but for cloud top pressure.
ACPD
6, 9351–9388, 2006
Aerosol-cloud interaction inferred
from MODIS and models G. Myhre et al. Title Page Abstract Introduction Conclusions References Tables Figures J I J I Back Close
Full Screen / Esc
Printer-friendly Version Interactive Discussion
34 North Atlantic Ocean
400 500 600 700 800 900 1000 C loud T op P res s u re MODIS Terra 2000 MODIS Terra 2001 MODIS Terra 2002 MODIS Terra 2003 MODIS Terra 2004 MODIS Aqua 2003 MODIS Aqua 2004
a) b) South Atlantic Ocean c) Indian Ocean
South Pacific Ocean 400 500 600 700 800 900 1000 C loud T op P res s u re
d) e) North Pacific Ocean f) North America
South America 400 500 600 700 800 900 1000 C loud T op P res s u re g) h) Australia i) Africa Europe 400 500 600 700 800 900 1000 C loud T op P res s u re
j) k) Asia North l) Asia South West
Asia South East 400 500 600 700 800 900 1000 0.0 0.2 0.4 0.6 0.8 1.0 Cloud Fraction C loud T op P res s u re m) Mediterranean Sea 0.0 0.2 0.4 0.6 0.8 1.0 Cloud Fraction n) Black Sea 0.0 0.2 0.4 0.6 0.8 1.0 Cloud Fraction o) Figure 11.
ACPD
6, 9351–9388, 2006
Aerosol-cloud interaction inferred
from MODIS and models G. Myhre et al. Title Page Abstract Introduction Conclusions References Tables Figures J I J I Back Close
Full Screen / Esc
Printer-friendly Version Interactive Discussion
35 North Atlantic Ocean
0 3 6 9 12 15 C loud O p tic a l T h ic k nes s W a te r Terra 2000 Terra 2001 Terra 2002 Terra 2003 Terra 2004 Aqua 2003 Aqua 2004
a) b) South Atlantic Ocean c) Indian Ocean
South Pacific Ocean
0 3 6 9 12 15 C lo u d Op tica l T h ickn e ss W a te r
d) e) North Pacific Ocean f) North America
South America 0 3 6 9 12 15 C lo u d Op tica l T h ickn e ss W a te r g) h) Australia i) Africa Europe 0 3 6 9 12 15 C loud O p tic a l T h ic k n e s s W a te r
j) k) Asia North l) Asia South West
Asia South East
0 3 6 9 12 15 0.0 0.1 0.2 0.3 0.4 0.5 0.6 AOD C loud O p tic a l T h ic k nes s W a te r m) Mediterranean Sea 0.0 0.1 0.2 0.3 0.4 0.5 0.6 AOD n) Black Sea 0.0 0.1 0.2 0.3 0.4 0.5 0.6 AOD o) Figure 12.
Fig. 12. As in Figs. 7a–o, but for cloud optical thickness.