HAL Id: hal-02332392
https://hal.archives-ouvertes.fr/hal-02332392
Submitted on 19 Mar 2021
HAL is a multi-disciplinary open access
archive for the deposit and dissemination of
sci-entific research documents, whether they are
pub-lished or not. The documents may come from
teaching and research institutions in France or
abroad, or from public or private research centers.
L’archive ouverte pluridisciplinaire HAL, est
destinée au dépôt et à la diffusion de documents
scientifiques de niveau recherche, publiés ou non,
émanant des établissements d’enseignement et de
recherche français ou étrangers, des laboratoires
publics ou privés.
HDX-Viewer: interactive 3D visualization of
hydrogen–deuterium exchange data
David Bouyssié, Jean Lesne, Marie Locard-Paulet, Renaud Albigot, Odile
Burlet-Schiltz, Julien Marcoux
To cite this version:
David Bouyssié, Jean Lesne, Marie Locard-Paulet, Renaud Albigot, Odile Burlet-Schiltz, et al..
HDX-Viewer: interactive 3D visualization of hydrogen–deuterium exchange data. Bioinformatics, Oxford
University Press (OUP), 2019, 35, pp.5331 - 5333. �10.1093/bioinformatics/btz550�. �hal-02332392�
Structural bioinformatics
HDX-Viewer: interactive 3D visualization of
hydrogen–deuterium exchange data
David Bouyssie´
‡, Jean Lesne
‡, Marie Locard-Paulet
†, Renaud Albigot,
Odile Burlet-Schiltz and Julien Marcoux
*
Institut de Pharmacologie et de Biologie Structurale, Universite´ de Toulouse, CNRS, UPS, 31077 Toulouse, France
*To whom correspondence should be addressed
†Present address: Novo Nordisk Foundation Center for Protein Research, University of Copenhagen, 2200 Copenhagen,
Denmark
‡The authors wish it to be known that, in their opinion, the first two authors should be regarded as Joint First Authors.
Associate Editor: Arne Elofsson
Received on January 14, 2019; revised on July 4, 2019; editorial decision on July 5, 2019; accepted on July 8, 2019
Abstract
Summary: With the advent of fully automated sample preparation robots for Hydrogen–Deuterium
eXchange coupled to Mass Spectrometry (HDX-MS), this method has become paramount for
lig-and binding or epitope mapping screening, both in academic research lig-and biopharmaceutical
industries. However, bridging the gap between commercial HDX-MS software (for raw data
inter-pretation) and molecular viewers (to map experiment results onto a 3D structure for biological
in-terpretation) remains laborious and requires simple but sometimes limiting coding skills. We
solved this bottleneck by developing HDX-Viewer, an open-source web-based application that
facil-itates and quickens HDX-MS data analysis. This user-friendly application automatically
incorpo-rates HDX-MS data from a custom template or commercial HDX-MS software in PDB files, and
uploads them to an online 3D molecular viewer, thereby facilitating their visualization and
biologic-al interpretation.
Availability and implementation: The HDX-Viewer web application is released under the CeCILL
(http://www.cecill.info
) and GNU LGPL licenses and can be found at
https://masstools.ipbs.fr/hdx-viewer. The source code is available at https://github.com/david-bouyssie/hdx-https://masstools.ipbs.fr/hdx-viewer.
Contact: [email protected]
1 Introduction
By following the isotopic labeling of amide protons, which largely depends on their solvent accessibility and dynamics, Hydrogen– Deuterium eXchange coupled to Mass Spectrometry (HDX-MS) is now an established method for investigating ligand binding, pro-tein–protein interactions, protein dynamics, conformational changes and folding/unfolding. Although considered a low resolution tech-nique compared to other biophysical approaches, HDX-MS has the main advantage of not being limited in size (Sheff et al., 2017), as the proteins of interest are digested before analysis of the labeled peptides. Originating from the 90s, HDX-MS has suffered from its reputation of being poorly reproducible and hard to implement, mostly due to very time-consuming sample preparation and data
processing/analysis. Over the past 30 years, academic research suc-cessfully developed several strategies to increase the robustness and throughput of the method. Dedicated algorithms were developed to allow the automatic extraction of raw data (Kan et al., 2011;Lou et al., 2010;Pascal et al., 2012;Weis et al., 2006), their statistical analysis (Hourdel et al., 2016;Lau et al., 2019), or both (Rey et al., 2014). However, HDX-MS really gained momentum when MS manufacturers allowed its transfer to biopharma industry, thereby opening a hitherto limited market. From then, commercially avail-able pipelines including automated sample preparation, online pro-teolytic digestion and dedicated analysis software, such as DynamX (Waters) and HDExaminer (Sierra Analytics), democratized HDX-MS from a handful of specialized teams to structural HDX-MS,
VCThe Author(s) 2019. Published by Oxford University Press. 5331
This is an Open Access article distributed under the terms of the Creative Commons Attribution Non-Commercial License (http://creativecommons.org/licenses/by-nc/4.0/), which permits non-commercial re-use, distribution, and reproduction in any medium, provided the original work is properly cited. For commercial re-use, please contact [email protected]
Bioinformatics, 35(24), 2019, 5331–5333 doi: 10.1093/bioinformatics/btz550 Advance Access Publication Date: 9 July 2019 Applications Note
proteomics laboratories and eventually to industry. These develop-ments coincided with the keen interest of biopharmaceutical compa-nies toward epitope mapping (Wei et al., 2014), monoclonal antibodies and antibody-drug-conjugates structural characterization for quality control assessment (Beck et al., 2015). These all-in-one platforms shifted the methodological bottleneck from sample prep-aration to data analysis, at least concerning the extraction of the raw data.
The output of an HDX-MS experiment consists in relative deu-terium uptakes throughout the amino-acid sequence. Their mapping to 3D structures or models (when available) significantly facilitates biological interpretation. However, in most cases the outputs from the extraction data algorithms are Python scripts that need to be run on a PyMOL console. To our knowledge, MSTools (Kavan and Man, 2011) and MEMHDX (Hourdel et al., 2016) are the only web applications that enable the 3D visualization of HDX-MS data. However, both require manual reformatting of the deuteration data. Furthermore, most recent software such as Deuteros (Lau et al., 2019) or MEMHDX (Hourdel et al., 2016) are restricted to differ-ential analysis only (comparison of two states) and do not allow the visualization of all the measured peptides but only the ones passing a defined statistical threshold. We think that visualization of raw deuteration data for each single condition is a key process in HDX-MS data inspection and interpretation and should be performed alongside visualization of differential deuteration between experi-mental conditions. To provide a solution that can be readily access-ible to most HDX-MS users or neophyte collaborators, we developed a standalone tool to visualize, inspect and compare either individual (single condition) or differential (subtraction between two conditions) data from any HDX-MS software.
2 Materials and methods
HDX-Viewer is an open-source web application leveraging modern web browser features such as the recent WebGL 3D rendering API. Written using HTML5 technologies, it relies on several Javascript libraries: NGL Viewer (v2.0.0-dev.33) (Rose et al., 2018) for the 3D visualization of PDB files, MSAViewer (v1.0.3) (Yachdav et al., 2016) for the visualization of the protein sequences and gif.js (v0.2.0) for the recording of animations in the GIF format.
3 Results
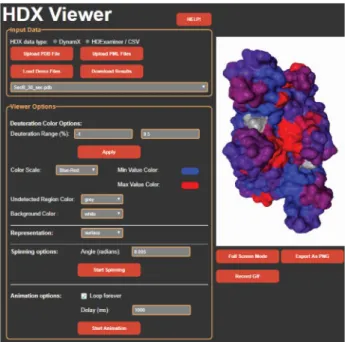
HDX-Viewer is a user-friendly online tool that does not require any programming skills to use. It generates PDB files containing the HDX-MS results for each time-point/experimental condition, and their 3D visualization allows to dynamically inspect and spot surfa-ces of interest. DynamX (PML) or HDExaminer (CSV) outputs as well as a custom template (CSV) can be uploaded with the associ-ated PDB structure in the ‘Input Data’ fields (see the help document for a detailed description of the supported input formats). HDX-MS results will then be plotted to the 3D structure on the right panel (Fig. 1). Clicking on the ‘Load Demo Files’ button displays the bind-ing interface of the ChAD peptide to the SecB tetrameric chaperone (Guillet et al., 2019) and can be used to test the application. The dif-ferent time points can be visualized independently with the embedded 3D viewer. The user can rotate the structure, tune the color scale to enhance the rendering and define the undetected regions and background colors, as well as the mode of structural representation. Animation options are also available. Finally, the protein sequence(s) appear in the bottom of the window, with the
same coloring scale as the 3D display. The resulting image/video can be exported with a simple click on the button ‘Export as PNG’ or ‘Record GIF’. We believe HDX-Viewer bridges the gap between manual curation of raw HDX data and their biological interpret-ation based on structural knowledge. Together, it facilitates and sig-nificantly quickens protein analysis using HDX-MS.
Funding
This project was supported by the Re´gion Occitanie and the French Ministry of Research: Investissement d’Avenir Infrastructures Nationales en Biologie et Sante´ program (ProFI, Proteomics French Infrastructure project) [ANR-10-INBS-08]. Novo Nordisk Foundation Center for Protein Research was sup-ported financially by the Novo Nordisk Foundation [Grant Agreement NNF14CC0001].
Conflict of Interest: none declared.
References
Beck,A. et al. (2015) Cutting-edge mass spectrometry characterization of ori-ginator, biosimilar and biobetter antibodies. J. Mass Spectrom., 50, 285–297.
Guillet,V. et al. (2019) Structural insights into chaperone addiction of toxin-antitoxin systems. Nat. Commun., 10, 1187.
Hourdel,V. et al. (2016) MEMHDX: an interactive tool to expedite the statis-tical validation and visualization of large HDX-MS datasets. Bioinformatics, 32, 3413–3419.
Kan,Z.Y. et al. (2011) ExMS: data analysis for HX-MS experiments. J. Am. Soc. Mass Spectrom., 22, 1906–1915.
Kavan,D. and Man,P. (2011) MSTools—web based application for visualiza-tion and presentavisualiza-tion of HXMS data. Int. J. Mass Spectrom., 302, 53–58. Lau,A.M. et al. (2019) Deuteros: software for rapid analysis and visualization
of data from differential hydrogen deuterium exchange-mass spectrometry. Bioinformatics. doi: 10.1093/bioinformatics/btz022.
Lou,X. et al. (2010) Deuteration distribution estimation with improved se-quence coverage for HX/MS experiments. Bioinformatics, 26, 1535–1541. Pascal,B.D. et al. (2012) Hdx workbench: software for the analysis of H/D
ex-change MS data. J. Am. Soc. Mass Spectrom., 23, 1512–1521.
Fig. 1. Screenshot of the HDX-Viewer web application
5332 D.Bouyssie´ et al.
Rey,M. et al. (2014) Mass spec studio for integrative structural biology. Structure, 22, 1538–1548.
Rose,A.S. et al. (2018) NGL viewer: web-based molecular graphics for large complexes. Bioinformatics, 34, 3755–3758.
Sheff,J.G. et al. (2017) Nanospray HX-MS configuration for structural inter-rogation of large protein systems. Analyst, 142, 904–910.
Weis,D.D. et al. (2006) Semi-automated analysis of hydrogen exchange mass spectra using HX-Express. J. Am. Soc. Mass Spectrom., 17, 1700–1703. Wei,H. et al. (2014) Hydrogen/deuterium exchange mass spectrometry for
probing higher order structure of protein therapeutics: methodology and applications. Drug Discov. Today, 19, 95–102.
Yachdav,G. et al. (2016) MSAViewer: interactive JavaScript visualization of multiple sequence alignments. Bioinformatics, 32, 3501–3503.
HDX-Viewer 5333