Is There a Crime Drop in Western Europe?
Marcelo F. Aebi&Antonia Linde
Published online: 30 October 2010
# Springer Science+Business Media B.V. 2010
Abstract Combining data from police statistics and crime victim surveys, this article analyses the evolution of crime in Western Europe from 1988 to 2007. The results show that there is no general drop in crime. Property offences and homicide have been decreasing since the mid 1990s, while violent and drug offences have increased during the period under study. These trends highlight the limits of the explanations to the crime drop in the United States, which are based on the premise of a correlation in the evolution of all offences. The drop in property offences seems related to changes in the socioeconomic situation in Europe as well as to increases in security measures in households, and the reinforcement of private security. The increase in violent offences can be explained by the combination of several factors, including changes in youth’s free time provoked by the development of the Internet, changing demographics, and the rise of episodic heavy alcohol consumption and street gangs.
Keywords Alcohol consumption . Crime drop . Crime trends . European sourcebook . International crime victim survey . Internet . Police statistics . Street gangs . Victimisation surveys . Western Europe
Introduction
Since crime rates started to fall in the United States by the mid 1990s, criminologists have been debating about the causes of that decline (Barbagli 2000; Blumstein and Wallman 2000,2006; Levitt2004; Zimring2007). The debate has recently crossed the Atlantic as there are some indications that Europe could be experiencing a similar trend (Rosenfeld and Messner 2009; Tonry 2010). However, until now, the European debate is based on the DOI 10.1007/s10610-010-9130-y
Versions of this paper were presented at the 61st Annual Meeting of the American Society of Criminology (Philadelphia, 4-7 November 2009) and at the 10th Annual Meeting of the European Society of
Criminology (Liege, 8-11 September 2010). M. F. Aebi (*)
:
A. LindeUniversity of Lausanne, CH-1015 Lausanne, Switzerland e-mail: marcelo.aebi@unil.ch
analysis of a limited number of offences, a single country or a restricted number of countries, a single measure of crime, or a narrow period of time.1The goal of this article is to bridge that gap by analyzing the different crime measures available for Western European countries for the last two decades and a variety of offences. In that way, it will be possible to answer the question that gives the title to this article: Is there a crime drop in Western Europe?
Hence, this article analyses crime trends in Western Europe from 1988 to 2007 according to police statistics and victimisation surveys. Police statistics are taken mainly from the four editions of the European Sourcebook of Crime and Criminal Justice Statistics (hereafter European Sourcebook) that cover the years 1990 to 2007 (CoE1999; Killias et al.2003; Aebi et al.2006, 2010). Victimisation data are based on the five waves of the International Crime Victim Survey (ICVS) conducted in 1989, 1992, 1996, 2000 and 2005, but providing data on the prevalence and incidence of victimisation during the year preceding the survey (van Dijk et al.2007).
In the first part of the article we describe the methodology of the research. Then, we present the trends in property offences (theft, domestic burglary, and motor vehicle theft), violent offences (assault, robbery, and homicide), and drug offences according, whenever possible, to both crime measures. In the Discussion section, we evaluate the pertinence of different criminological theories to explain the trends observed, before proposing a multifactor explanation. Finally, the main results of this research are summarised in the conclusion.
Methodology
In this section we present the databases used in the rest of the article, paying special attention to the way in which validity and reliability problems of the crime measures involved were dealt with, and to their comparability. We also identify the countries and offences included in our analyses.
Police Statistics
As we have already mentioned, our main source for police data is the European Sourcebook. Taking advantage of the fact that each new edition of the European Sourcebook includes also data for the last year included in the previous edition (for example, 2003 is included in the 3rd and the 4th edition), we were able to correct a few sudden changes in trends that were due to changes in offences definitions. For example, for England and Wales, the number of assaults recorded by the police in 2003 was 1348 according to the 3rd edition of the European Sourcebook and 37 according to the 4th one. This is due to the fact that the 4th edition includes only aggravated assault (Barclay, personal communication, June 30, 2010). As the latter represented 2.7% of the total assaults in 2003, figures for previous years (1990 to 2002) were reduced to that percentage. This procedure allows keeping the trend of the historical series and is suitable for a research interested in crime trends and not in the comparisons of crime levels between countries.2 When there were only minor differences, we kept the figures of the new editions, which are always considered as updates of the previous ones (see, for example, Killias et al.2003: 15).
1For example, Rossenfeld and Messner (2009) only analyse the evolution of burglary in nine countries
according to Eurostat statistics from 1993 to 2006. Their study also ignores the vast majority of the European criminological literature on crime trends.
2
The same method was applied to Northern Ireland and to Ireland. In the latter case, the procedure followed was opposite to the one described before as figures for 2003– and the following years – in the 4th edition were higher than in the 3rd one.
However, some countries did not participate in all the editions of the European Sourcebook. Besides, even for those who participated in all the editions, there are sometimes missing data. For these reasons, we have completed the longitudinal series of the European Sourcebook with data from the European statistics published by Eurostat (Tavares and Thomas2007,2008,2009) and with data from the United Nations Surveys on Crime Trends and the Operations of Criminal Justice Systems – UNCTS (UNODC2010). Nevertheless, before combining data from more than one source for the same country, we introduced a validation procedure by checking the comparability of the figures from both sources. When figures were not comparable, data from the external source were not included in the European Sourcebook series.
In spite of this combination of three sources of data, there are still countries for which the historical series are not complete. For that reason, we excluded from the database countries with more than three years of missing data (Belgium, Spain3and Portugal). For those who had up to three, we used linear interpolation to calculate the missing values between years, while the values of the first and last available years were repeated for the missing years at the beginning and at the end of the period (extrapolation).4This is a standard procedure for the replacement of missing data which is used, for example, by the World Health Organization for the calculation of regional averages of homicides (WHO2010a). Countries with less than one million population (Cyprus, Iceland, Luxembourg, and Malta) were also excluded because they may experiment substantial changes in crime rates from one year to another that are only due to the addition or the subtraction of a few offences. Thus, we have a complete historical series (1990-2007) for 14 countries: Austria, Denmark, England and Wales, Finland, France, Germany, Greece, Ireland, Italy, the Netherlands, Northern Ireland, Scotland, Sweden, and Switzerland (see Table1).
Being fully aware of the limitations of police statistics as measures of levels of crime, but of their potential as indicators of trends in crime (for a more detailed discussion, see Aebi2004a,
3In the case of Spain, research has shown that Spanish police statistics are currently unreliable (Aebi and
Linde2010).
4
Thus, in the case of Norway we used 1991 data for 1990, and in the cases of Denmark, Italy and the Netherlands we used 2006 data for 2007.
Table 1 Police statistics and victimisation data available by country
Country Police statistics (1990-2007) ICVS (1988, 1991, 1995, 1999, 2005)
Austria Yes —
Belgium — Yes
Denmark Yes —
England and Wales Yes Yes
Finland Yes Yes
France Yes Yes
Germany Yes —
Greece Yes —
Ireland Yes —
Italy Yes —
Netherlands Yes Yes
Northern Ireland Yes Yes
Scotland Yes Yes
Sweden Yes Yes
Theft 100.0 104.8 106.7 104.3 100.8 103.6 100.9 99.7 100.5 97.7 95.6 95.4 99.5 95.1 86.9 84.9 82.1 80.5 100.0 103.2 119.4 110.2 99.1 100.0 104.4 119.3 110.9 102.9 60 70 80 90 100 110 120 130 140 1988 1990 1991 1992 1993 1994 1995 1996 1997 1998 1999 2000 2001 2002 2003 2004 2005 2006 2007
Police statistics Prevalence of victimisation Incidence of victimisation
Fig. 1 Police recorded thefts per 100,000 population between 1990 and 2007 (Base 1990=100) and victimisation prevalence and incidence rates for theft of personal property between 1988 and 2004 (Base 1988=100) in Western Europe (Geometric means)
Domestic Burglary 107.7 107.9 77.9 75.8 77.9 79.6 74.0 67.8 66.1 65.9 100.0 99.9 100.0 100.0 85.7 89.3 95.0 80.3 103.9 104.4 99.0 90.9 111.1 104.1 89.6 94.8 106.0 103.0 40 60 80 100 120 140 1988 1990 1991 1992 1993 1994 1995 1996 1997 1998 1999 2000 2001 2002 2003 2004 2005 2006 2007 Police statistics Prevalence of victimisation Incidence of victimisation
Fig. 2 Police recorded domestic burglaries per 100,000 population between 1990 and 2007 (Base 1990= 100) and victimisation prevalence and incidence rates for domestic burglary between 1988 and 2004 (Base 1988=100) in Western Europe (Geometric means)
2008,2010), we focus our presentation on the latter. Moreover, in order to reduce the impact of changes in the data recording methods of a particular country, we do not analyse trends in each country but we consider the 14 Western European countries studied as a single cluster. Accordingly, we use the rates of offences known to the police per 100,000 population in each country to compute geometric means for Western Europe for each offence and each year.
Dodge (1993: 248-9) defines the geometric mean as the average of the nthroot of n non-negative numbers. According to the same author, the geometric mean is used in particular to calculate the average of ratios and reduces the influence of extreme values (outliers). Hence, in our analyses, the geometric mean was preferred to the arithmetic mean, which is extremely sensitive to the presence of outliers. Moreover, as the analyses are based on rates per 100,000, the geometric mean was also preferred to the median, which has been used in former articles on European crime trends (Aebi2004a,2004b; Killias and Aebi2000).5
The graphic presentation of the data (Figs.1,2,3,4,5,6and7) shows the evolution of crime rates in the form of an index based on the 1990 rates (1990=100), but the original geometric means can be found in Appendix 1.6 Finally, it must be mentioned that our calculations of geometric means and percentage changes between 1990 and 2007 are based
5Median rates have also been calculated but are not presented here. They show similar trends to the
geometric mean but more abrupt shifts in them. The latter are explained by the limited number of countries included in the analyses, which introduces sudden variations in the mean produced by changes in the rates of the country or countries placed in the middle of the distribution.
6
Minor differences with former analyses of crime trends in Western Europe (Aebi2004a,b; Killias and Aebi 2000) are explained by differences in the countries included in the analyses and the use of the geometric mean instead of the median for the calculation of the rates per 100,000 population. However, the overall trends are similar to the ones found in those analyses.
Motor vehicle theft
110.1 115.4 115.1 111.6 101.3 100.4 98.0 98.8 97.9 96.3 93.0 75.7 60.7 57.3 151.2 133.0 96.6 106.5 132.8 136.6 98.3 83.9 64.4 100 103.9 103.9 103.9 100 100 150.9 40 60 80 100 120 140 160 1988 1990 1991 1992 1993 1994 1995 1996 1997 1998 1999 2000 2001 2002 2003 2004 2005 2006 2007 Police statistics Prevalence of victimisation Incidence of victimisation Fig. 3 Police recorded motor vehicle thefts per 100,000 population between 1990 and 2007 (Base 1990= 100) and victimisation prevalence and incidence rates for car theft between 1988 and 2004 (Base 1988=100) in Western Europe (Geometric means)
1988 1990 1991 1992 1993 1994 1995 1996 1997 1998 1999 2000 2001 2002 2003 2004 2005 2006 2007
Police statistics Prevalence of victimisation Incidence of victimisation
Assault 100.0 100.3 102.2 103.6 107.2 109.9 112.9 116.3 133.9 137.2 155.4 166.3 176.8 203.0 219.4 224.7 234.3 242.7 100.0 138.4 189.1 195.0 185.2 100.0 133.2 169.3 184.5 170.0 0 50 100 150 200 250 300
Fig. 4 Police recorded assaults per 100,000 population between 1990 and 2007 (Base 1990=100) and victimisation prevalence and incidence rates for assaults and threats between 1988 and 2004 (Base 1988= 100) in Western Europe (Geometric means)
1988 1990 1991 1992 1993 1994 1995 1996 1997 1998 1999 2000 2001 2002 2003 2004 2005 2006 2007
Police statistics Prevalence of victimisation Incidence of victimisation
Robbery 100.0 111.3 116.7 114.8 107.6 108.9 112.3 106.5 111.1 121.5 132.0 137.9 142.4 132.0 127.0 122.7 120.9 115.8 100.0 129.2 148.4 154.2 167.5 100.0 131.6 129.5 201.8 156.5 60 80 100 120 140 160 180 200 220
Fig. 5 Police recorded robberies per 100,000 population between 1990 and 2007 (Base 1990=100) and victimisation prevalence and incidence rates for robbery between 1988 and 2004 (Base 1988=100) in Western Europe (Geometric means)
upon unrounded scores (i.e. they include all decimals that could not be shown in the printed versions of the European Sourcebook).
Victimisation Surveys
Regarding the ICVS, we included in our analyses the nine countries that participated in at least four of its five waves by interpolating or extrapolating, whenever that was necessary, the data for the missing wave. The logic of the interpolations and extrapolations is the same that has just been explained for police statistics. For example, in the case of Sweden, which did not participate in the first wave of the survey (1989), we performed an extrapolation by using for that wave the figures of the second wave (1992).
As data from police statistics are expressed as an incidence rate (geometric mean of the number of offences per 100’000 population), it could seem that the logic ICVS measure for the comparison would be the last year incidence rate. The incidence rate used in the survey is expressed as the number of incidents per 100 population. However, for offences such as car theft and domestic burglary, the validity of that rate is doubtful since the counting unit is not the person but the household. For example, for car theft, the question included in the survey asks whether the respondent or other members of his/her household have had any of their cars, vans or trucks stolen (van Dijk et al.2007: 200). For such offences, it would have been more appropriate to compute the incidence rate per 100 households. Moreover, in the case of car theft, it would also have been interesting to take into account the motor vehicle park of each country.7For these reasons, we have also included in our analyses the victimisation prevalence rates,
7The same is true for police statistics on motor vehicle theft (for details on this topic, see Aebi2004a).
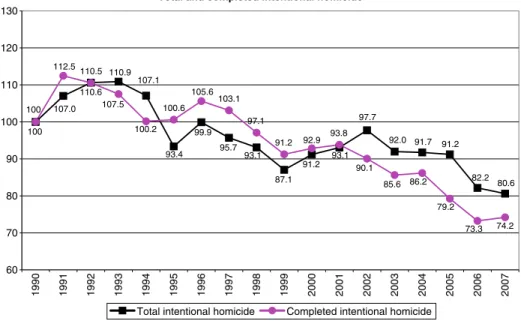
Total and completed intentional homicide
95.7 87.1 91.2 110.5 100.6 103.1 93.8 93.1 93.1 99.9 93.4 107.0 107.1 92.0 91.7 82.2 80.6 97.7 110.9 91.2 110.6 100 86.2 112.5 100.2 92.9 91.2 97.1 105.6 107.5 85.6 74.2 90.1 79.2 73.3 100 60 70 80 90 100 110 120 130 1990 1991 1992 1993 1994 1995 1996 1997 1998 1999 2000 2001 2002 2003 2004 2005 2006 2007 Total intentional homicide Completed intentional homicide
Fig. 6 Police recorded intentional homicides (including and excluding attempts) per 100,000 population between 1990 and 2007 (Base 1990=100) in Western Europe (Geometric means)
expressed as the percentage of the total number of households participating in the survey that have been victimised.
Taking into account that the victimisation survey measures refer to last year prevalence and incidence rates, the years studied are indeed 1988, 1991, 1995, 1999 and 2004. As it was the case with police statistics, we have calculated the Western European rates for each year using the geometric mean for the cluster of nine countries included in the study. The graphic presentation of the data (Figs.1,2,3,4and5) shows the evolution of victimisation rates in the form of an index based on the 1988 rates (1988=100).
All in all, we have a complete historical series (1988-2004) for nine countries: Belgium, England and Wales, Finland, France, the Netherlands, Northern Ireland, Scotland, Sweden, and Switzerland (see Table 1). Exceptionally, Switzerland has not been included in the analysis of the incidence of theft of personal property because the country did not provide incidence rates for that offence in the 2000 and 2005 surveys.
Countries and Offences Included in the Analyses
Table1summarises the data available for each country and each source. For eight of the 14 countries for which police statistics are available, victimisation data are also available.8In the case of Belgium, only survey data are available.
Table1suggests that there are at least two possibilities for the presentation of the trends observed with both crime measures: The first one is to compare only the eight countries for which both sources are available; the second one is to present trends according to police statistics for 14 countries and according to victimisation surveys for nine countries. We have chosen the second option because, leaving aside the fact that the annual rates observed
8
England and Wales, Finland, France, the Netherlands, Northern Ireland, Scotland, Sweden, and Switzerland. Drug offences 100.0111.3 127.4136.6 148.6 135.9147.0 167.1179.8 191.0 235.2 244.1 262.8275.7 277.7 294.3 291.9300.6 0 100 200 300 400 1990 1991 1992 1993 1994 1995 1996 1997 1998 1999 2000 2001 2002 2003 2004 2005 2006 2007 Police statistics
Fig. 7 Police recorded drug offences per 100,000 population between 1990 and 2007 (Base 1990=100) in Western Europe (Geometric means)
with only eight countries are more instable, a comparison of the trends observed with both procedures showed no major differences in the general evolution of the offences studied. This finding confirms former research showing that, even if it is possible to find local differences, there are global similarities that support the use of the concept of Western European crime trends (Aebi 2004a). By presenting trends in 14 countries according to police statistics, we also guarantee the representation of the great majority of countries of the subcontinent.
Finally, as far as victimisation surveys are concerned, the offences included in our analyses are assault and threats, robbery, theft of personal property, car theft, and domestic burglary.9The victimisation rates of these five offences are compared to the police recorded crime rates for assault, robbery, theft, motor vehicle theft, and domestic burglary. Police statistics also provide data for intentional homicide (including and excluding attempts) and drug offences.10At the beginning of each chapter including a comparison of data from both measures, we present the definitions applied by each source and discuss their convergences and divergences. Comparing 12 European countries, previous research (Aebi et al.2002) has shown some strong correlations between ICVS data–weighted according to reporting rates– and police data included in the European Sourcebook for offences whose survey and police definitions are similar, such as car theft (.73), domestic burglary (.86), personal theft (.74), robbery (.45), and assault (.76).11Using a different methodology, van Dijk (2008; van Dijk et al.2007: 107) found weaker correlations.
Property Offences
In order to illustrate trends on property offences, in the following chapters we present the evolution of theft, domestic burglary, and motor vehicle theft.
Theft
According to the standard definition proposed by the European Sourcebook, theft means “depriving a person or organisation of property without force with the intent to keep it” (Aebi et al.2010: 361). As a rule, figures include minor theft, burglary, motor vehicle theft, theft of other items, and attempts; but they exclude embezzlement, robbery, and receiving or handling stolen goods.
The ICVS also distinguishes thefts with and without violence. Questions on theft with violence (robbery) are asked first and are followed by the next question:“Apart from theft involving force there are many other types of theft of personal property, such as pickpocketing or theft of a purse, wallet, clothing, jewellery, sports equipment. This can
11Correlations shown are rank-order correlations (Spearman’s rho). The comparison was cross-sectional,
covering countries for which ICVS data and Sourcebook data were available for 1999. The 12 countries compared included the eight countries for which both sources are presented in this article (England and Wales, Finland, France, the Netherlands, Northern Ireland, Scotland, Sweden, and Switzerland) as well as Belgium and Denmark for which, currently, only one source of data is available for the whole period studied (Aebi et al.2002).
9
It was beyond our means to access the five databases and combine different offences for each country and each survey in order to improve comparability with police statistics (e.g. add car theft and motor vehicle theft according to the survey before comparing them with motor vehicle theft according to police statistics).
10
Rape was not included in the analyses as its definition deviates widely from the definition of sexual incidents used in the ICVS (Aebi et al. 2002). However, their evolution according to police statistics is presented in Appendix1.
happen at one's work, at school, in a pub, on public transport, on the beach, or in the street. Over the past five years have you personally been the victim of any of these thefts?” (van Dijk et al.2007: 202).
The comparison of both definitions shows that the one used in the ICVS (theft of personal property) is narrower than the one used in the European Sourcebook. The latter includes thefts of and from cars, theft of motorcycles and bicycles, and domestic burglary, which are covered by other questions in the ICVS. The comparison also shows that both the European Sourcebook and the ICVS align themselves with the classification of offences used by countries that apply the common law legal system. That system considers theft with violence as a violent offence. On the contrary, the continental countries of Western Europe follow mainly a legal system based on the civil law, which finds its roots in the Roman law, and considers theft with violence as a property offence.
Trends in theft and theft of personal property are presented in Fig.1. Police statistics show an increase at the beginning of the series which leads to a peak in 1992. This is followed by a slow but constant curvilinear decrease until 2003. Since then, the decrease becomes more pronounced. Thus, in 2007, the rate of thefts per 100,000 population had decreased by almost 20% compared to 1990.
The trend in thefts according to the ICVS shows some resemblance with the one observed in police statistics. We can also see an increase at the beginning of the series, with a peak in 1995, followed by a constant decrease. The theft rate in 2005 was comparable to the one in 1988.
In sum, we can say that in Western Europe thefts increased at the beginning of 1990s and decreased from the middle of that decade. The decrease was revealed first by police statistics–according to which it began in 1993– and then –after 1995– by the victimisation surveys. Besides, this decrease is more pronounced according to police statistics than according to victimisation surveys.
Domestic Burglary
According to the standard definition proposed by the European Sourcebook, domestic burglary means “gaining access to private premises by the use of force with the intent to steal goods” (Aebi et al.2010: 364). As a rule, figures include theft from attic, basements and secondary residences as well as attempts; but they exclude thefts from factories, shops, offices, detached garages, sheds, barns, stables, and fenced meadows.
The relevant question in the ICVS is the following:“Over the past five years, did anyone actually get into your home or residence without permission and steal or try to steal something? I am not including here garages, sheds or lock-ups” (van Dijk et al.2007: 201). The interviewer instructions ask to exclude burglary of second houses.
The exclusion of second houses in the ICVS should not introduce major distortions in the comparison of both data sources because the percentage of second house owners is relatively low and, if such houses are located in foreign countries, they will not be included in the police statistics of the country of residence of the respondent if they are burglarised. Indeed, the main difference between both definitions is that the European Sourcebook includes attempts while in the ICVS attempts are covered by another specific question. In that context, one must take into account that, in continental Western European countries that apply civil law legal systems, usually domestic burglary is not a legal category on its own, but an aggravated theft or a combination of different legal dispositions including breach of domicile, theft and, eventually, property damage. Hence, police data on domestic burglary are heavily influenced by the national police reporting and recording practices, in particular as far as the recording of attempts is concerned. For example, the presence of damages to
locks, door or windows–mentioned in the ICVS question on attempted burglary (van Dijk et al.2007: 202)– will seldom be enough for some police forces to record the case as an attempted burglary. In addition, according to the figures of the 2005 ICVS (van Dijk et al. 2007: 266), only 38% of the attempted domestic burglaries are reported to the police, compared to 74% of the completed ones. Thus, the inclusion of attempts in survey data would have introduced more distortions in the comparison than their exclusion.
Trends in domestic burglary are presented in Fig.2and are quite similar to the ones observed for theft (Fig.1). They also show an increase at the beginning of the series followed, since the mid-1990s, by a decrease that was only temporarily interrupted at the beginning of the 2000s. Once more, police statistics anticipate the trends that can be observed in both indicators. The peak in police statistics is registered in 1993, while in victimisation surveys it is observed in 1994. A slight increase is registered in police statistics in 2003, while in victimisation surveys it appears in 2004. Unfortunately, the lack of victimisation data after 2004 prevents us from testing whether the drop in police statistics is corroborated by the survey. According to police statistics, the rate of domestic burglary in 2007 was 34% lower than in 1990. The ICVS suggests that the trend was not homogeneous, with a few countries experiencing a decrease and others an increase between 1999 and 2004 (van Dijk et al.2007: 237-240).
Motor Vehicle Theft
According to the standard definition proposed by the European Sourcebook, theft of a motor vehicle means“depriving a person or organization of a motor vehicle with the intent to keep it or to use it” (Aebi et al. 2010: 362). As a rule, figures include joyriding and attempts; but they exclude theft of motorboats and receiving or handling a stolen vehicle.
The relevant question in the ICVS is the following:“Over the past five years, have you or other members of your household had any of their cars, vans or trucks stolen” (van Dijk et al. 2007: 200). The main difference between both definitions is that police statistics includes motorbikes while the ICVS excludes them.
Trends in motor vehicle theft and car theft are presented in Fig.3. They are similar to the ones observed for the rest of property offences (Figs. 1 and 2). According to police statistics, motor vehicle theft increased in the early 1990s, reaching a peak in 1992 followed by a decrease that led the rates to be stable and comparable to the 1990 rate during the second half of the 1990s. Then, after a slight increase in 2000, the rates started decreasing swiftly, in such a way that in 2007 the rate of motor vehicle theft was 43% lower than in 1990. Victimisation incidence rates followed an analogous trend, while prevalence rates showed an anomalous decrease in 1999.
Violent Offences
In this section, we examine the evolution of violent offences, represented by assault, robbery and homicide.
Assault
In this article –as well as in the European Sourcebook– assault is considered as a synonym of bodily injury. The question included in the ICVS concerns both assaults and threats: “Apart from the incidents just covered, have you been personally attacked or threatened by someone in a way that really frightened you, either at home or
elsewhere, such as in a pub, in the street, at school, on public transport, on the beach, or at your workplace?” (van Dijk et al. 2007: 203). The interviewer instructions ask to include domestic assaults.
In contrast, police statistics only include assault which, according to the standard definition of the European Sourcebook, means“inflicting bodily injury on another person with intent” (Aebi et al.2010: 350-1). As a rule figures include minor assault, aggravated assault, assault of a public servant, domestic violence, and attempts; but they exclude assault leading to death, threats, assault only causing pain, slapping, punching, and sexual assault.
Trends in assaults and threats are presented in Fig. 4. According to police statistics, assaults recorded by the police have more than doubled during the period considered. Concretely, they increased by 143% between 1990 and 2007. Victimisation data indicate that assaults and threats almost doubled between 1988 and 1999, before undergoing a slight decrease in 2004. That year, their prevalence was 85% higher than in 1988, while the increase in their incidence was of 70% during the same period.
Robbery
According to the standard definition proposed by the European Sourcebook, robbery means “stealing from a person with force or threat of force” (Aebi et al. 2010: 360). As a rule, figures include muggings (bag-snatchings), theft immediately followed by force or threat of force used to keep hold of the stolen goods, and attempts; but they exclude pick-pocketing, extortion, and blackmailing.
The relevant question in the ICVS is the following:“Over the past five years has anyone stolen something from you by using force or threatening you, or did anybody try to steal something from you by using force or threatening force” (van Dijk et al.2007: 202). As it can be seen, in principle there are no major differences between both definitions.
Trends in robberies are presented in Fig.5. According to police statistics, they increased at the beginning of the 1990s, remained more or less stable during the mid-1990s, and started increasing by the end of the decade until reaching a peak in 2002. Robberies have been decreasing from 2003 to 2007, but the rate for 2007 is still 16% higher than in 1990. Robbery victimisation prevalence rates followed a steady upward trend that led to an overall increase of 68% from 1988 to 2004. Incidence rates also show an overall increase of 57% in robberies, although they register an impressive peak in the number of robberies in 1999.
Homicide
According to the standard definition proposed by the European Sourcebook, intentional homicide means “intentional killing of a person” (Aebi et al. 2010: 349). In principle, figures include assault leading to death, euthanasia, and infanticide; but they exclude assistance with suicide. Attempts are included in the total and excluded in the category of completed intentional homicide. The total rate of intentional homicides is completely inappropriate for cross-national comparisons of crime because the percentage of attempts varies widely from one country to another (Aebi 2010); however, it can be used for the comparisons of trends.
Trends in intentional homicide are presented in Fig. 6. Their evolution is similar to the one observed for property offences. Indeed, trends in homicides match almost entirely the trends in thefts. After an increase in the early 1990s, homicides followed a curvilinear but overall downward evolution until the beginning of the 2000s, when they started decreasing in a more steady way. It is interesting to point out that a comparison of the
geometric mean rates presented here with the median rates used in other publications (Aebi2004a), shows that the latter give the impression of a more stable situation during the 1990s, especially as completed intentional homicides are concerned. This is due to the fact that the rates per 100,000 population are quite low, oscillating during the whole 1990s from a minimum median rate of 1.4 to a maximum of 1.7; only by the end of the series, in 2006-7, they reached a minimum of 1.1.
Drug Offences
The ICVS being a victimisation survey, it does not measure the evolution of drug use or drug trafficking. It is true that in some waves there was a question on the exposure to drugs in the neighbourhood of residence, but it does not allow us to establish a complete historical series. The only data available come from police statistics and are presented in Fig.7.
The European Sourcebook does not provide a precise definition of the total number of drug offences, indicating that the definition “is fairly uniform through international conventions” (Aebi et al.2010: 371). In principle, figures include consumption, cultivation, production, sale; supplying; transportation, importation, exportation, and possession of large and small quantities of drugs as well as the financing of drug operations. It can be seen in Fig.7that drug offenses increased constantly during the period under study.
Discussion
In this section, we will try to give an explanation to the trends observed in previous chapters. We start with a discussion of methodological issues that could affect such trends. Then we analyse the pertinence of the explanations provided by classical criminological theories and by accounts of the recent evolution of crime in the United States. Finally, we propose a multifactor explanation to these trends.
Methodological Issues
The first threat to the internal validity of this kind of studies is that the trends observed could be an artefact due to the lack of validity of police statistics as measures of crime. However, the relative convergence between police statistics and victimisation surveys does not provide empirical support to that criticism. Indeed, whenever there are differences between both measures, they concern the last period of the series. These discrepancies could be due to the fact that victimisation data are only available until 2004. A sixth victimisation measure in 2008 would have been necessary in order to have a complete view of the recent evolution in victimisation trends.
We can therefore accept as a premise that, roughly, property offences and homicides increased at the beginning of the 1990s and have been decreasing since the mid-1990s; while drug offences and the rest of violent offences increased more or less constantly since 1990.12This leads to a first conclusion: In the United States there has been a drop in crime since 1992 that concerns all offences (Blumstein and Wallman 2000,2006; Levitt 2004; Zimring2007); on the contrary, in Europe, crime trends vary by type of offence.
12
According to police statistics, the rates of rape followed a constant upward trend during the period under study. The rate for 2007 was 103% higher than the one for 1990 (see Appendix1).
Traditional Explanations of Crime Trends
Increase in Reporting Rates
An argument often invoked to explain the increase of police recorded assaults consists in considering that it is due to an increase in the percentage of violent offences reported to the police (i.e. an increase in reporting rates). There would be a trend towards more denunciation because our societies would have become more sensitive to violence. This argument finds its original source in the thesis of the civilizing process (Elias1997/1939). For example, according to Muchielli (2010: 813),“our society no longer tolerates violence, no longer considers it legitimate or meaningful. Our threshold of tolerance is lower and lower […]. The result is that interpersonal violence that is not new is now denounced”.
This is a seductive line of reasoning. Paraphrasing Martínez (2004: 176), when referring to the aesthetics of reasoning, one could say that it has the strength of conviction of an attractive argument. However, most of the time, this argument is not accompanied with data that would provide it with the necessary empirical support. Coincidentally, the ICVS provides information on reporting rates expressed as the percentage of offences reported to the police. The evolution of the reporting rates for assaults and threats is presented in Fig.8 using, as in the rest of this article, the geometric mean as a measure of central tendency.13 Figure 8 shows that reporting rates for assault and threats remained relatively stable during the period studied. The increase from 34.3% in 1988 to 35.3% in 2004 –after reaching 37% in the 1990s– is insignificant, particularly when compared to the increase of 85% in the victimisation prevalence for assaults and threats during the same period, and to the increase of 143% in police recorded assaults between 1990 and 2007. As a consequence, the hypothesis arguing that the increase in violent offences is due to an
13
The authors wish to thank John van Kesteren, who provided them with the figures required to calculate these rates (van Kesteren, personal communication, October 14, 2009).
Reporting rates (in %) for assaults and threats
36.9 35.3 36.3 34.3 37.0 30 32 34 36 38 40 1988 1991 1995 1999 2004 Western Europe
Fig. 8 Reporting rates for assault and threats between 1988 and 2004 according to the ICVS (Geometric means)
increase in the reporting rates of such offences is falsified by empirical data. This means that, in principle, we are facing a real increase in assaults.
In that context, one could still suppose that the increase is more pronounced in police statistics than in victimisation surveys because there has been an upward trend in the reporting of incidents of domestic violence. Indeed, even if such incidents are included in the ICVS under the general heading of assaults, it could be objected that they would require a specific survey in order to be measured in a more valid way. In that context, the International Violence Against Women Survey– IVAWS (Johnson et al.2008) is the only source available, but it has been conducted only once and therefore it is impossible to establish trends in reporting rates of domestic violence.
Classical Criminological Theories and Explanations of the American Crime Decline
In order to explain the crime trends observed in Western Europe, it seems appropriate to confront them with the explanations provided by traditional criminological theories such as strain, social learning, control, and labelling theory. However, it is always problematic to apply such theories at the macro-level; furthermore, macro-sociological theories are seldom falsifiable (Chamlin and Cochran 2007; Lenski1988). However, the contradictory crime trends observed in Western Europe simplify the latter task.
For example, one could argue that in, contemporary developed societies, the population is confronted to an anomic situation in which the material goods offered are unlimited, but the economic resources are limited. This situation would generate strain or stress that could lead to delinquency. But if that is the case, one should predict an increase both in violent and in property offences and not, as in Western Europe, an increase in the first ones and a decrease in the second ones. The same reasoning could be applied to control theory (Hirschi1969). If the bonds between individuals and society become weak or break, it is difficult to explain why these individuals would choose to engage in violent offences instead of in property offences. Even more complicated is trying to apply theories that are closer to psychology, such as self-control theory (Gottfredson and Hirschi 1990), to macro-social developments. It is difficult to conceive–and even more difficult to measure– a general increase or decrease in the level of self-control of the majority of the members of a society. But even if it was possible to measure such evolution, how could the contradictory trends in the offences committed be explained? Only opportunity based theories, which are extremely flexible– and therefore also difficult to falsify–, could eventually explain these trends, and that is the reason why they will be taken into account in the following section.
In brief, classical criminological theories are unable to explain the recent crime trends in Western Europe. The same is true for the explanations provided by several researches to the crime drop in the United States. On the one hand, these explanations cannot be easily extrapolated to the European context. For example, Europe never faced a crack epidemic, a factor often invoked as one of the major causes of the increase and subsequent decline of American crime rates (Blumstein and Rosenfeld 1998; Levitt 2004). On the other hand, American explanations start from the premise that all offences are shifting in the same direction. For example, if an increase in imprisonment should have an influence on the crime rates (Levitt1996), it is difficult to understand why this influence should be exerted on certain crimes and not on others. The same logic can be applied to explanations based on the legalisation of abortion (Donohue and Levitt2001), the increase in the number of police officers (Levitt 2004) or the changes in demographics and economic opportunities (for these and other explanations, see Blumstein and Wallman 2000,2006). All these factors were also present in Europe, but did not play the same role as in the United States on the
evolution of crime. Once more,“Europe illustrates the limits of the American experience” (Killias and Aebi2000).
Explaining Crime Trends in Western Europe
Our explanation of crime trends in Western Europe is based on a combination of factors that affect property, violent and drug offences in different ways. This explanation is inspired by opportunity-based theories.
Explaining Trends in Property Offences
The evolution of property offences should be analyzed in the framework of the political and socioeconomic changes that took place in Europe during the period studied. As has been previously reported (Aebi2004a; Killias and Aebi2000), the increase in property offences at the beginning of the series seems related to the collapse of the Soviet Union. The fall of the Berlin wall, in November 1989, introduced a substantial modification of crime opportunities by connecting two parts of the continent that differed drastically in terms of wealth. Within a few months, a substantial market for stolen products emerged in Central and Eastern Europe. This led to the development of organised gangs that took advantage of the new paths for the transportation of drugs, illegal goods or commodities, and even human beings, between both sides of the continent. In that context, the increase in of property offences registered in Western Europe at the beginning of the 1990s seems quite logical, and adjusts itself to the predictions of an opportunity-based theory such as the routine activities approach (Cohen and Felson1979; Felson and Boba2010).
The subsequent decrease could be explained by the combination of five factors, of which three have already been identified by earlier research (Aebi2004a): The saturation of the black market in Central and Eastern Europe, the positive socioeconomic outcomes for Central European countries of the successive enlargements of the European Union, the reinforcement of police measures against transnational crime at the borders of the EU, the improvement of security measures in Western European households, as well as the massive increase in private security in Western Europe.
Some of these factors are related to the overall socioeconomic evolution of Europe. In many Central and Eastern European countries, the economic situation clearly improved between 1990 and 2007. This improvement was particularly pronounced in the countries that joined the European Union. Indeed, between 1995 and 2007, the main economic indicators (gross domestic product, industrial production, and employment) grew constantly in the 27 EU member states (Eurostat 2010a). This improvement is confirmed by other indicators. For example, the number of car owners in Central and Eastern European countries increased sharply between 1980 and 1990 and has continued to rise constantly since then (Pucher and Buehler2005). In this way, the black market virtually disappeared in the countries that joined the EU. For stolen cars, that market moved further to the East (Gerber and Killias2003).
At the same time, the reinforcement of police measures at the borders of the EU made more difficult the transportation of illegal good and commodities. In that context, the Schengen Agreement has played a major role. Signed in 1985 by five countries, it was amended in 1990, 1997 and 2007 when the only EU member states where it was not applied were Bulgaria, Cyprus, Ireland, Romania and the United Kingdom. The Schengen agreement abolishes border controls between signatory states, which are members of the Schengen area, but reinforces the controls in the external borders of such area. Making a
Chomskyan analysis of the evolution of the terminology used in the Agreement, one must point out that it is not a coincidence if the Treaty of Amsterdam of 1997 defines the Schengen area as an“area of freedom, security and justice” (italics are ours).
Data from the ICVS corroborates that this concern over security also affected individuals, as the percentage of households with burglar alarms, special door locks and other security measures has constantly increased from 1988 to 2007 (Lamon2002; van Dijk et al.2007). Another example can be found in the Netherlands, where, since 1999, some security measures became compulsory in new buildings. The new legislation was accompanied by a decrease of 7% in burglary rates; in particular, the burglary victimisation rate in new houses was a quarter lower than in the older ones (Vollaard2010, quoted by van Dijk 2010). Security measures have also been multiplied in commercial stores, reducing thus the likelihood of shoplifting.
Finally, private security grew in an impressive way within the EU, especially since the 1980s. According to de Waard (1999), the number of private security companies in the Netherlands rose from 4,348 in 1981 to 19,306 in 1997. In Spain, the number of employees in private security companies increased from 88,916 in 1999 to 202,906 in 2008 (MIR 2000,2009). For the whole European Union, de Waard (1999) estimated that the number of employees in private security was 600,000 in 1999. In 2004, with the EU enlargement and the increase in the number of employees in the existing member countries, this figure had exceeded one million (van Steden and Sarre2007). Thus, between 1999 and 2004, the ratio between police and private security guards increased from 1 to 0.43 to 1 to 0.71 (van Steden and Saare2007).
Explaining Trends in Violent Offences
Homicide and Assault
Western European countries are among those with the lowest completed homicide rates in the world (LaFree 1999: 138-9). With an average rate of 1.2 completed homicides per 100,000 population in this region in 2007, one could even speculate that homicides in Western Europe have reached a sort of minimum threshold; therefore, it is difficult to imagine a drastic decrease of them in the near future. This low rate could be explained by the absence of major social conflicts –indeed, even if there are signs of a crisis in the welfare state (Garland 2001: 76, 93-4), the general Western European situation in this respect is far better than in the rest of the world–, the relatively low and stable rates of firearms possession in Western European households (Killias et al.2001) and the quality of the health services.
In this context, at a global level, approximately 60% of all homicides are committed with firearms, but this rate varies from 77% in Central America to 19% in Western Europe (Geneva Declaration Secretariat2008: 5). Thus, in the latter region, it is likely that some cases of assault could have led to a homicide if a firearm was available. This provides an additional explanation to the paradox between the recent decline in homicides and the steady increase in assaults.
For example, according to the review of the literature of Cook and Moore (1999), a robbery is three times more likely to result in the victim’s death in the presence of a firearm than in the presence of a knife, and ten times more than in the presence of another weapon. The presence of a firearm also has a clear influence on the fatal outcome in cases of assault and domestic violence (Cook and Moore 1999: 281, with references). For the latter, the situation varies greatly by region. In high-violence countries, women account for about
10% of the victims of homicide; while in low-violence countries –such as the Western European ones– they represent up to 30%, suggesting that intimate partner violence is not related with other forms of armed violence (Geneva Declaration Secretariat2008: 5).
Another factor that plays a major role on the fatal outcome in cases of assault is the quality of the health services provided to the victim. In the United States, Harris et al. (2002) have drawn attention to the fact that, despite the proliferation of increasingly dangerous weapons and the very large increase in the rates of serious criminal assault since 1960, the lethality of such assaults dropped drastically between 1960 and 1999. According to the same authors, this paradox is explained by the developments in medical technology and related medical support services. Without such developments, the United States would probably have had an upward trend in the lethality of the assaults instead of a downward one (Harris et al.2002). As it has already been pointed out (Aebi2004a), the situation is similar in Europe, where research shows a massive reduction in mortality during the 20th century (Eurostat2003: 9) and a net improvement in the quality of health services between 1970 and 2001 (Eurostat 2002). Currently, it is estimated that, for every death in the European region, there are 20-40 hospital treatments (Sethi et al.2006). The fact that the decrease in the rates of completed intentional homicide (-26%) is more pronounced than the one in the rates of attempted homicide (-16%) gives some empirical support to this hypothesis.14 In the same line, one could mention that, in England and Wales, hospital admissions for assault by a knife or sharp weapon increased by 34% among all ages–and by 50% among those aged 13-19– between 2002 and 2007 (WHO2010b: 20). In Scotland, homicide using knives and sharp implements rose by 164% between 1982 and 2002 while the general increase for homicide was 83% during the same period (WHO2010b: 20).
At the same time, any explanation of the trends in violent offences must take into account the role played by youth in such type of offences. Indeed, research has repeatedly demonstrated that youths are overwhelmingly overrepresented among authors of crime and, in particular, of violent offences (see, for example, the review of Farrington 2003, and Sampson and Laub 2003). As a consequence, in order to explain the trends observed in violent offences, we will pay particular attention to the changes in youths’ lifestyle introduced by the development of the Internet, in youths’ alcohol consumption patterns, as well as to the changes in the ethnic composition of the young European generations.
The massive development of the Internet began in the 1990s; thus, it is parallel to the time period studied in this article. Indeed, the increase in the number of internet users during that period is outstanding. In 1990, across the world, there was less than 1 user per 1000 population, while in 2007, among the 15 countries included in our analysis, 13 had more than 55 users per 1000 population and some–like the Netherlands and Sweden– had even more than 80 (World Bank 2010). In the same perspective, according to Eurostat (2008), only between 2006 and 2008, the number of households with Internet access in the 27 member states of the European Union increased from 49% to 60%, while the number of households with a broadband connection increased from 30% to 48%.
This development introduced a lifestyle change that affects the whole population, but in particular young people, and more specifically their use of leisure time. Compared to 1990, currently youths spend a lot more time at home in front of their computers, connected to virtual social networks, online games and a variety of electronic communication tools. This means that they spend less time in the streets and in public places; therefore they are less
14
In 1990, completed homicides represented 33.6% of the total homicide rates; in 2007, they represented 31%.
likely to participate in unstructured and unsupervised activities with peers, which increase the likelihood of being in situations conducive to crime (Agnew 2009: 183, with references).
However, at least for now, the use of Internet is not distributed evenly across the population. For young people, access to a computer and a broadband connection is conditioned by the socioeconomic status of the family of origin. Thus, youths who spend less time in public places are those with a medium or high socioeconomic status. In this way, they have fewer opportunities to engage in conventional property and violent offences. But, at the same time, they have more opportunities to engage in computer related offences (i.e. non-conventional offences) such as illegal downloading of data or programs, hacking, illegal interception of private communications, data or system interference, credit card or computer fraud. Computer related offences have been included only in the 4th edition of the European Sourcebook and therefore it is impossible to establish time series since 1990 for them (Aebi et al. 2010: 55; Jehle and Harrendorf 2010: 131-42). At the same time the staggering increase in such crimes registered by most national police statistics largely reflects the growing interest in this type of crimes, but not necessarily their actual evolution. This uneven access to the Internet implies that, currently, among youths spending a lot of time in the streets and in public places–who are therefore more likely to join a street gang or to participate in unstructured and unsupervised activities with peers– there is an overrepresentation of those with a low socioeconomic status. Among them, youths from ethnic minorities are also overrepresented because such minorities have systematically a lower socioeconomic status than the native population.
At the same time, one must take into account that Western “European countries have many youths who are second-generation ethnic minorities, and their number has increased in the last decades” (Weerman and Decker2005: 306). Demographic data from Eurostat
(2010b) confirms that foreign citizens are on average younger than natives in all EU
member countries included in our analysis. For the 27 EU member states, the median age of foreigners is 34.3 years; while among the natives it is 41.2 years (Eurostat2010b).
In this perspective, some of the conclusions of the review on gang studies in 12 European countries conducted by Klein, Weerman and Thornberry (2006) are particularly relevant: (a) European street gangs are “primarily composed of ethnic or national minorities, reflecting the immigration and refugee patterns of those countries” (p. 421); (b) “in most European settings, the development of street gangs has been so recent that groups with durations of more than 10–15 years have not had a chance to stabilize” (p. 421); (c)“compared with nonmembers, gang members have substantially higher rates of violence, engage in more serious forms of violence and are more apt to use weapons (p. 433); (d)“the relationship between violence and being in a gang gets stronger for more serious types of violent offences” (p. 427); (e) “the most common form of violence in European gangs appears to be physical fighting” (p. 433); (f) European street gangs show less serious levels of violence than street gangs in the USA, a difference that “may be attributable to the recentness of the European gang development, the lower levels of firearms availability, and lower levels of gang territoriality in Europe” (p. 413). Similarly, Weerman and Decker (2005: 306) reviewing a series of European street gang studies conclude that“it is obvious that this book has demonstrated in particular the important role of immigration and ethnicity for European gangs and troublesome youth groups”.
In sum, the available research on European street gangs corroborates their recent nature, their involvement in violent behaviour, and their ethnic composition. Therefore, the development of these gangs seems to be one of the key factors explaining the increase in the level of violence in Western Europe during the 1990s and the 2000s. As we have
mentioned before, and as it is also confirmed by the research reviewed, homicides are not concerned because the fatal outcome often depends on the presence of firearms, which are not widespread in Europe.
The scientific literature has also established that there is a strong association between alcohol consumption and violent behaviour (WHO 2004a, 2005). Alcohol consumption precedes violent events, and the amount of alcohol consumed is related to the severity of the violent events. This relationship seems due to the effects of alcohol on serotonin and brain receptors that reduce fear and anxiety of the consequences of ones action, as well as to its effects on cognitive functioning that affect the resolution of conflict situations and exacerbates emotional responses (WHO 2004a: 47, with references).
Evolution of alcohol use in Europe is available from 1961 to 2001 for most Western European countries, but figures are not breakdown by age (WHO 2004b). Regarding adolescents, information is available through the various waves of the European School Survey Project on Alcohol and Other Drugs – ESPAD (Hibell et al. 2009). This survey confirms that the percentage of adolescent students aged 15-16 involved in heavy episodic drinking (having five or more drinks on one occasion, also known as binge drinking) during the 30 days preceding the data collection has increased between 1995 and 1999 and between 2003 and 2007. During this latter period, 15 countries have registered an increase. On average, the percentage of girls involved in such episodes increased, narrowing the gap with boys. In 2007, on average, 43% of the students interviewed in the survey admitted that they had been involved in episodes of heavy drinking during the past 30 days. This behaviour was more prevalent among boys (47%) than among girls (39%) (Hibell et al. 2009: 82).
Indeed, in Europe the percentage of young people engaged in episodes of binge drinking is very high. On average, in six European countries (Denmark, Isle of Man, Czech Republic, United Kingdom and Sweden), 60.2% of boys and 41.1% of girls 18-23 years fell into this category, while these percentages were 44.9% and 29.9% for those aged 24-32 (Plant et al. 2009). Especially among young people 18-23 years involved in episodes of binge drinking, 23.7% of boys and 6.9% of girls had participated in a fight during the last twelve months, while between young people 24-32 years these percentages were respectively 10.5% and 2% (Plant et al.2009).
Explaining Trends in Drug Offences
The uptrend showed by drug offences may be related to an increase in drug use and drug trafficking during the period scrutinised. Drug use concerns all strata of society.15While youths with a low socioeconomic status and spending more time in public places encounter more possibilities of engaging in drug use, youths with a medium, and especially with a high socioeconomic status, dispose of the funds required for the acquisition of drugs. The availability of economic resources increases also the risk of engaging in drug use for youths involved in property offences. In that context, the ESPAD surveys (Hibell et al. 2009) indicate that the percentage of adolescent students aged 15-16 who have used drugs at least once in their lifetime increased from 12% in 1995 to 21% in 2003, and decrease then to
15
Among youths, this is shown by the main results of the second International self-reported delinquency study– ISRD-2 (Junger-Tas et al.2010).
18% in 2007. This trend is quite similar to the one followed by violent offences in the ICVS. Eventually, the evolution of drug use could be seen as a proxy for the trends in drug trafficking.
The recent development of European street gangs may also be related to the evolution of drug trafficking. Indeed, the review of Klein et al. (2006) indicates that the second most widespread type of street gang in Europe is the one known as Specialty Gang, which includes groups principally involved in robberies, assaults or drug distribution. In this perspective, the systemic model of relationship between drugs and crime corroborates that systemic violence –the one that occurs within a clandestine market– usually takes place when selling drugs or is provoked by territorial disputes between drug sellers (Brochu 2006: 133). In fact, in a context where security measures have been improved both in homes and in shops, drug trafficking is often the easiest way of obtaining cash. For example, in the mid-1990s the most common offences committed by heroin addicts–who later followed a heroin prescription programme– were shoplifting and drug trafficking (Aebi2006).
In sum, the increase in drug offences seems related to an increase in drug use and, possibly, in drug trafficking. Indirectly, it could also be one of the causes of the increase of violent crime.
An Integrated View
Figure9presents in a graphic way our explanation of crime trends in Western Europe. In order to facilitate its reading, we did not include in the figure the reasons of the increase in property offences in the early 1990s, but we concentrate on their decrease since 1993-4. Furthermore, regarding such decrease, we include three of its causes under the heading Changes in Central/Eastern Europe (the positive socioeconomic outcomes for some of these countries of the enlargements of the EU, the saturation of their black markets, and the reinforcement of police measures against transnational crime).
Conclusion
This article started with a question: Is there a crime drop in Europe? The answer to that question is that there is no general crime drop in Europe. There is a drop in property offences and homicide that started in the mid-1990s, but the rest of the violent offences, as well as drug offences, have been increasing during the last two decades.
In particular, property offences (theft, domestic burglary, and motor vehicle theft) experienced an increase during the early 1990s, reaching their maximum levels between 1992 and 1995, and have been following an overall downward trend since then. This trend was slightly interrupted for a couple of years in the first half of the 2000s, but, after that, the decrease in property offences has been even more pronounced than before. This evolution is confirmed both by victimisation surveys and police statistics; the latter usually anticipated the changes in the tendencies. Depending on the offence considered, the rate of police recorded property offences in 2007 was between 20% and 40% lower than in 1990.
Homicide followed the same trend as property offences, registering peaks in 1991-3 and following then a curvilinear but overall constant decrease, in such a way that the 2007 rate of completed intentional homicide was 26% lower than the one registered in 1990. The decrease in the total intentional homicide rate (including attempts) was somewhat lower (19%) and its evolution during this period was almost identical to the evolution of thefts, both according to police statistics. These trends suggest a slight decrease in the lethality of the assaults, which could be due to the low availability of firearms in Europe as well as to an improvement in the quality of health services.
Indeed, assaults increased since the beginning of the series both according to police statistics (that show a 143% increase of their rate between 1990 and 2007), and victimisation surveys (that show a 85% increase of the prevalence of assaults and threats between 1988 and 2004); although the latter suggest a slight decrease of their prevalence between 1999 and 2004. The contradiction between the decrease of homicide and the increase of assaults cannot be explained by the popular argument that suggests that violent offences are being more often reported to the police. Data from the ICVS shows that their reporting rate remained stable during the period studied.
Police statistics also show an increase of rapes, whose rate doubled between 1990 and 2007. Also according to police statistics, robberies rose in the early 1990s and remained then stable until the end of that decade. At that moment they started increasing again, reaching a peak in 2002, and have been decreasing since then. However, the 2007 rate of robbery is still 16% higher than in 1990. Victimisation data confirms the upward trend until 2004, but the lack of a survey after that year prevent us from establishing if the recent decrease in robbery is confirmed by the victims. This evolution corroborates the mixed nature of robbery, which is indeed a combination of a property and a violent offence. In the first part of the series, robbery followed the trend of violent offences, while in the last part it followed the trend of property offences. Finally, police recorded drug offences followed a steady upward trend (200% increase of their rate) from 1990 to 2007.
These findings show that crime trends in Western Europe did not follow a homogeneous trend. This is a major difference with crime trends in the United States, where a general crime drop has been observed since the beginning of the 1990s. The paradoxical evolution of offences in Europe falsifies not only the explanations of delinquency proposed by most criminological theories but also the specific explanations that have been proposed for the evolution of crime in the United States. All these approaches suggest factors (increase of
police, increase of imprisonment, legalisation of abortion, etc.) that have an impact on all offences and not a differential impact according to the type of offence.
In order to explain Western European trends we propose a multifactor model that is inspired mainly by opportunity-based theories. The increase of property offences in the early 1990s would be related to the consequences of the political and socioeconomic changes that took place in Europe at that time (development of a black market in Central and Eastern Europe and new lines of transportation for illegal goods and commodities across Europe). Their subsequent decrease would be related to the saturation of that black market, a reinforcement of police measures against transnational crime at the borders of the EU, an improvement of the socioeconomic situation in many Central and Eastern European countries, an improvement of security measures in Western European households, and a substantial increase in private security in most Western European countries.
The evolution of violent offences –in which youths are overwhelmingly overrepre-sented– seems related to major changes in the lifestyle of the younger European generations and changes in their demographics. The development of Internet had an influence on the distribution of youths’ free time. Youths who have unlimited access to the internet spend more time at home –and are more exposed to the risk of engaging in computer related offences, which have been increasing constantly–, while those who have a limited access to the Web spend more time in the streets and are differentially exposed to the risk of engaging in conventional delinquency. However, as the increase in security measures and private security has reduced the opportunities to commit property crimes, such risk exposition should have an influence mainly on violent and drug related offences.
In that context, among youths who have limited access to the Internet, there is an overrepresentation of those with a low socioeconomic status and, among the latter, there is also an overrepresentation of ethnic minorities. This is probably one of the factors – combined with many others– explaining their differential involvement in delinquency according to official statistics and self-reported delinquency studies. Moreover, the number of youths who are second-generation ethnic minorities have increased in Europe during the last decades. In that perspective, research suggests that their presence is related to the recent development of European street gangs. Member of these gangs present high rates of violent offending, in particular group fighting. Also, some street gangs are involved in drug trafficking, which is also related to the commission of violent offences.
Finally, research shows an increase in the percentage of youths engaged in heavy episodic drinking (binge drinking), and has also shown that among these youths there is a high prevalence of violent offending. Soft drug use has also increased among adolescents during the most part of the period studied, although it seems to have started decreasing lately.
Under these circumstances, it is complicated to predict the future. Violent offences cannot continue to rise indefinitely, and it is plausible that the slight decrease of such offences in 2004 according to victimisation surveys is a first sign that they are reaching their upper limit and may start to decrease. This hypothesis is reinforced by the recent decrease in completed homicide. In that context, one must not underestimate the role of domestic violence. Research has shown that the latter is not correlated to the general evolution of delinquency. It has also shown that the percentage of women killed in an incident of domestic homicide can represent one third of the total number of victims of intentional homicide in some Western European countries. Major changes in the future crime rates could be related to the evolution of domestic violence as well as to changes in youth lifestyles.
Appendix 1 T able 2 Geom etric mean rates of police recorded of fen ces per 100, 000 popu lation fro m 1990 to 2007 in 14 W este rn Eu ropean cou ntries, and percentage change (ba sed upon unround ed data) between 1990 and 2007 1990 1991 1992 1993 1994 1995 1996 1997 1998 1999 2000 2001 2002 2003 2004 2005 2006 2007 % ch an g e* Intentional homicide 4.8 5.1 5.3 5.3 5.1 4.4 4.7 4.5 4.4 4.1 4.3 4.4 4.6 4.4 4.4 4.3 3.9 3.8 -19.4 Completed intentional homicide 1.6 1.8 1.8 1.7 1.6 1.6 1.7 1.6 1.6 1.5 1.5 1.5 1.4 1.4 1.4 1.3 1.2 1.2 -25.8 Assault 100.4 100.7 102.6 104.0 107.6 1 10.3 1 13.3 1 16.8 134.4 137.7 156.0 167.0 177.5 203.8 220.2 225.5 235.2 243.6 142.7 Rape 6.1 6.3 6.7 7.0 7.1 8.2 8.3 9.2 9.8 10.1 9.8 10.5 1 1.6 1 1.1 1 1.9 12.2 12.5 12.3 102.8 Robbery 55.4 61.7 64.7 63.6 59.7 60.4 62.3 59.0 61.6 67.3 73.2 76.4 78.9 73.2 70.4 68.0 67.0 64.2 15.8 Theft 3577.3 3750.7 3815.6 3732.1 3605.9 3707.8 3608.8 3565.6 3596.7 3494.9 3420.4 341 1.9 3557.9 3401.6 31 10.3 3035.8 2938.2 2880.9 -19.5 V ehicle theft 407.0 448.0 469.6 468.4 454.2 412.1 408.6 398.9 402.1 398.4 423.0 391.8 378.7 341.5 308.1 262.0 247.2 233.2 -42.7 Domestic burg lary 443.8 461.1 477.8 479.0 463.4 439.3 421.4 396.3 380.3 356.3 345.8 336.5 345.7 353.2 328.2 301.0 293.6 292.5 -34.1 Drug of fences 91.1 101.3 1 16.0 124.4 135.3 123.8 133.9 152.2 163.7 173.9 214.2 222.2 239.3 251.1 252.8 267.9 265.8 273.7 200.6 *The calculation of the percentage change between 1990 and 2007 is based upon unrounded data