Publisher’s version / Version de l'éditeur:
Vous avez des questions? Nous pouvons vous aider. Pour communiquer directement avec un auteur, consultez la
première page de la revue dans laquelle son article a été publié afin de trouver ses coordonnées. Si vous n’arrivez pas à les repérer, communiquez avec nous à [email protected].
Questions? Contact the NRC Publications Archive team at
[email protected]. If you wish to email the authors directly, please see the first page of the publication for their contact information.
https://publications-cnrc.canada.ca/fra/droits
L’accès à ce site Web et l’utilisation de son contenu sont assujettis aux conditions présentées dans le site LISEZ CES CONDITIONS ATTENTIVEMENT AVANT D’UTILISER CE SITE WEB.
Internal Report (National Research Council of Canada. Division of Building
Research), 1968-12-01
READ THESE TERMS AND CONDITIONS CAREFULLY BEFORE USING THIS WEBSITE.
https://nrc-publications.canada.ca/eng/copyright
NRC Publications Archive Record / Notice des Archives des publications du CNRC :
https://nrc-publications.canada.ca/eng/view/object/?id=9e85c38d-64fd-4015-8996-7e19287294b9 https://publications-cnrc.canada.ca/fra/voir/objet/?id=9e85c38d-64fd-4015-8996-7e19287294b9
Archives des publications du CNRC
For the publisher’s version, please access the DOI link below./ Pour consulter la version de l’éditeur, utilisez le lien DOI ci-dessous.
https://doi.org/10.4224/20386777
Access and use of this website and the material on it are subject to the Terms and Conditions set forth at
Inside surface temperature performance of two aluminum windows
with different heating arrangements
DIVISION OF BUILDING RESEARCH
INSIDE SURFACE TEMPERATURE PERFORMANCE OF TWO ALUMINUM WINDOWS WITH DIFFERENT
HEATING ARRANGEMENTS
by
J. R. Sasaki and W. P. Brown
ANA!.. YZED
Internal Report No. 366
of the
Division of Building Research
OTTAWA
Windows have been the subj e ct of extensive investigation by the
Division. They are critical elements in the enclosure of a building,
particularly in winter when they present cold condensing surfaces to the
interior. They become a limiting factor in the relative humidity which
can be carried, and better information is often required in order to be able
to design for improved performance in this respect. The work now
re-ported includes studies of the thermal performance of two common window
arrangements. The emphasis in this work was on the influence of the
arrangement of heating outlets under the window.
The work was carried out mainly by W. P. Brown, a mechanical engineer, while he was a research officer on the staff of the Building
Services Section. He was not able to complete the work before leaving
the Division and it is now reported by J. R. Sasaki, also a mechanical
engineer and a research officer having an interest in the technical aspects of windows.
Ottawa
December 1968
N. B. Hutcheon Associate Director
TWO ALUMINUM WINDOWS WITH DIFFERENT HEATING ARRANGEMENTS
by
J. R. Sasaki and W. P. Brown
Of all the elements comprising the building enclosure, the window normally has the lowest resistance to heat flow and the lowest
inside surface temperature s in cold weather. Because of its low
surface temperatures the window experiences condensation more
readily than the other enclosure surfaces. Low inside window surface
temperatures also contribute to discomfort which is partially de-termined by the radiant heat lost by occupants located near windows. Effort should, therefore, be made to maintain high temperatures on the inside window surfaces in cold weather in order to minimize
condensation and occupant discomfort. The thermal requirement in
the aluminum window specifications of the Canadian Government Specifications Board attempts to do just this by promoting window designs that ensure relatively high inside surface temperatures.
Inside surface temperatures of a window installed in a building are determined not only by the window design but also by the type and
location of the terminal units of the building's heating system. The
purpose of the present study is to determine the effect of heater type and configuration on the inside surface temperature performance
of two aluminum windows. One window was representative of a double
window having an adequate thermal separation between inside and outside metal members; the other window was representative of a double-glazed window having an inadequate thermal separation.
The foregoing discussion stresses the need to provide high
inside surface temperature s for satisfactory window thermal performance
in cold weather with regards to condensation and comfort. There is one
special problem, however, that may be aggravated by attempts to raise
inside window surface temperatures. This is the problem of thermal
breakage of factory-sealed double-glazing units.
The construction of sealed double -glazing units is such that the heat los s through the edge is much greater than that acros s the air space
pane will, therefore, be lower than that of the central portion. When heated air is directed against the inside surface s of the window the temperature of the central portion of the inner pane is increased more than that of the edge which is buried in a metal surround and is isolated from the heated air. If the temperature difference between the central portion and the edge becomes very large, breakage of the inner pane due to thermally-induced tensile stress may result. Window installations incorporating sealed double -glazing units, therefore, require more care in the design and location of the heating units near windows to ensure that the highest inside surface temperatures are obtained without creating a potential breakage problem.
This report describes a series of thermal tests performed on two aluminum windows with different heating arrangements on the warm side of the windows. The tests were conducted in the DBRjNRC cold-room facility with air temperatures of -lO°F and 72°F on the cold and warm sides of the windows, respectively. The inside surface tempera-tures of the windows were measured with the following heater arrangements on the warm side: a baseboard electric heater located remote from the windows providing natural-convection air flow down the inside window surface; electric heaters located beneath the windows providing natural-convection air flow up the inside window surfaces; and electric heaters located beneath the windows providing forced-convection air flow up the inside window surfaces. An additional test was conducted with the last heater arrangement using augmented heat input. Forced-convection air flow conditions were provided on the cold side of the windows in all tests.
The determination of the over-all heat transmission coefficients for the two windows is described in Appendix I.
2. DESCRIPTION OF WINDOWS
2.1 Window A
Window A was a double aluminum window consisting of two upper and two lower sashes, as shown in Figure 1. The upper prime and storm sashes were openable for cleaning purposes only; they pivoted indepen-dently about vertical side hinges and were locked to the frame by tab locks. The lower prime and storm sashes were bottom-hinged and linked to operate together; the prime sash was locked to the frame by a three -point lock. The upper and lower air space s between prime and storm sashes were separated by the muntin frame members and an
aluminum separator. The joints between frame and sash were sealed with vinyl and stainless steel weatherstripping.. The frame was
constructed in three sections separated from each other by wood thermal breaks.
The over-all frame dimensions were 39-% in. wide by 60-3/4 in. high; the upper sash, 36-% in. wide by 42-% in. high; the upper glazed area, 33 in. wide by 39 -% in. high; the lower sash, 36 -% in. wide by 15 in. high; the lower glazed area, 33 in. wide by 12-% in. high. The air space thickness for both upper and lower assemblies was 4-7/8 in.
2.2 Window B
Window B, shown in Figure 2, was an aluminum window with an upper and lower sash, each containing a factory-sealed double -glazing unit with a nominal air space thickne s s of
%
in. The upper sash pivoted about vertical side hinges and was locked to the frame by a two -point lock. The lower sash was bottom-hinged and locked to the frame by a three-point lock. The joints between frame and sash were sealed with vinyl weatherstripping. The frame and sash members were constructed in two sections which were separated by a wood thermal break.The over-all frame dimensions were 36-% in. wide by 59-% in. high; the upper sash, 35 in. wide by 39
-1
in. high; the upper glazed area, 30 in. wide by 34-1/4 in. high; the lower sash, 35 in. wide by 17 in. high; the lower glazed area, 30 in. wide by 12 in. high.3. DESCRIPTION OF TEST APPARATUS
The two windows were installed in the DBR/NRC cold room facility (Figure 3) described in NRC 6887. The windows were mounted in the partition with their inside face flush with the inside of the par-tition. The outside face of Window A protruded past the outer face of the partition by approximately 4 in. ; the outside face of Window B was nearly flush with the outer face of the partition. The windows were thermally isolated from the wooden partition.
The cold-room air flow conditions remained unchanged for all tests (including the heat transmission tests described in Appendix A). The cold room was maintained at test temperature with only the
main refrigeration unit operating. The main-unit fan operated at high speed and discharged refrigerated air against the partition and test windows in such a way that forced-convection air flow occurred down the cold surface of the windows. The average surface conductance on the cold face of the windows was approximately 4 Btu per (hr) (sq it) ( OF).
Temperatures were measured with 30-gauge copper-constantan thermocouples in conjunction with an electronic temperature indicator. Glass-surface temperature measurements were made with junctions fabricated by soldering i-in. lengths of copper and constantan wire
laid side by side with the leads opposed. The junction, with 2 in. of
lead wire on both sides, was taped onto the glass surface. Metal
sur-face temperatures were measured with twisted soldered junctions taped in place with 2 in. of lead wire.
Air temperatures were measured with unshielded
thermo-couples having twisted soldered junctions. On the warm side,
vertical strings of thermocouples measured air temperature
gradients 11 in. from the glas s and opposite the vertical centreline
of each window. The average of these values was taken as the
reference warm-room air temperature, two On the cold side, a
vertical string of thermocouples measured the cold-air temperature
gradient 6 in. from the plane of the windows. The mid-height
thermo-couple on this string measured the reference cold-room air temperature, tc '
The locations of surface thermocouple s on windows A and B are shown in Figure 4.
The conditions on the warm side of the windows were changed for each test and are described in the following section.
4. DESCRIPTION OF TEST CONFIGURATIONS AND TEST PROCEDURE
4.1 Remote Baseboard Convector (Test 1)
The convector was located at the base of the warm room wall
opposite and 7 ft away from the test windows. The convector contained
18 electric heater elements installed end to end acros s the width of
the room. Alternate elements were wired together, forming two separate
circuits, one supplying 1250 watts and the other 1000 watts at 115 VAC. The air temperature in the warm room was controlled by
regulating the input voltage to the convector with a temperature
controller. The thermostat for the controller was located 4 ft above
the floor on the centre of the end warm-room wall. The heat input
The baseboard heating arrangement provided natural-convection
air flow down the warm face of the windows. The average surface
con-ductance value provided over the inside window surfaces was
approxi-mately 1. 5 Btu per (hr) (sq ft ) (0F).
Air and window surface temperatures were measured with the
warm room controlled to 72°F and the cold room to _10°F. These
temperatures were used for all subsequent tests.
The measured surface temperatures, t, were converted to non-dimensional temperature indices,
t - t
c
t - t
w c
1 =
-where t = measured surface temperature, OF
tw= reference warm-air temperature, OF
t = reference cold-air temperature, of.
c
The advantage of expressing the thermal characteristics of a window in terms of temperature index rather than temperature is that, for any particular configuration, the index is practically independent
of test air temperatures over the temperature range of interest. For
the present test series, a change in the index at a given point, from te st to te st , indicate s the effect of different heating arrangements on the window thermal performance.
4.2 UnderWindow Convector
-Natural Convection (Te sts 2 to 5)
The baseboard convector was disconnected and a portable convector was placed beneath each window to simulate an
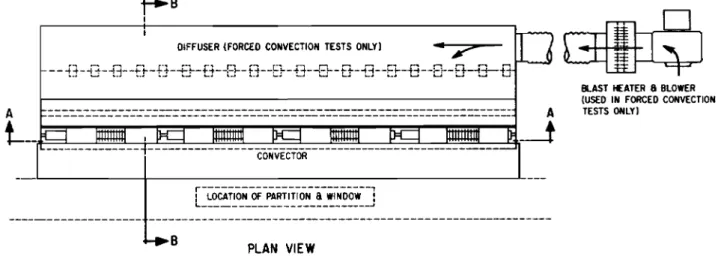
under-window heating arrangement (Figure 5). The blast heater and diffusion
box shown in the figure were not incorporated. Four heating elements
in each convector were wired together to provide 1000 watts at 115
VAC. Baffles were located in the convector outlet to give a uniform
discharge temperature.
The air temperature in the warm room was controlled by re-gulating the input voltage to the two under-window convectors; the control and heat-metering equipment described in 4. 1 were used. Each convector provided half the total heat requirement of the warm
The geometry of the convector beneath the window is shown in
Figure 6. The location of the outlet with respect to the bottom edge of
the window is described by X and Y, the outlet width is W, and the
deflector angle. 8. A sheet metal stool covered the gap between the
convector and partition.
Tests 2 to 5 were performed with two settings each of X, Y
and W, and with the deflector folded down in the open position. 4. 3 Under Window Convector
-Forced Convection (Tests 6 to 13)
The heating arrangement described in 4.2 was used for these
tests with the following modifications: removal of baffles in convector
outlet; connection of blast heater and diffuser to convector inlet. Each blast heater consisted of a blower with a capacity of 250 cfm
at 3/4 in. of water, and an external heater. The external heater
contained four heating elements wired to provide lOOO watts at 115 VAC.
The air temperature in the warm room was controlled by regulating the input voltage to the two under-window convectors and their blast heaters; control was the same as in the previous tests. The total heat input to the convectors, external heaters and blowers
was metered. Each convector assembly provided half the total
heat requirement of the warm room.
The discharge air velocity was measured at the convector outlet with a hot-wire anemometer at low velocities and a
deflecting-vane anemometer at high velocities. The geometry of the convector
is shown in Figure
6.
Four tests (7. 9, 12 and 13) were performed with two settings
each of X, Y and W, and with the deflector plate vertical. Two tests
(6 and 8) were performed with the geometry of test 7 but with different
discharge velocities. Test 10 was performed with the deflector adjusted
at 450
to direct the discharge against the window sill. Test 11 was
performed with augmented heat input; cold air was bled into the warm room to increase the heating load.
5. DISCUSSION OF TEST RESULTS
The test conditions and surface temperature indices for all te sts are listed in Table s I to IV.
5. 1 Inside -Surface Temperature
Performance - Baseboard Convector
The inside surface temperature performance s of windows A and B obtained with the remote baseboard heater configuration are
compared in Figure 7. The minimum inside surface temperature
indices for window A were: glass, 0.55; sash, 0.525; frame, 0.505.
The minimum indices for window B were: glass, 0.485; sash, 0.42;
frame, 0.305. The minimum glass temperatures measured would
have been lower for both windows had the thermocouples been located closer to the exposed edge of the inside glass; at the edge of the sealed unit in window B, the glass temperature would have been still lower.
The minimum frame and sash temperatures of Window B were lower than those of window A because the thermal separation in the frame
and sash members of window B was not as effective in reducing heat
loss as the separation and air space of window A. The minimum glass
temperature of window B was lower than that of window A because of the highly conductive heat flow path occurring around the edge of the
sealed double -glazing unit in indow B.
The low surface temperatures of window B are a reflection of the high heat transmission coefficient for this window; the over-all heat transmission coefficient of window B was 0.72 Btu per (hr) (sq ft) (OF) while that of window A was 0.56 (See Appendix 1).
5.2 Under Window Convector -Natural Convection
The vertical temperature profiles obtained for the four natural convection tests are compared with that for baseboard heating in Figure
8.
The inside surface temperatures obtained with the under-window heater arrangements were significantly higher than the temperatures
obtained with the remote baseboard heater. The bottom half of the
windows showed the largest increase in temperature.
The highest surface temperatures were obtained with the convector
outlet closest to the bottom edge of the window (tests 3 and 4). The
surface temperature s obtained with a large value of Y and a small value of X (test 2) were higher than those obtained with large X and small Y (test 5).
Because the size of the convector outlet in test 4 was twice that in test 3. the discharge air flow rate was higher and the surface temperatures in test 4 should have been higher than those in test 3. The mean discharge air temperature with the larger opening. however.
was lower than that for te st 3. This reduction in discharge
tempera-ture nullified to some extent the effect of the higher flow rate; and the surface temperatures with the larger outlet (test 4) were higher on the upper portion of the windows but lower near the sill than those of te st 3.
Test 3 gave the most uniformly high surface temperature
profile s. The se are shown in Figure 11 compared with the optimum
temperature profiles obtained with under-window heater and forced-convection air flow.
5. 3 Under - Window Convector - Forced Convection 5. 3. 1 Convector Geometry
The vertical temperature profiles obtained with five convector geometries in the forced convection tests are shown in Figure 9.
The dependence of surface temperature on convector geometry was similar to that for the natural convection tests; the highest surface temperatures were obtained with the convector outlet nearest the
bottom edge of the window (tests 9 and 10). The highest temperatures
on the lower regions of the window occurred when the discharge air
stream was deflected against the window (test 10). The temperature
profiles obtained in this test are shown in Figure 11 compared with the optimum profiles of the other test configurations.
5.3.2 Discharge Air Velocity
The vertical temperature profiles obtained with three discharge velocities are shown in Figure 10; the velocity varied from 50 to 300
ft/min. These values of discharge velocity are not unlike the normal
velocities used in building heating systems.
The window surface temperature increased with discharge
velocity because of the increase in surface conductance value. The
drop in mean discharge air temperature with increasing velocity did
not significantly affect the inside surface temperature. The
tempera-ture profiles obtained with the highest discharge velocity (test 8) are shown in Figure 11 compared with the optimum profiles of the other te st configurations.
5. 3. 3 High Heat Input
The temperature profiles obtained in test 11 with a high heat input rate are shown in Figure 11, in comparison with the optimum
profiles of the other test configurations. This test gave the highest
surface temperatures of all the tests.
Calculations have shown that the heat input rate in re sidential buildings varies between 750 and 1400 Btuj(hr) (ft of window width) whereas the input rate in commercial buildings is normally less than
400 Btuj(hr) (ft of window width). The heat input rate in test 11 was
approximately 1450 Btuj(hr) (ft of window width) which was not unlike the
higher rates used in residential buildings. The heat input rate of
approximately 450 Btu/(hr) (ft of window width) used in all the other tests was similar to that used in commercial buildings.
6. CONCLUSIONS
1. The inside surface temperatures of a window can be increased
over that obtained with remote baseboard heating by using an under -window heating arrangement and forced or natural convection air flow.
2. With under-window heater and natural-convection air flow, the
highest surface temperatures are obtained with a heater outlet of small opening located close to the bottom edge of the window.
3. With under-window heater and forced-convection air flow, the
highest surface temperatures are obtained with the heater outlet located close to the bottom edge of the window; with the convector discharge deflected towards the window; with a high discharge air velocity; and with a high rate of heat input in the convector.
4. With few exceptions, window A which has the higher inside
surface temperature s appeared to be more sensitive to change in performance with changing heater and convection conditions than window B.
5. The results of the tests on window B did not permit an accurate
estimation of the variation in thermal-breakage potential of sealed double -glazing units with changing heater and convection
conditions. The estimation of the breakage potential, or
pane, was poor because the thermocouple closest to the edge of
the sealed unit was approximately 1 in. away. Subsequent work
on sealed double -glazing units has shown that the temperature at this point behaves more like that in the central portion of the inner pane than that at the edge.
Heater Location Baseboard Under the Window
Air Flow Condition Over Window Surface Natural Natural Convection Forced Convection
Configuration of X -in.
---
23/4 6 2 3/4 6Convector Outlet y . in .. -
--
153/41 2 14 174 T I 51.(Figure 6) W - in. --- I 2 1 ,
9 - -«:degrees
---
180' 90' 45· 90·Convector Discharge Velocity. V
d-It/min. --- 15 15 15 15 55 105 310 105 105 110 105 100 Air Flow Volume flow -ft3/ m i n .
---
5 5 10 10 20 35 105 35 35 40 35 65 Convector Air Temperature, td Maximum/Minimum - ·F --- QRUセPP
ISUセ 05 120/9 0 120/
9 0 88 87 81 86 88 QTPセPP 85 81 Heat Inputpe r Window Btu/hr 1260 1370 1400 1400 1350 1380 1400 1560 1440 1500 4580 1460 1400
セ・ヲ・イ・ョ」・ Air Temperature, ·F Warm room,Cold room, t1:w 73.2 73.3 72.3 72.6 72.5 72.8 73.4 73.7 73.3 73.7 73.6 73.7 73.4
c -9.5 -9.0 -9.5 -9.3 -9.6 -9.2 -9.3 -9.2 -9.3 -8.9 -10.6 -8.8 -8.5 1 2 3 4 5 6 7 8 9 10 11 12 13
-
-',-TABLE 11 TEST CONDITIONS - WINDOW B
Test Number I 2 3 4 5 6 7 8 9 10 Z ,3
Heater Location Baseboard Under the Window
Air Flow Condition Over Window Surface Natural Natural Convection Forced Convection
Configuration of X - in.
--
3 6 3 6Convector Outlet Y -In. -- 161/4 Z 14 I Z Z
(Figure 6) W - in.e - .,:.
--
I 2 1 Zdes eee e -- 180· qO· 45· QO·
Convector Discharge Velocity. Vd - it/min.
--
10 10 15 18 45 95 305 95 95 95 100 90 Air Flow Volume flow - ft3/m i n .--
3.5 3.5 10 IZ 15 35 105 35 35 35 35 65 Convector Air Temperature. t d Maximum/Minimum - -F--
QRUセPU izoセio izUセU izoセU 89 86 80 84 89 QSPセPP 85 81 Heat Input per Window Btu/hr Iz60 1370 1400 1400 1350 1380 1400 1560 1440 1500 4580 1460 1400 Reference Air Temperature. ·F Warm room, tw 73.2 73.3 n.3 ra.a n.6 ra.e 73.5 73.7 73.3 73.7 73.6 73.7 73.4Cold room. tc -8.9 -9.0 -9.5 -9.3 -9.6 -9. Z -9.3 -9. Z -9.3 -8.9 -10.6 -8.8 -8.5 1 2 3 4 5 6 7 8 9 10 11 I Z 13
Test Number I 2 3 4 5 6 7 8 9 10 II 12 13
Heater Location&:Air Flow Condition Baseboard Under-Window Heating uョ、・イセwゥョ、ッキ Heating Natural Natural Convection Forced Convection
r arne - head member A I .635 .68 .695 .70 .695 .665 .675 .725 .675 .67 .755 .665 .685
l5a s h - top rail A 2 .675 .72 .725 .73 .725 .69 .705 .75 .70 .695 .78 .695 .71
blass - !in. from top sash rail A 3 .70 .74 .745 .745 .745 .72 .73 .755 .73 .73 .78 .725 .735
- zセ in. from top sash rail A4 .705 .72 .73 .73 .73 .71 .725 .74 .725 .725 .765 .725 .n セセ - S! in. from top sash rail A 5 .685 .71 .72 .725 .72 .695 .705 .74 .705 .705 .76 .705 .71
<fJ - centre A 6 .63 .685 .695 :695 .695 .665 .67 .725 .68 .675 .745 .68 .685
"- 51 in. from bottom sash rail A7 .61 .71 .725 .74 .705 .64 .665 .745 .72 .705 .82 .715 .68
0
...
-Rセ in. from bottom sash rail A8 .59 .68 .715 .715 .69 .615 .64 .735 .695 .68 .82 .71 65-I .
from bottom sash rail A 9 .55 .62 .655 .65 .63 .575 .60 .685 .635 .64 .765 .665 .61
zIn.
Sa ah - bottom rail A 10 .56 .65 .69 .675 .65 .595 .64 .745 .685 .70 .83 .67 .635
Frame- muntin A II .505 .60 .64 .625 .595 .535 .59 .695 .635 .65 .785 .605 .56
Sash - top rail A 12 .605 .76 .80 .79 .75 .655 .74 .83 .785 .795 .94 .745 .685
.; Glass - 1"I in. {rom top sash rail A 13 .63 .745 .77 .775 .745 .685 .735 .80 .79 .78 .895 .77 .675 セ - zlin. from top sash rail A14 .65 .745 .77 .785 .725 .69 .73 .785 .83 .79 .94 .735 .68
<fJ
E - centre A 15 .63 .76 .775 .80 .70 .675 .74 .81 .825 .83 .985 .685 .655
0 . ztin. from bottom sash rail A 16 .595 .785 .80 .815 .655 .66 .755 .83 .71 .875 .935 .635 .61
11 - !in. from bottom sash rail A 17 .555 .725 .79 .765 .615 .61 .68 .805 .645 .93 .84 .59 .565
/Xl
Sa ah - bottom rail A 18 .525 .67 .735 .69 .595 .585 .645 .765 .615 .86 .795 .565 .545
Frame -sillme mbe r A 19 .505 .665 .74 .675 .58 .575 .635 .76 .595 .86 .79 .545 .525
TABLEly
TEMPERATURE INDICES ON VERTICAL CENTRE-LINE OF INSIDE WINDOW SURFACE - WINDOW B
Test Number I 2 3 4 5 6 7 8 9 10 II 12 13
Heater Location&a:Air Flow Condition Baseboard Under- Window Heating Under - Window Heating Natural Natural Convection Forced Convection
Frame .. head member B 1 .41 .42 .435 .44 .44 .42 .405 .49 .44 .425 .54 .445 .44
Sash - top rail B 2 .475 .495 .505 .515 .51 .49 .485 .58 .515 .50 .625 .515 .455
-; Glas8 - tin. from top sash rail B 3 .56 .595 .605 .615 .61 .575 .575 .65 .62 .595 .715 .615 .605
セ セ ztin. from top saah rail B4 .64 .67 .68 .68 .68 .655 .655 .69 .68 .67 .75 .68 .67
<fJ
g .. 5tin.from top sash rail B 5 .635 .67 .67 .675 .675 .65 .655 .70 .68 .67 .755 .675 .67
... - centre B 6 .635 .68 .685 .695 .69 .665 .655 .74 .695 .685 .785 .68 .685
-st
in. from bottom sash rail B7 .645 .665 .75 .76 .70 .665 .65 .795 .695 .70 .865 .72 .715.. 2;a in. from bottom sash rail B8 .61 .62 .71 .71 .645 .625 .61 .765 .645 .645 .865 .68 .675
.. tin. from bottom sash rail B9 .485 .495 .56 .55 .50 .495 .49 .625 .515 .51 .76 .535 .53
Sash - bottom rail B 10 .42 .445 .515 .515 .44 .43 .44 .605 .475 .465 .715 .47 .465
Frame - muntin B II .31 .35 .40 .395 .29 .33 .35 .44 .375 .375 .635 .365 .36 Gta e e .. !in. from top sash rail B 12 .605 .70 .73 .735 .69 .645 .69 .775 .72 .71 .875 .67 .645 セ .. 21in. from top sash rail B 13 .68 .745 .74 .76 .75 .70 .745 .80 .79 .745 .87 .72 .695
セ - centre B 14 .66 .79 .805 .785 .75 .695 .755 .84 .805 .83 .95 .70 .68
<fJ
E .. 2!in. from bottom sash rail B 15 .61 .775 .825 .775 .70 .65 .70 .815 .74 .875 .98 .65 .635
0 - tin. from bottom sash rail B 16 .485 .60 .68 .65 .555 .515 .545 .645 .575 .735 .81 .52 .51
l::
0
lQSash .. bottom rail B 17 .425 .535 .61 .545 .455 .445 .50 .64 .485 .72 .68 .435 .43
STAINLESS STEEL WEATHERSTRIPPING VINYL , weatherstrippingセ OUTSIDE Fill INSULATION '''___I"," PlYWOOO 8" HEAD SECTION MUNTIN
-...
3-POINT LOCKI
/
/
SILL SECTION \ INSIDE / /""-//
HORIZONTAL SECTION THROUGH UPPER CASEMENT
FIGURE I DETAILS OF WINDOW A AND TEST MOUNTING
HORIZONTAL SECTION THROUGH UPPER CASEMENT
SEALED DOUBLE - GLAZING UNIT
( IJ \ j
-I
\
\
-r- -
---
INSIDE CAULKINGセ]Nセ
SEPARATOR .., : HEAD SECTION MUNTIN LOWER HOPPfR SILL SECTION/
tu..
···0!l/I
INSIDEVINYL
WEATHERSTRIPPING
FIGURE 2 DETAILS OF WINDOW B AND TEST MOUNTING
'4.PLYWOOD BR3724-2
MAIN REFRIGERATING
..
n
UNIT I I 0---..
WINDOWB I 0 I_J
l_
0•
J
•
---
Ie I.--;r
LOCATIONS OF PORTABLE CONVECTOR AUXILIARY WINOOWA REFRIGERATING UNIT ,0 0 I 0,
I .JCOLD ROOM WARM ROOM
14'-4". 15'-1" 7'-4".15'-1" IASEBOARO-CONVEC1OIl
I
DOORI
I
DOORI
PLAN VIEWM
AIR FlOWI
..
t% MAIN WINDOWB REFRIGERATING UNIT•
•
Ie I• CEILING HEIGHT· 10'-0"•
I \ LOCATION OFf
1
PORTABLE CONVECTOR XaseXParセ LJ CONVECTOR INLET---
(
セ VERTICAL SECTIONFIGURE 3 COLD- ROOM FACILITY SHOWING LOCATION OF WINDOWS
- ) I
OA4I
oA5 I I :::-N _ _ _ _jセV
'" .., 1-oA7 I OAB bA9 i;.セiaiS.
:::' ___ OAI4lAI5 !::!1-I
AI6 oAI7WINDOW
A
LEGEND• ALUMINUM - SURFACE TIC
oGLASS-SURFACE TIC • AIR TIC
Nセセ
セi セイ
n
.
'-1"
I Il
, .
1i:'l"" ...
セ
I
.
r
5I
... I - II
In!
セ
0 . ! ! 6 _I!II
oB7I
oBB J Lr" • bB9I
'.:I?
I &:::Iセ
I = ...--0BI2 -Bセ
セ
bBI3 . ''''L __JIDL__
!::! lBI5 IBI6 --.J,
°
L- -B17 J - +BI8-I WINDOW8
FIGURE 4 LOCATION OF THERMOCOUPLES ON WARM SIDE OF WINDOWS
-
,-DIFFUSER (FORCED CONVECTION TESTS ONLY)
A
l--It=
EMMゥゥMゥSMゥェMMeセMヲスMMヲスMヲエMMfイMヲェMMeスMエェMセMヲイMゥSMMエエMエェMMUセMeェセセゥS
r---,
Iセ LOCATION OF PARTITIONaWINDOW_ J:
B PLAN VIEW
8
----100
.:»
I I I ,!
, 0 ,セA Iz' イNlNNセMlNセ ,-.L._. __セ , ca , ,,
, Z I o , - I !:: I ... I a: I セ l ... , o 'I Z , o I - I ... I Cl I .., I o I ...J ,, ,,,,
1BAFFLES (REMOVED FOR FORCED CONVECTION TESTSI
/ \ / \ / \ /
セ 0 0 0 0 0 0 0 0 0 0 0 0 0 0 0 0 0 0
I.
50·.I
N
END VIEW (SECTION B-B) FRONT VIEW (SECTION A - A)
FIGURE 5 DETAILS OF UNDER-WINDOW CONVECTOR
PARTITION
SEPARATION
SHEET
UNDER -WINDOW
PORTABLE CONVECTOR
DEFLECTOR
e•
DEFLECTOR ANGLE
FIGURE 6
GEOMETRY OF UNDER -WI NDOW PORTABLE CONVECTOR
\
---7
GLASS HEIGHT IIN.I
A B
UPPER GLASS 39lit 34'4
LOWER GLASS 121fa 12 WINDOW 8 WINDOW A
I
_ _ _ _ MID-HEIG.!tT- - - - -
-\
I
I,,
II
tt)
ッMMMMMMMNセ
0•
SASH 0•
MUNTIN•
SASH セ..
セ 1---- MID -HEIGHT___
wセnッッキゥjGセoowb
__
/,/
ッMMMMMMMZセLG
0•
SASH 0•
FRAME 0.30 0.40 0.50 I - Ie 1 = -Iw-I e 0.60 0.70 0.80FIGURE 7
INSIDE - SURFACE TEMPERATURE INDEX PROFILES WITH
REMOTE BASEBOARD CONVECTOR
a
NATURAL CONVECTION
AIR FLOW
.---•
lC'-,>
d
セ
,/\
Oセセ
セN
, . , / '/
0----'::::
A n•
0-40 0·50 0·60 0-70 0'80 0·90 1·00 セ I'"lw-1c WINDOWA
TEST(IN) (IN.) (IN.)X Y WI(OFl'd
•
1 BASEBOARD 0 2 2\ QUセT 1 110 X 3 2\ 2 1 120 o 4 セT 2 iセ 105 I A 5 6 2 iセ 105 DEFLECTOR (FOLDED BACK SASH SASH MUNTI H FRAM 0·20 0·30 FRAME • ..0 xA_ SASH ---.- 0-100---
N⦅MMNNッ⦅セ - - Xl' I III TEST x YW)I(!d
't
I'IN) liN.) (IN.)°FI
§
...
•
I BASEBOARD WINDOWB
2 3 QVセT 1 115 ..., 0 % • " , I -. -. % X 3 3 2 1 115"''''
"'W ... % C 4 3 2 iセN 110セセセN
0. '" 0.'":::I"
... A 5 6 2 1\ 110 セ . 0 A セ__...
ョセBBBZZBGMM⦅セ .-. nA=--'-c..;-:=--SASH __.--16 _:0-MUNTIN A .---0 ex-SASH セᄋMMMセWセL|
% 0 " , I -.. X BGセ ",'"" , x.'"
0 ' "...
-:
セ
... ⦅MMMMMMセN セcd _ x セ NMMNMMMMᄋMMMMMセMッMc:::;F::::::=S
SASH __ .--- A n n FRAME A. - MMMセM 0·20 0·30 0·40 0·50 0·70 0·80 0·90 1·00FIGURE 8
INSIDE - SURFACE TEMPERATURE INDEX PROFILES WITH NATURAL
CONVECTION - EFFECT OF CONVECTOR DISCHARGE GEOMETRY
BR3124-8A M NT SASH SASH FRAME TEST X Y W 9 liN.) liN.! liN.! (OEG
•
I 8ASE90ARO(N.CJ 0 7 2\ '4'4 1 90 X 9 RセT セ・ I 90 c 10 2\1\
1 45 ... 12 6 セ・ I 90 IJ. 13 61\
iセ・ 90 Vd • 100 FPM I d . 85 OF .---.- '" .l .- '" .l•
WINDOWA
c 0·20 0·30 0040 0·50 0·60 t-Ic I ..r---'!' 'w-tc 0·70 0·80 0·90 1·00 framセ ·c._n ... SASH -",--.-MMMMNMNッセ - - - . - Xjjセ
TEST X Y W,b:(liN.) liN.! (INJ Gl
•
I BASEBOARD (N.CJ WINDOWB
$! 14\...
0 7 3 I 90 '" x • "'.- 9 3 21fe I 90 "x X "''''a:w 10 3 21/e 45 \ 0セ
.... x C 1 e, Cl.'" :::>'" .l 12 6 2'11 I 90..
..J 1 セ Z'/e iセ・|セ
'"
13 6 90 Vd .. 95 FPM Id .. 85 OFMMMMMMNセセ
⦅BMMイAx[Z[GVaMMMセ SASH _ -.-"'1l . I n ( -MUNTIN .--- -O"'.llJX-SASH NセMMMMエアセ
::r-; "'.-"x BGセ .. s '" 0 a: ..../'Z/
/
-.
.... x セセ ..J . .⦅MMMMセW^]MMMMMMセq
_:_ _ _ _0 ..J セ SASH _ • __e-tfJ{--- セMイイM o FRAME"'4
.·x· .- 0 0·20 0·30 0040 0'50 0·70 0·80 0·90 1·00FIGURE 9
INSIDE -SURFACE TEMPERATURE INDEX PROFILES WITH FORCED
CONVECTION - EFFECT OF CONVECTOR DISCHARGE GEOMETRY
TESTセセエ、 ('f! . 0// /X I
•
I BASEBOARO IH.cJ 0 6 57 88 WINDOWA
:-r-
0>x
7 107 87 :z:'""'"
...
8 308 81 "':z: 0 a:!!! ... ... % X=Rセイ...
セセ...
y =QTセTG セ s W= " e =90' / . / / x LOEセx ッセ . ' 0 >c SASH-_-.
0 ":::?c ...0 M NTIN .--- 0 - V- a-SASH•
0 y 0 ':-1"Gセア
{
セ
Ney)',
セゥ
7 a:iAiセ[
,.,_--.../o...x
セ ...0. SASH.-
y FRAME..
' r{ v r'\ 0·20 0·30 (}40 0·50 0·608t,
- t 1= w-c 0·70 0:80 0·90 100 FRAME Nッセ 0"':"'-SASH - NセN - 0 _Mᄋセセゥャセ
TEST[セiエ、 ('f)[1 \
•
I 8ASEBOAROIN.CJ 0 6 47 89 WINDOWB
-_
... X 7 95 87 :z:. セW a 8 303 80 "'...
:z: a:",il \
セキ X= 3' ... :z: セGB Y= 14\' セ セ !!! w= " e= 90'セ ッ
/0
. =:..---0
_..->. SASH __N⦅セ⦅oZx .... a MUNTIN•
-cr'. .,..=-SASHO_'OrrO
-
-Gy0
セ
LGNセ
.
N :z:i " ,...
c:z: '"'"___
NOOOセO
x/
a:w ... :z: セセ セ」 ___...Mᄋセoセセ セ セ SASH.---
--
.-
.v--" FRAME eo-4(0
0·20 0·30 0·40 0·50 0·60 t-tc 1 = -tw-tc 0·70 0·80 0·90 1·00FIGURE 10
INSIDE - SURFACE TEMPERATURE INDEX PROFILES WITH FORCED
CONVECTION - EFFECT OF CONVECTOR DISCHARGE VELOCITY
FRAME SASH WINDOW
A
0 ) ( ., 10 sc .... クZセクM<,
NATURALセセ セセGHfGcNャ
augmenセ
CONVECTION HEATING (F.9/' HIGH VELOCITY /I
ッセN _' X _ . - - - ->0
•
/ // I /
II/!!
BASEBOARD) 0 0セ
I 4S·(FC.! II NATURAL HIGH AUGMENTED HEATING(F.CJ
I CONVECTION VELOCITY I Hセセ
. :
0/
f
1
!
. , /ッセセ
.s-:'
....
.--y e Vd Td TEST(IN.) (DEGl FPM ('F) • I BASEBOARD (N.C.! o 3- 2 IBOO 14 122 X B 141(a90' 30B 81 o 10 QセX 4S' 107 88 • iセ1\
90' 109 120 X =RセTG W= I" - NATURAL CONVECTION (Unde'- Window Heated •• TRIPLED HEAT LOADSASH MUNTIN SASH
-.
セ en ,.., :Z:II セセ en", a:l;; "':z: R:en BGセ ..J セ 0·20 0·30 0·40 0·50 0·60 t -tc 1 = -tw-tc 0·70 0·80 0·90 1·00 FRAME ._ o.; X.!... .-SASH - - - . __ 0 0 _ -:x_ - A _ MMMᄋMMセセセセッ.--...
Y セjヲv、 Id f I\
TEST I (IN.! DE FPM (OF)T
CD•
I BASEBOARD(N.C.) I\ \
I I-
I 0 3- 2 180' 10 liS IB
NZセ I WINDOW I•
I ,.., X 8 14Stl 90-303 80 I ",II I en>- I..
'" 0 10 RQセ 4S' 94 89 II ・ョセ I ",'"•
CDNセL
.
",'"•
II" 21/ 8 90' 97 liS I , セセ,
"'..
\ ..J 3',
セ X = BASEBOARDセ 4S·(F.C.! AUGMENTED HEATINGHセcj
W= I'
t
セ」イセ
•
NATURAL CONVECTION HIGH(Under -Window Heater) \I VELOCITY
..
TRIPLED HEAT LOAD LNセッ/0
•
.> /' I ____ - - __ .-:::::0 -=-2....--X_ _ _ _•
_--.-,;..-c=-
. . . - 0 - . ) ( - ...-. SASH ____-e- D- _0 -4<' _.-MUNTIN.-
-- o-v· )(.. .-SASH._---,
o0
xt
Nセク
Nセted
HEATING (F.C.) '" IIセhigh
VELOCITY • en>- l..
'" ,/ ・ョセ " , , , , BASEBOARO __' / NATURALD
HセcNI セ ",,,, ;JI:en , / CONVECTION 4S·(F.CJ °en --'et---.'
セo]oZZZZZZZZZZZZZZ[セ ---' ---セ _-•..e----SASH---.-
.=-0
FRAME.---
ッセ 0·20 0·30 0'40 0·50 0·60 t - tc 1 = -tw-tc 0·70o.so
0·90 1·00FIGURE II
INSIDE - SURFACE TEMPERATURE INDEX PROFILES WITH NATURAL
AND FORCED CONVECTION - OPTIMUM CONFIGURATIONS
MEASUREMENT OF HEAT TRANSMISSION COEFFICIENTS FOR WINDOWS A AND B
The over-all heat transmission coefficients or
"U"
values forwindows A and B were measured using the guarded hot box and the
cold-room facility which are described in NRC 6887. The air flow
conditions imposed on the warm and cold sides of the test windows
are also described. The air temperatures used in the guarded
hot-box tests were approximately O°F and 72°F on the cold and warm sides, respectively.
The metered te st area of 32 sq ft consisted of window and
supporting wall. The heat flow through the supporting wall was
obtained from an auxiliary hot-box test using a specimen of known conductivity in place of the window.
Surface temperatures on the window were measured with
copper -constantan thermocouple s fabricated and attached as described
in Section 3 of this report. The surface temperatures in the auxiliary
test were measured with twisted-junction thermocouples fabricated from 30-gauge copper and constantan wires.
The values listed in Table Al for the two windows were obtained in the following manner.
(a) Heat Transmis sion Coefficient
for Supporting Wall, U sw
A rigid-insulation panel of area, A
p' thickness, x , and
conductivity, k , was located in the supportmg wall in place of the
test window. The panel area was approximately equal to that of
the test window. The conductivity of the panel material was determined
previously in a guarded hot-plate test.
U sing air temperature s approximately equal to those used in the window test, the total heat flow through the wall and panel, Qt!,
was obtained with the guarded hot box. The mean temperature
difference across the surfaces of the insulation panel, 6tp ' and the
mean air temperature difference, btlt were also measured.
The heat flow through the supporting wall, Q s I, of area, (32 - A p)' was the difference between the total measured heat flow,
Qt!' and the heat flow calculated for the panel, Q • Thus,
k , A • 6t
.p P
x
The heat transmission coefficient for the supporting wall, U sw?
was then;
U
sw=
(32 - A ) • 6tp 1
(b) Window Heat Transmission Coefficient, U
w
With the window of area, A w' installed in the supporting
wall, the total heat flow through the window and wall, Qt2' was determined
with the guarded hot box. The mean air temperature difference acros s
the specimen, M 2, and the mean temperature difference between the
window surface and air on the cold and warm sides, Mo and Mi' were
also measured.
The heat flow through the supporting wall, Qs2' of area, (32 - A w), was approximated by
=
(32 - A )w Usw
The above expre s sion as sume s identical surface conductance values for the window test and the panel test; and does not account for the difference in heat flow conditions existing at the connection
between panel and supporting wall and between window and supporting
wall.
The window heat flow, Qw, was the difference between Q t 2 and
Qs2' and the over-all heat transmission coefficient, Uw ' was calculated
as
U
=
w(c)
U
Window Application Factor,
--..::!!.-U
as
The over -all heat transmis sion coefficient for an idealized glas s -enclosed air space, Uas' was calculated using the air - space
conductance value given in the 1960 ASHRAE Guide and Data Book for an air-space thickness equal to that of the test window, and using
the te rnpe r atur e s and surface conductance values obtained in the
present test.
The mean surface conductance values for the warm and cold surfaces of the window, f i and fo, were calculated from the window
heat flow, Ow' the window area, Aw ' and the mean temperature
difference between the window surface and air on the war rn and cold
sides, M i and .6.to' as follows:
f. = 1
o
w A • M. w 1 and f=
oc
w A • .6.t w 0u
wThe application factor, U is a rnea su r e of the heat
as
los s attributable to the metal sash and fr arrie rne mb e r s that, with
Test A B
A p
-
area of rigid insulation panel sq ft 14.5 14.1X
-
mean panel thickness in. 4.07 4.06k
-
thermal conductivity of rigid insulation Btu 0.'1.77 0.'1.77(hr) (sqft) (OF/in.)
...
III QJ E-t....
Btu QJa
t l total heat flow, insulation panel and wall 149.3 169.8
s::
-nl hr
o,
e tit mean panel-surface temperature difference of 65.6 64.9
0
-...
...
pnl
:; tIt
l
-
mean air temperature difference across specimenof 69.9 69.9
.,
.s
.
"Cl...
bO Btu...
a
セ
-
heat flow, rigid-insulation panelhr 64.7 6'1..4
p
a
heat flow, supporting wall Btu 84.6 107.4sl
-
hrU
-
heat transmission coefficient, supporting wall (hr) (sq ft) (OF)Btu 0.069 0.086sw
A
-
area of window sq ft 15.6 14.6w
a
t Z-
heat flow, window and wall Btu 666. 804.hr tIt
z
-
mean air temperature difference across specimen of 67.6 66.'1. tit-
mean temperature difference, cold window surface to cold air of 8. 10.80
tIt
i
-
mean temperature difference, warm air to warrr window surface°F 23.8 '1.8.... a
.,QJ s Z-
heat flow, supporting wall Btuhr 77• 99.E-t
セ
a
-
heat flow, window Btu 589. 705.-e W hr
.s
;t
Uw
-
heat transmission coefficient, window (hr) (sq ft) (OF)Btu 0.56 0.73f
i
-
inside surface conductanceBtu
1.6
(hr) (sq ft) (OF) 1.7
f
-
outside surface conductance Btu 4.7 4.50 (hr) (sq ft) (OF)
U
-
heat transmis sion coefficient, idealized Btu 0.54 0.55as (hr) (sq ft) (OF)
U w
window application factor


![[PDF] Support de cours détaillé d'introduction à la programmation réseau en Java](data:image/gif;base64,R0lGODlhAQABAIAAAP///wAAACH5BAEAAAAALAAAAAABAAEAAAICRAEAOw==)