Short-and long term niche segregation and individual
specialization of brown trout (
Salmo trutta)
in species poor Faroese lakes
Jakob Brodersen&Hilmar J. Malmquist&Frank Landkildehus& Torben L. Lauridsen&Susanne L. Amsinck&Rikke Bjerring&
Martin Søndergaard&Liselotte S. Johansson&Kirsten S. Christoffersen& Erik Jeppesen
Received: 24 January 2011 / Accepted: 14 August 2011 / Published online: 16 September 2011 # Springer Science+Business Media B.V. 2011
Abstract Trophic niche divergence is considered to be a major process by which species coexistence is facilitated. When studying niche segregation in lake ecosystems, we tend to view the niche on a one-dimensional pelagic-littoral axis. In reality, however, the niche use may be more complex and individual fidelity to a niche may be variable both between and within populations. In order to study this complexity,
relative simple systems with few species are needed. In this paper, we study how competitor presence affects the resource use of brown trout (Salmo trutta) in 11 species-poor Faroese lakes by comparing relative abundance, stable isotope ratios and diet in multiple habitats. In the presence of three-spined sticklebacks (Gasterosteus aculeatus), a higher pro-portion of the trout population was found in the DOI 10.1007/s10641-011-9914-z
J. Brodersen
:
F. Landkildehus:
T. L. Lauridsen:
S. L. Amsinck
:
R. Bjerring:
M. Søndergaard:
L. S. Johansson
:
E. JeppesenDepartment of Bioscience, Aarhus University, Vejlsøvej 25,
DK-8600 Silkeborg, Denmark
J. Brodersen
Department of Biology/Aquatic Ecology, Lund University, 223 62 Lund, Sweden
H. J. Malmquist
Natural History Museum of Kópavogur, Hamraborg 6a,
IS-200 Kópavogur, Iceland
K. S. Christoffersen
Freshwater Biological Laboratory, University of Copenhagen, Helsingørsgade 51, DK-3400 Hillerød, Denmark
E. Jeppesen
Greenland Climate Research Centre (GCRC), Greenland Institute of Natural Resources, Nuuk, Greenland
E. Jeppesen
The Sino-Danish Center for Education and Research (SDC),
Beijing, China
Present Address:
J. Brodersen (*)
Department of Fish Ecology and Evolution, EAWAG Swiss Federal Institute of Aquatic Science and Technology, Center of Ecology, Evolution and Biochemistry, Seestrasse 79,
CH-6047 Kastanienbaum, Switzerland e-mail: jakob.brodersen@eawag.ch
pelagic habitat, and trout in general relied on a more pelagic diet base as compared to trout living in allopatry or in sympatry with Arctic charr (Salvelinus alpinus). Diet analyses revealed, however, that niche-segregation may be more complex than described on a one-dimensional pelagic-littoral axis. Trout from both littoral and offshore benthic habitats had in the presence of sticklebacks a less benthic diet as compared to trout living in allopatry or in sympatry with charr. Furthermore, we found individual habitat specialization between littoral/benthic and pelagic trout in deep lakes. Hence, our findings indicate that for trout populations interspecific competition can drive shifts in both habitat and niche use, but at the same time they illustrate the complexity of the ecological niche in freshwater ecosystems.
Keywords Niche complexity . Stable isotopes . Trout . Stickleback . Aquatic ecology . Faroe Islands
Introduction
A central, but much debated (e.g. Hubbell 2001; Chase and Leibold2003) concept in ecological theory is the ‘ecological niche’. Hutchinson (1957; 1959) originally defined the ecological niche as a hyper-volume in an n-dimensional space with environmental variables as axes. However, empirical measurements of all potential dimensions will probably never be accomplished for any species occurring in a natural ecosystem (Chase and Leibold 2003). Ecologists are therefore challenged as they have to reduce the number of potential axes of resource specialization to a single or a few measurable axes. In lake ecosystems, the niche is often measured on a two-dimensional scale with limnetic/pelagic and benthic/ littoral organisms as end points (e.g. Schluter and McPhail 1992; Svanbäck and Persson 2009), which conveniently can be determined by two end-member stable isotope analyses (Post 2002). However, when treating the niche as a one-dimensional variable, we may trade-off the ability to measure the complexity of reality for convenience. Also we might end up measuring habitat use rather than niche. These concepts of habitat and niche are highly entangled, which is likely due to the confusion of whether niche refers to aspects of environment or species (Chase and Leibold 2003). There are in that regard a large
biological difference between how a species exploits a habitat and in which habitat a species forage.
However, it is not only important to recognize that each species has a certain niche, but also to acknowledge that each individual in a population may vary in its niche use, both compared to other individuals, but also temporally. The importance of individual phenotypic variation is generally recog-nized as the raw material on which evolution acts. Individual flexibility may enable adaptation to current conditions in the changing environment, and the sum of individual adaptations will shape the response of populations to variations in the environment, for instance changed competition or predation pressure. Competition may particularly affect niche use. In sympatry, ecologically similar species are expected to diverge in habitat use and/or diet, whereas in allopatry, species are expected to converge in their use of the same primary resources (MacArthur and Levins 1967; Schoener1982; Tilman1987).
In fishes, partitioning of resources by ecologically similar species has been well documented, in partic-ular among Arctic charr (Salvelinus alpinus (L.)) and brown trout (Salmo trutta L.) in temperate lakes (Langeland et al.1991; Jansen et al.2002, Klemetsen et al. 2003; Jonsson et al. 2008). In sympatry, charr and trout populations usually utilize distinct habitat and prey resources. Generally, charr feed on zoo-plankton in offshore habitats, while trout utilize the littoral zone and feed on benthic invertebrates and surface arthropods (Langeland et al.1991; Klemetsen et al. 2003; Jonsson et al.2008). In allopatry, charr, but not trout, usually alter their use of resources and exploit the littoral zone to a greater extent. Therefore, trout are usually regarded the competitively superior, and shifts in charr habitat use are ascribed to trout forcing charr to use alternative resources (e.g. Klemetsen et al. 2003). While this pattern is well described in the literature, less is known about resource use by brown trout living in sympatry with fish species other than Arctic charr. An emerging question is whether more specialized littoral species may drive trout into a more pelagic resource use.
Undertaking field studies on competition and behavioral adaptations is difficult because the ob-served behavior is the sum of complex interactions, where each consumer displays dietary overlap with several other species (Tilman 1987; Hansson 1995). Therefore, species-poor ecosystems serve as valuable
sites for the study of behavioral interactions and niche segregation. On the Faroe Islands, situated in the Mid-Atlantic, a total of seven freshwater fish species occur, but a maximum of four coexist in a single lake (Jeppesen et al. 2002a; unpubl. data). Most Faroese lakes host brown trout only, but in some lakes other fish species co-occur, usually only three-spined stickleback (Gasterosteus aculeatus L.).
A previous study of four Faroese lakes revealed that in the one lake with Arctic charr, Lake Leynavatn, brown trout relied more on benthic food than in the lakes without charr (Malmquist et al.2002). Moreover, the density, somatic growth and condition factor of trout were lowest in Leynavatn (Malmquist et al. 2002). Stable isotope investigations supported the suggestion that interspecific competition between trout and charr was important in Leynavatn, with trout diet appearing to be of a more littoral origin (Jeppesen et al.2002b). This study also indicated that the presence of three-spined sticklebacks in other lakes may drive trout into a more pelagic feeding mode (Jeppesen et al.2002b). However, in order to verify this theory, more compre-hensive studies with more lakes are needed.
In this study we investigated the differences in habitat use and diet of brown trout in eleven species-poor Faroese lakes with notably different fish communities. Our aim was to determine if the habitat use and diet of trout were affected by fish community structure and other environmental vari-ables such as lake depth, area, and nutrient status. We also examined the role of body size of trout in relation to diet and habitat as another metric of competitive interactions. We expected that the fundamental niche as described by diet and habitat of brown trout in lakes with only trout would differ from the realized niche described by diet and habitat use in lakes with presence of potential fish competitors, i.e. Arctic charr and three-spined sticklebacks.
Materials and methods
Study area
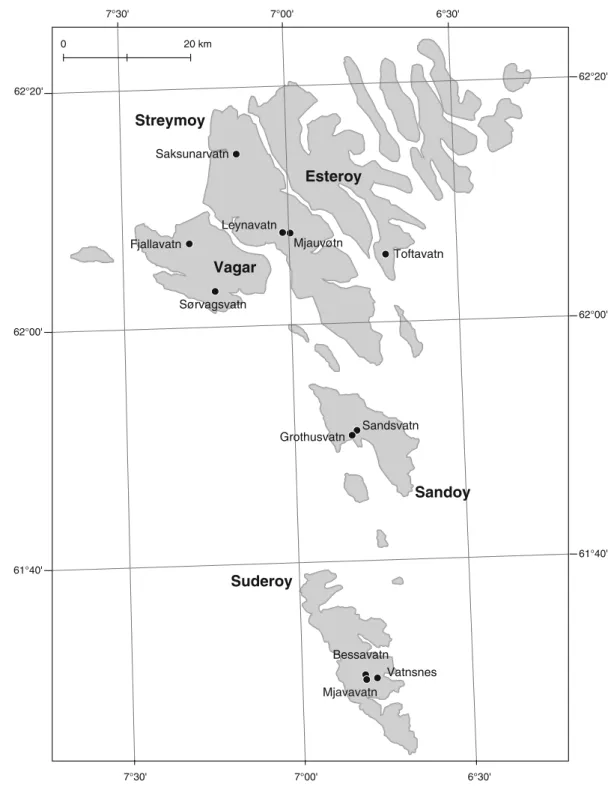
All sampling was carried out during July–August 2000 in 11 lakes located on the five largest Faroese islands (Fig. 1). The lakes included a wide range of areas (0.6–356 ha) and depths (max depth: 0.7–52 m)
(Table 1). Total phosphorous concentrations varied, with the highest nutrient levels occurring in Lake Vatnsnes which is used for rearing Atlantic salmon (Salmo salar L.) in cages. Brown trout is the most widespread freshwater fish species on the Faroe Islands and occurred in all the study lakes. Three-spined stickleback (hereafter sticklebacks) were found in five and European eel (Anguilla anguilla L.) in four of the study lakes. Arctic charr, European flounder (Platichthys flesus (L.)) and Atlantic salm-on occurred salm-only in salm-one study lake (salmsalm-on due to fish farming). As shown in Table1, the lakes varied substantially in a number of physical, chemical and biological parameters, all of which can be hypothe-sized to influence trout ecology. Compared to analysis of very similar lake types, this will further enable us to evaluate the relative importance of competitor presence/ absence compared to other environmental factors. For further information on the characteristics of Faroese lakes, see Landkildehus et al. (2002).
Fish sampling
Fish were caught in multi-mesh sized gill nets (type NORDIC: 14 different mesh sizes ranging from 6.25-75 mm (Appelberg et al. 1995)), placed overnight. “Littoral nets” were set parallel to the shore at a depth of 1.5 m, offshore nets in the middle of the lake along the major length axis of the lake- either at the bottom, “offshore benthic net” and in lakes with a maximum depths >8 m also in the mid pelagic (in half the depth of the epilimnion), “pelagic nets” (Jeppesen et al. 2001). The number of nets ranged between 4 and 9 per lake depending on area and depth, except in Mjavavatn, a small lake where only one mid-lake offshore benthic net was used. Catch per unit effort of trout (CPUE: #trout net−1h−1) was used as a measure for relative fish density, both for each habitat within a lake and as an average for all nets per lake. Each fish was measured (fork length) to the nearest mm and weighed to the nearest 0.1 g. Based on individual fish weights, we further calculated trout biomass per unit of effort (BPUE).
Brown trout stomachs were removed after capture and stored individually in 96% ethanol. Brown trout, Arctic charr and sticklebacks were frozen individually for stable isotope analysis. Although sticklebacks were often caught in gill nets, we additionally sampled the lakes with fyke nets and shoreline netting
to validate presence/absence of sticklebacks. In Sandsvatn, Sørvágsvatn and Toftavatn, sticklebacks sampled with fyke nets were additionally used for stable isotope analyses.
Stomach content analysis
Stomach contents of 165 trout (7.5–39.5 cm) were enumerated and identified to the lowest taxonomic
' 0 3 ° 6 ' 0 0 ° 7 ' 0 3 ° 7 61°40' 62°00' 62°20' ' 0 3 ° 6 ' 0 0 ° 7 ' 0 3 ° 7 61°40' 62°00' 62°20' Saksunarvatn Sandsvatn Grothusvatn Bessavatn Vatnsnes Mjavavatn Leynavatn Mjauvøtn Fjallavatn Sørvagsvatn Toftavatn Esteroy Streymoy Vagar Sandoy Suderoy m k 0 2 0
level possible. For each lake a maximum of eight fish, representing all sizes if possible, was selected randomly from the fish caught in each of the three habitats sampled: the littoral, the pelagic and the mid-lake offshore benthic nets defined above.
Stomach contents were identified and counted using a dissection microscope. Food items were identified to group (Hirudinea, Hydracarina, Turbel-laria and Diptera other than mentioned below), order (Coleoptera, Heteroptera, Trichoptera and Ostracoda, Copepoda), family (Tipulidae), subfam-ily (Chironominae, Orthocladinae, Tanypodinae), genus (Gammarus, Lymnaea, Pisidium, Daphnia, Alona, Eurycercus, Acroperus, Bosmina, Holope-dium and Chydorus) or species level (Gasterosterus aculeatus). Insects were furthermore categorized as larvae, pupae or adults.
Stable isotope analysis
To compare the relative contribution of pelagic and littoral components to the diet, and to determine the trophic level of the diet of trout and stickleback, we performed analyses of the stable carbon and nitrogen isotope content. Approximately 5–8 mg (wet weight) of white dorsal muscle was extracted from each fish. During sorting, all samples were kept at room temperature for as short a time as possible, after which they were frozen again before being
lyophi-lized. Lyophilized samples were homogenized and packed into tin capsules (4×6 mm). The samples were analyzed for δ13C and δ15N isotopes using a PDZ Europa ANCA-GSL elemental analyzer interfaced to a PDZ Europa 20–20 isotope ratio mass spectrometer at the UC Davis Stable Isotope Facility, USA. Since lipid corrected values showed little deviation from original values (Δδ13
C; average =0.10; SD=0.31) due to relatively low C:N-ratios (average= 3.46; SD= 0.31), indicating a relatively low lipid content (Post et al.2007), we used originalδ13C-values rather than lipid corrected ones.
Averageδ13C-values for littoral invertebrates (chiro-nomidae, Lymnaea sp., Eurycercus sp., Gammarus sp., Haliplus spp., Helopdella spp., Hydracarina spp., Limnephilidae, Phryganeidae sp., Polycentropus, Tipulidae) and periphyton scraped of stones collected in the littoral zone were used as littoralδ13C-baseline. Since large mussels were not found, and collected Pisidium sp. turned out to yield unrealistic baselines, we used zooplankton as the pelagic baseline. The relative contribution of pelagic resources in diet was calculated from the 2-end-member-mixing model (Post2002):
where ά is the proportion of carbon obtained from the base of food web 1 andδ13Cscis the stable isotope ratio
of the secondary consumer. Our two-end-members were Table 1 Characteristics of the 11 Faroese study lakes.
Chlorophyll data are from Amsinck et al. (2006). A=lake area
(ha); Ptot=total phosphorus (μg l−1), Zm=maximum depth (m);
S=Secchi depth (m), Chl a=chlorophyll a (μg l−1); Zoo=
crustacean zooplankton (# l−1). CPUE data refer to average
number caught per net per hour. Fish fauna: T: Brown trout; TS: Three-spined stickleback; C: Arctic Charr; E: Eel; S: Atlantic Salmon and F: Flounder. *In Sørvágsvatn, no sticklebacks were caught in gill nets, some individuals being caught in fyke nets
Lake A Zm Ptot S Chl a Zoo CPUET CPUETS CPUEC CPUES CPUEF Fish fauna
Mjávavatn 0.6 0.8 19 0.8 1.81 0.0 0.50 0 0 0 0 T Bessavatn 5.4 2.0 30 2.0 1.98 54.0 0.22 0 0 0 0 T Saksunarvatn 8.1 16.0 6 8.8 1.13 53.2 0.35 0 0 0 0 T & E Mjáuvøtn 3.1 5.7 15.2 4.3 1.76 175.5 1.83 0 0 0 0 T Leynavatn 18.0 32.5 3.4 10.0 1.23 21.7 0.51 0 1.06 0 0 T & C Vatnsnes 14.7 9.5 76 1.7 25.17 42.5 0.22 0 0 0.04 0 T & S Sandsvatn 79.7 2.4 43 2.4 1.05 85.6 0.38 0.02 0 0 1.02 T, TS, F & E Gróthúsvatn 13.4 0.7 35 0.7 1.03 22.8 0.69 0.01 0 0 0 T, TS & E Sørvágsvatn 356.0 52.0 5.2 12.5 0.72 5.2 0.36 0* 0 0 0 T & TS Toftavatn 52.2 17.5 10.8 5.8 0.98 25.6 0.21 0.03 0 0 0 T, TS & E Fjallavatn 101.9 46.6 3 14.0 0.46 4.8 0.56 0.02 0 0 0 T & TS
the bases of the pelagic and littoral food webs (base1 and base2, respectively) ά was constrained to be between 0 and 1. Sinceδ15N values were solely used for within-lake comparisons, baseline values were not needed forδ15N.
Environmental variables
Depth integrated samples of zooplankton were taken at a mid-lake station with a modified Patalas sampler (3.3 L). Zooplankton was identified under a stereo microscope and counted in the lab (for more details, see Amsinck et al.2006). Total phosphorous was measured as described by Jensen et al. (2002) and chlorophyll a was determined according to Christoffersen et al. (2002). These samples were taken simultaneously with the fish samples.
Data treatment and statistical analysis
To test for possible effects of environmental variables (lake area, Zmax, Chl a, Ptotzooplankton density and
presence of charr and stickleback) on the density (CPUE) and biomass (BPUE) of trout, we used multiple analysis of variance (MANCOVA, Wilks Lambda).
For statistical analysis, food items were divided into the following groups: zooplankton (Daphnia, Bosmina, Holopedium, Chydorus and Copepoda), benthic cladocerans (Eurycercus, Alona and Acrope-rus), chironomid larvae (larvae of Chironomidae), insect pupae (pupae of Chironomidae, Trichoptera, and other flies), emerged insects (emerged insects of Chironomidae, Trichoptera, Tipulidae, other flies and terrestrial insects), and benthic macroinvertebrates (Hirudinea, Pisidium, Lymnaea, Hydracarina, Gam-marus, Trichoptera larvae, Coleoptera larvae and adults, Turbellaria and Heteroptera). This resulted in six different diet groups. For each group we calculated the proportion of the total diet as the number of food items in the given group divided by the total number of food items in the stomach. The effect of stickleback presence on trout diet was tested with a nested MANCOVA (Wilk’s lambda; lake nested under the presence/absence of sticklebacks) on arcsine trans-formed data with the individual fish length as a covariate. Differences in ά-values between lake types were tested with a nested ANOVA. Lakes were in both cases treated as fixed rather than random factors, since
stickleback presence was not randomly assigned to the different lakes, but is expected to be fixed for each lake, i.e. a lake with sticklebacks is assumed to host sticklebacks at every revisit (see discussion in Bennington and Thayne 1994 and Domenici et al.2008). This complies with common practice when analyzing effects of predator presence in different lakes (e.g. Reznick and Endler 1982; Reznick1989; Leips and Travis 1999; Kelly et al. 2000; Jennions and Telford2002; Langerhans et al.2004; Domenici et al. 2008).
To test for the relative importance of environmental variables, including presence/absence of stickleback competitors, on the stomach composition of trout, we used ordination analysis. Canonical Correspondence Analysis (CCA) was performed due to a high gradient length of axis 1 in Detrended Canonical Analysis (3.029 standard units). Seven environmental variables (lake area, maximum depth, total phosphorous, chlorophyll a content, zooplankton density, density of trout (catch per unit effort) and presence-absence data on sticklebacks) were included in the CCA. To explore the relative importance of the 7 environmental variables these were run as sole environmental variables in CCA analyses. The larger the ratio between the eigenvalue of CCA axis 1 (λ1) and CCA axis 2 (λ2) the more variation explained by the single environmental variable.‘Species’ data were arcsine-transformed stom-ach content data, i.e. the proportion of estom-ach diet group (based on the average values of stomach content for each lake), whereas environmental variables were log transformed with the exception of presence-absence of sticklebacks.‘Species’ occurring only in one lake were excluded from the analysis. For the CCA, the benthic macroinvertebrate group was split into individual taxa (see above).
Sticklebacks may act both as competitors and as prey for trout. Since piscivorous trout are known to prey more heavily on sticklebacks than on trout, fish will likely be a more frequent diet item in the presence of sticklebacks as a consequence of prey availability rather than competition. Thus, when fish occurred in the diet of trout they were excluded from the analysis to avoid a false positive result of competition. Furthermore, we excluded the largest trout caught (> 40 cm; N=5) from the diet and isotopic analyses, since they were likely to be obligate piscivores. These trout had little or nothing in their stomachs.
Results
Fish abundance, habitat distribution and population demography
Catch per unit effort of trout (CPUE; Fig. 2) ranged between 0.02 trout hour−1 net−1 (Vatnsnes, pelagial nets) and 2.00 trout hour−1 net−1 (Mjauvötn, littoral nets). In all lakes but Leynavatn and Sandsvatn, brown trout was the most abundant fish species in the catches of all three habitats sampled. Arctic charr occurred only in Leynavatn where it dominated the catch in the offshore benthic and pelagic habitats. European flounder was found only in Sandsvatn, where it dominated the catch in both habitats sampled (littoral and offshore benthic). Three-spined sticklebacks were caught in five of the 11 lakes sampled (Table 1). In the six deepest lakes, where pelagic nets were used, the number of trout caught in pelagic nets relative to the total number of trout caught was significantly higher in lakes with sticklebacks (10.7–45.6%) than in lakes without
sticklebacks (2.9–3.8%) (Mann–Whitney U-test, Z =−1.96; p=0.05). Neither the density (CPUE) nor the biomass (BPUE) of trout in the lakes was related to any of the environmental variables, including presence of competitors (MANCOVA; Wilks Lambda; p>0.05 for all). The size of trout varied highly significantly between the lakes (Kruskal-Wallis test; χ2
= 154.6; p<0.001; Fig. 3); the difference was, however, not related to any of the environmental variables, including presence of other species.
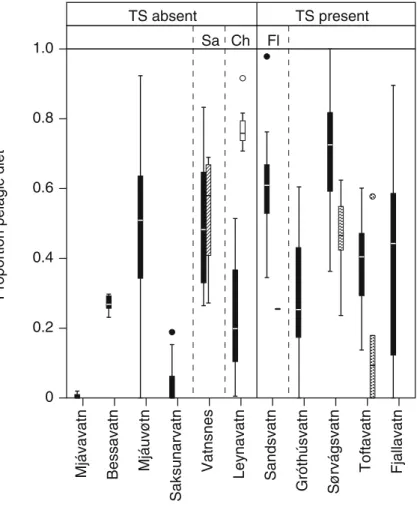
Long term resource use: Stable isotope analyses
Trout in lakes with sticklebacks were found to have significantly higher ά-values, indicating a relatively higher dependence on pelagic resources than trout from lakes without sticklebacks (nested ANOVA; F= 50.4; p<0.001; Fig. 4). The ά-values were generally habitat-dependent (Two-way ANOVA, lake random factor; F=7.40; p<0.001), with pelagic trout having a
TS absent TS present Ch Fl
Sa
CPUE (no. net
–1 hour –1) 0 1.0 0.5 1.5 2.0 2.5 Littoral Benthic Pelagic Fjallavatn Toftavatn Sørvágsvatn Sandsvatn Leynavatn Gróthúsvatn Vatnsnes Saksunarvatn Mjáuvøtn Bessavatn Mjávavatn
Fig. 2 Catch per unit effort (CPUE: # trout net−1h−1) of brown
trout in three different habitats, i.e. littoral, pelagic and offshore benthic, in eleven Faroese lakes with contrasting fish assemb-lages (TS: three-spined stickleback present; Sa: Atlantic salmon present; Ch: Arctic charr present; Fl: flounder present)
* * * TS absent TS present Ch Fl Sa Length (cm)
Mjávavatn Bessavatn Mjáuvøtn
Saksunarvatn Vatnsnes Leynavatn Sandsvatn Gróthúsvatn Sørvágsvatn Toftavatn Fjallavatn 0 10 20 30 40 50
e e b,c,d d,e a a,b,c e c,d,e a,b b,c,d b,c,d ns * *** ns ** ns ns *** ** ns
Fig. 3 Length distribution of brown trout from 11 Faroese lakes with contrasting fish assemblages (TS: three-spined stickleback present; Sa: Atlantic salmon present; Ch: Arctic charr present; Fl: flounder present). Grey bars denote fish caught in the littoral zone, open bars denote fish caught offshore in pelagic or benthic nets (see text). Boxes represent the interquartile range (containing 50% of values), lines across boxes indicate medians, and whiskers extend to the highest and lowest values, excluding statistical outliers (circles) and extreme values (vertical asterisks). Letters above bars show results of a non-habitat specific post hoc test for between-lake differences and asterisks indicate significant size difference between habitats
more pelagic isotopic signature (higher ά-values) compared to both littoral and off-shore benthic caught trout (Tukey post hoc test; p <0.001 for pelagic against both littoral and off-shore benthic trout). Littoral and off-shore benthic trout were not found to have different isotopic signatures (Tukey post hoc test; p=0.146). This pattern was consistent to all deep lakes, i.e. lakes where pelagic nets were used, with pelagic caught trout on average having a more pelagic signal than both littoral and off-shore benthic caught trout.
In all three lakes with a sufficient number of sticklebacks caught to allow statistical analyses, trout had significantly more pelagic isotopic sig-nals, i.e. higher ά-values, than sticklebacks (ANOVA; F > 6.1 for all; p < 0.027 for all; Fig. 4). In the one lake containing charr, trout had a significantly more littoral isotopic signal, i.e. lower
ά-values, than charr (ANOVA; F=68.7; p<0.001), whereas there was no difference between trout and salmon in the one lake containing salmon (ANOVA; F = 0.151; p = 0.70).
The level of δ15N-value in Sandsvatn differed significantly between sticklebacks (average±SD; 4.4± 0.42) and trout (4.0 ± 0.54) relative to length (ANCOVA; F=15.59; p=0.001), sticklebacks having a higher δ15N-value compared to small trout. In Sørvágsvatn, there was no effect of length and no significant difference between δ15N-value of trout (5.1±1.2) and sticklebacks (5.0±0.88) (ANCOVA; F=0.142; p=0.709), and in Toftavatn, sticklebacks (5.4±0.34) had a significantly higher δ15N-value than trout (3.7 ± 3.6) (ANCOVA; F = 22.54; p < 0.001). Hence, the δ15N-values of sticklebacks were in none of the lakes lower than the δ15N-values recorded for similar sized trout.
TS absent TS present Ch Fl Sa Fjallavatn Toftavatn Sørvágsvatn Sandsvatn Leynavatn Gróthúsvatn Vatnsnes Saksunarvatn Mjáuvøtn Bessavatn Mjávavatn
Proportion pelagic diet
1.0 0.8 0.6 0.4 0.2 0 Stickleback Charr Salmon Trout
Fig. 4 Relative contribu-tion of pelagic resources (ά) calculated from relative
content ofδ13C (see text) in
trout, sticklebacks, charr and salmon from eleven Faroese lakes with contrasting fish community composition
Short term resource use: direct diet observations
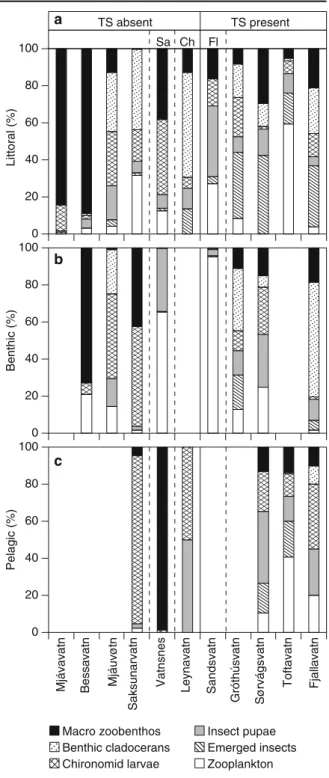
We found substantial variation in the stomach contents of trout between lakes and within lakes (Fig.5). The presence of sticklebacks significantly affected the diet of trout caught in the littoral zone (MANCOVA (lake nested under the presence or absence of sticklebacks); Wilks’ lambda=7.982; p<0.001). In particular, there were significant differences in the proportion of emerged insects and benthic macroinvertebrates in the trout diet, the former being higher and the latter lower in the presence of sticklebacks. Although only margin-ally significant, also the share of benthic cladocerans and insect pupae in the stomach of trout tended to differ depending on stickleback presence (Table 2). However, individual fish length, used as a co-variate in the analysis, was not found to have any effect on trout diet (Wilks’ lambda=0.626; p=0.709).
The diet of trout in the offshore benthic habitat was significantly affected by the presence of sticklebacks (MANCOVA (lake nested under the presence or absence of sticklebacks); Wilks’ lambda=4.248; p=0.002), but not by individual fish length (MANCOVA; Wilks’ lambda=0.807; p=0.132). Tests of between subject effects (Table 2) show that benthic trout from stickleback-containing lakes fed significantly more on emerged insects and benthic cladocerans and less on chironomid larvae and benthic macroinvertebrates.
In both the littoral and the offshore benthic habitats, there were significant lake effects on trout diet (MANCOVA; littoral: Wilks’ lambda=3.259; p< 0.001; benthic: Wilks lambda=6.259; p<0.001). This difference was evident for all diet groups (p<0.05 for all; Table2). An effect of stickleback presence on the diet of pelagic trout could not be traced, since few pelagic trout were caught in lakes without sticklebacks. Excluding the effect of habitats, the multivariate CCA showed that lake area and the presence of
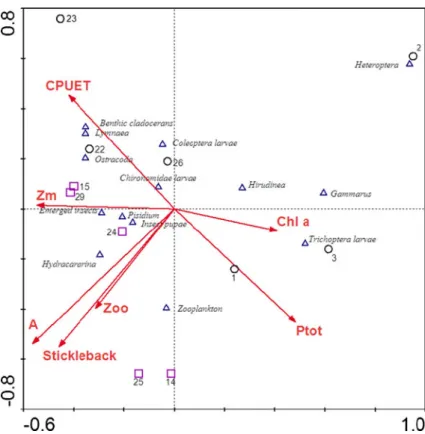
sticklebacks explained most of the between-lake variation in the stomach contents of trout (Table 3). These variables were, however, significantly correlat-ed (Mann–Whitney U-test; p=0.018), which is also seen from the ordination including all 7 environmen-tal variables (Fig. 6). The ordination (Fig. 6) showed
Fig. 5 Relative proportion by number of food items in the stomach of brown trout from three different habitats of eleven Faroese lakes. Taxa were grouped into zooplankton (Daphnia, Bosmina, Holopedium, Chydorus and Copepoda), benthic clado-cerans (Eurycercus, Alona and Acroperus), chironomid larvae (larvae of Chironomidae), insect pupae (pupae of Chironomidae, Trichoptera, and other flies) and emerged insects (emerged insects of Chironomidae, Trichoptera, Tipulidea, other flies and terrestrial insects), and other benthic macroinvertebrates (Hirudinea, Pisidium, Lymnaea, Hydracarina, Gammarus, Trichoptera larvae, Coleoptera larvae and adult Turbellaria, and Heteroptera)
a b c Macro zoobenthos Benthic cladocerans Chironomid larvae Insect pupae Emerged insects Zooplankton TS absent TS present Ch Fl Sa ) %( l ar ott i L ) %( ci ht n e B Pelagic (%)
Mjávavatn Bessavatn Mjáuvøtn
Saksunarvatn Vatnsnes Leynavatn Sandsvatn Gróthúsvatn Sørvágsvatn Toftavatn Fjallavatn 0 20 40 60 80 100 0 20 40 60 80 100 0 20 40 60 80 100
that stickleback presence was related to relatively high proportions of zooplankton and insects (pupae and emerged) as well as Pisidium and Hydracarina in the trout diet, whereas food items such as Heteroptera,
Hirudinea, Gammarus and Trichoptera were mainly found in trout stomachs from stickleback-free lakes. In the charr-containing lake, zooplankton did not occur in the trout stomach contents.
Table 2 Presence/absence of stickleback (TS presence) and lake effects on diet numerical composition of brown trout in the littoral and the offshore benthic zones. Both TS presence and lake effects were tested with nested MANCOVA (lake nested
under stickleback presence/absence with fish length as a co-variate, see text). Values in the table refer to subsequent ‘between-subjects effects’ tests. Length is not included in the tables as it was not significant in any of the habitats
Diet group Type III ssq d.f. mean square F p
Littoral TS presence Zooplankton .305 1 .305 2.420 .124 Chironomid larvae .160 1 .160 2.077 .154 Benthic cladocerans .373 1 .373 3.941 .051 Insect pupae .157 1 .157 3.085 .084 Emerged insects 1.344 1 1.344 20.120 < .001 Benth. macroinvert. 2.244 1 2.244 21.027 < .001
Lake effects (TS presence) Zooplankton 3.659 9 .407 3.223 .003
Chironomid larvae 1.439 9 .160 2.070 .044 Benthic cladocerans 3.509 9 .390 4.115 < .001 Insect pupae 1.063 9 .118 2.314 .025 Emerged insects 1.245 9 .138 2.071 .044 Benth. macroinvert. 8.796 9 .977 9.157 < .001 Benthic TS presence Zooplankton .130 1 .130 1.094 .301 Chironomid larvae .417 1 .417 5.976 .018 Benthic cladocerans .647 1 .647 7.616 .008 Insect pupae .003 1 .003 .050 .824 Emerged insects .052 1 .052 6.955 .011 Benth. macroinvert. .707 1 .707 6.543 .014
Lake effects (TS presence) Zooplankton 11.519 6 1.920 16.121 < .001
Chironomid larvae 2.128 6 .355 5.081 < .001
Benthic cladocerans 3.346 6 .558 6.568 < .001
Insect pupae 1.283 6 .214 3.085 .012
Emerged insects .195 6 .033 4.384 .001
Benth. macroinvert. 5.405 6 .901 8.333 < .001
Environmental variable CCA11/CCA 12 11 % explained F-ratio P-value
Lake area 0.629 0.302 21.0 2.391 0.039 Stickleback presence 0.533 0.276 19.2 2.136 0.047 Zmax 0.444 0.198 13.8 1.436 0.198 Ptot 0.433 0.228 15.9 1.696 0.143 Trout CPUE 0.370 0.199 13.8 1.450 0.233 Zooplankton biomass 0.326 0.181 12.6 1.292 0.246 Chlorophyll a 0.283 0.147 10.2 1.022 0.382 Table 3 Results
from CCA’s including only
one variable at the time. Variables sorted by decreasing importance for the between-lake
varia-tion.‘% explained’ denotes
the total percentage explained of the
between-lake variation (no covariation included)
Discussion
The interactions between species drive individuals to change their use of resources, leading to an apparent altered niche use of populations (Bolnick et al.2007). Jeppesen and co-workers (2002b) suggested that competition from three-spined sticklebacks could modify the relative use of pelagic and littoral resources in trout. In this study, we confirm this suggestion with results both from relative distribution, stable isotope analyses and direct diet observations. We also found evidence that trout in some lakes, besides the general effect of competitors on the populations relative pelagic/littoral resource use, individually specialized in habitat usage. While the competitors appeared to affect trout at population level, the individual specialization in habitat use seems to be dependent on habitat availability, i.e. the availability of the pelagic habitat.
However, our results also suggest that by treating the niche as a one-dimensional pelagic-littoral vari-able, we might miss the larger picture. The observed diet differences show that both littoral and off-shore benthic trout in the presence of sticklebacks would
feed more on emerged insects and less on benthic macroinvertebrates, and in off-shore habitats also less on chironomid larvae. Such a difference in diet, being short or long term, would require different hunting modes and microhabitat use, with emerged insects caught on the surface and benthic macro-invertebrates and chironomid larvae caught on the bottom substrate, even though the different prey types, at least in the littoral habitat, may be relatively close to each other. Such a specialization would be difficult to trace in the isotopic signature, since most of the emerged insects in the diet were of aquatic origin and hence belonged to either the chironomid larvae or benthic macroinvertebrate diet group at an earlier life stage.
Although foraging in the littoral habitat may, particularly in shallow lakes, be more profitable than in offshore habitats, for example due to greater abundance of large, energetically rewarding food items, this may not apply to all lake types. Especially in deep lakes, the relative importance of the pelagic zone in terms of food availability may be greater than in the littoral zone (e.g. Gasith 1991; Jeppesen et al. 1997; Horppila et al.2000; Vadeboncoeur et al.2002). Fig. 6 Canonical
correspon-dence analysis (CCA) plot of brown trout stomach content (arcsine transformed relative proportions) and 7 environ-mental variables
(abbrevia-tions see Table1). CCA
axis 1 and 2 explain 41% and 23% of the variation, respectively. Species variables: triangles, environ-mental variables: arrows, lakes: circles: lakes without stickleback, squares: lakes with stickleback
Interestingly, however, it appears that the relative dependency of the pelagic habitat is more related to the presence of competitors than to physical lake characteristics. Specifically, our multivariate analysis (Fig. 6) suggests that trout in lakes with sticklebacks utilize more open-water food items, such as zooplank-ton, emerged insects and insect pupae as compared to lakes without sticklebacks, where they feed more on bottom-associated food items, such as benthic cladocerans and benthic macroinverte-brates. Since sticklebacks were generally found in the larger, albeit not deeper, lakes, it was in principle not possible from the CCA analysis to determine whether the difference in diet between lakes was due to competitor presence or lake area. Whereas lake depth and/or volume are known to have a number of effects on lake ecosystems, such as periphyton vs. phytoplankton contribution to primary production (Vadeboncoeur et al. 2003; Vadeboncoeur et al. 2008), zooplankton community structure (Amsinck et al. 2006), fish population structure (Riget et al. 2000), fish assemblages (Mehner et al. 2007), top-down control (Jeppesen et al.2003), ecological effects of lake area appear to be rather weak (e.g. Søndergaard et al.2005). Since neither lake depth nor lake volume were related to stickleback presence or trout diet, we see it as more likely that the observed diet differences between lakes are related to competitor presence rather than to lake area. Assuming that charr is a more effective zooplanktivore than trout, due to its evolved behav-ioral and morphological traits (e.g. Malmquist 1992; Forseth et al. 2003; Klemetsen et al. 2003), charr may be a strong competitor in large, deep lakes where the pelagic niche is prominent, as in deep Leynavatn. Indirect evidence for this is also provided by large, deep Lake Takvatn, Norway, where an increase in the density of brown trout was attributed to competitive release followed by a decrease in the density of Arctic charr (Klemetsen et al. 2002; Amundsen et al.2007).
As with many other species, two individual trout will never exploit their resources in an exactly similar fashion. This may be due to stochastic differences in encounter rate with different prey types or it may be due to individual specialization. By analyzing direct diet observations, it is rarely possible to distinguish between random differences in diet and actual individual specialization, even when comparing fish
from different habitats, as the stomach content of any individual will be dependent on the habitat in which it most recently foraged, which will often be the same as the habitat in which the fish was caught. However, stable isotope analysis provides a longer time average of littoral/pelagic dependency, which reduces the influence of stochastic prey encounter, and can therefore be used to describe individual specialization more accurately. It is noteworthy that pelagic-caught trout, in the deepest Faroese lakes, where we also conducted sampling with pelagic gill nets, differed in isotopic signal from trout caught both in the littoral and the shore benthic area, especially since off-shore benthic invertebrates often have a more pelagic signal than littoral benthic invertebrates (e.g. Hershey et al.2006), as has been observed in the Faroese lakes (E. Jeppesen and J. Brodersen unpubl. data). If individual fish showed fidelity to all habitats, we would have expected to see pelagic and off-shore benthic trout to differ in isotopic signature from littoral trout. However, it appears that intra-population specialization occurs along a pelagic-benthic gradient, where the latter includes both the littoral and the off-shore benthic habitats.
In six out of the seven deepest Faroese lakes brown trout tended to be smaller in the littoral habitat than in the off-shore benthic and pelagic habitats. Such a pattern has been observed for trout in other relatively deep lakes (e.g. Klemetsen et al.2003; Saksgård and Hesthagen2004) and may be explained by the greater structural complexity of the littoral zone, offering better refuge to small fish (Werner and Gilliam1984). In general, brown trout often display ontogenetic diet shifts, switching from relatively small invertebrate food items to large items such as sticklebacks and other fish species (L’Abée-Lund et al. 1992, 2002; Kahilainen and Lehtonen 2002; Klemetsen et al. 2003). However, the habitat specific diet of the Faroese trout was not related to size, suggesting that ontogenetic changes occur in habitat choice, but not in habitat specific diet.
In conclusion, brown trout in Faroese lakes should be regarded as a generalist species (MacArthur and Levins 1967), potentially facing competition from more specialized pelagic Arctic charr and benthic feeding three-spined sticklebacks. Whereas generalist species are often found to struggle under competition from multiple directions (e.g. Werner 1977), this is not the case for Faroese trout, since in no lakes does it
face competition from both sides. Besides the popu-lation effects of competition on popupopu-lation niche use characteristics, we have shown that individual trout specialize in pelagic/benthic habitat use whenever the lake characteristics allow this. Lastly, our study illustrates the complexity of niche use in freshwater lakes and the potential shortcomings of applying a one-dimensional axis for describing niche use.
Acknowledgements We are grateful to Jane Stougaard Pedersen,
Karina Jensen and Lissa Skov Hansen for identification of zooplankton samples. Special thanks go to Kirsten Landkildehus Thomsen for chemical analysis and Anne Mette Poulsen for manuscript editing. We also wish to thank Juana Jacobsen and Kathe Møgelvang for graphical layout. The project was partly funded by the Carlsberg Foundation, The Nordic Arctic Research
Programme 1999–2003 and The Danish North Atlantic
Research Programme. The study was also supported by
the EU projects EUROLIMPACS (www.eurolimpacs.ucl.ac.
uk) and WISER (www.wiser.eu), REFRESH, CRES,
Green-land Research Centre and by Galathea 3. Furthermore, we thank Andy Jones, Geraldine Thiere and Karin Olsson for valuable comments on the manuscript.
References
Amsinck SL, Strzelczak A, Bjerring R, Landkildehus F, Lauridsen TL, Christoffersen K, Jeppesen E (2006) Lake depth rather than fish planktivory determines cladoceran
community structure in Faroese lakes—evidence from
contemporary data and sediments. Freshw Biol 51:2124–
2142
Amundsen P-A, Knudsen R, Andersen K (2007) Intraspecific competition and density dependence of food consumption and growth in Arctic charr. J Anim Ecol 76:149–158 Appelberg M, Berger H-M, Hesthagen T, Kleiven E, Kurkilahti
M, Raitaniemi J, Rask M (1995) Development and intercalibration of methods in Nordic freshwater fish
monitoring. Water, Air, & Soil Pollution 85:401–406
Bennington CC, Thayne WV (1994) Use and misuse of mixed-model analysis of variance in ecological studies. Ecology
75:717–722
Bolnick DI, Svanbäck R, Araújo MS, Persson L (2007) Comparative support for the niche variation hypothesis that generalized populations also are more heterogeneous.
Proc Natl Acad Sci USA 104:10075–10079
Chase JM, Leibold MA (2003) Ecological niches: linking classical and contemporary approaches. University of Chicago Press, Chicago, USA
Christoffersen K, Pålsson C, Kritzberg E, Granéli W (2002) Abundance and biomass of microbial communities in relation to phyto- and bacterioplankton production in five Faroese lakes. Ann Soc Sci Færoensis Suppl 36:59–69 Domenici P, Turesson H, Brodersen J, Brönmark C (2008)
Predator-induced morphology enhances escape
locomo-tion in crucian carp. P Roy Soc Lond Ser B 275:195–201
Forseth T, Ugedal O, Jonsson B, Fleming IA (2003) Selection on Arctic charr generated by competition from Brown trout. Oikos 101:467–478
Gasith A (1991) Can littoral resources influence ecosystem processes in large, deep lakes? Verh Int Ver Limnol
24:1073–1076
Hansson S (1995) Effects of exploitative food competition on
food niche dynamics—a simulation analysis. Ecol Modell
77:167–187
Hershey AE, Beaty S, Fortino K, Kelly S, Keyse M, Luecke C, O'Brien WJ, Whalen SC (2006) Stable Isotope Signatures of Benthic Invertebrates in Arctic Lakes Indicate Limited Coupling to Pelagic Production. Limnol Oceanogr
51:177–188
Horppila J, Ruuhijärvi J, Rask M, Karppinen C, Nyberg K, Olin M (2000) Seasonal changes in the diets and relative abundances of perch and roach in the littoral and pelagic
zones of a large lake. J Fish Biol 56:51–72
Hubbell SP (2001) The Unified Neutral Theory of Species Abundance and Diversity. Princeton University Press, Princeton, NJ
Hutchinson GE (1957) Concluding remarks. Cold Springs
Harbor Symp Quant Biol 22:415–427
Hutchinson GE (1959) Homage to Santa Rosalia or why are
there so many kinds of animals. Am Nat 93:145–159
Jansen PA, Slettvold H, Finstad AG, Langeland AL (2002) Niche segregation between Arctic char (Salvelinus alpi-nus) and Brown trout (Salmo trutta): an experimental
study of mechanisms. Can J Fish Aquat Sci 59:6–11
Jennions MD, Telford SR (2002) Life-history phenotypes in populations of Brachyrhaphis episcopi (Poeciliidae) with
different predator communities. Oecologia 132:44–50
Jensen JP, Landkildehus F, Søndergaard M, Jeppesen E, Christoffersen K (2002) Water chemistry of five lakes at
the Faroe Islands. Ann Soc Sci Færoensis Suppl 36:34–38
Jeppesen E, Jensen JP, Søndergaard M, Lauridsen TL, Pedersen LJ, Jensen L (1997) Top-down control in freshwater lakes: the role of nutrient state, submerged macrophytes and water depth. Hydrobiologia 342(343):151–164
Jeppesen E, Christoffersen K, Landkildehus F, Lauridsen T, Amsinck S (2001) Fish and crustaceans in northeast Green-land lakes with special emphasis on interactions between Arctic charr (Salvelinus alpinus), Lepidurus arcticus and
benthic chydorids. Hydrobiologia 442:329–337
Jeppesen E, Christoffersen K, Malmquist HJ, Faafeng B, Hansson L-A (2002a) Ecology of five Faroese lakes: summary and synthesis. Ann Soc Sci Færoensis Suppl
36:126–139
Jeppesen E, Landkildehus F, Lauridsen TL, Jensen JP, Bjerring R, Søndergaard M, Amsinck SL (2002b) Food web interactions in five Faroese lakes tracked by stable
isotopes. Ann Soc Sci Færoensis Suppl 36:114–125
Jeppesen E, Jensen JP, Jensen C, Faafeng B, Hessen DO, Søndergaard M, Lauridsen T, Brettum P, Christoffersen K (2003) The impact of nutrient state and lake depth on top-down control in the pelagic zone of lakes: a study of 466 lakes from the temperate zone to the arctic. Ecosystems: 313–325
Jonsson B, Jonsson N, Hindar K, Northcote TG, Engen S (2008) Asymmetric competition drives lake use of
Kahilainen K, Lehtonen H (2002) Brown trout (Salmo trutta L.) and Arctic charr (Salvelinus alpinus (L.)) as predators on three sympatric whitefish (Coregonus lavaretus (L.)) forms in the subarctic Lake Muddusjarvi. Ecol Freshwat
Fish 11:158–167
Kelly CD, Godin JGJ, Abdallah G (2000) Geographical variation in the male intromittent organ of the Trinidadian
guppy (Poecilia reticulata). Can J Zool 78:1674–1680
Klemetsen A, Amundsen P-A, Grotnes PE, Knudsen R, Kristoffersen R, Svenning M-A (2002) Takvatn through 20 years: long-term effects of an experimental mass removal of Arctic charr, Salvelinus alpinus, from a
subarctic lake. Environ Biol Fish 64:39–47
Klemetsen A, Amundsen P-A, Dempson JB, Jonsson B,
Jonsson N, O’Connel MF, Mortensen E (2003) Atlantic
salmon Salmo salar L., Brown trout Salmo trutta L. and Arctic charr Salvelinus alpinus (L.): a review of aspects of
their life histories. Ecol Freshwat Fish 12:1–59
L’Abée-Lund JH, Langeland A, Sægrov H (1992) (1992) Piscivory by Brown trout Salmo trutta L. and Arctic charr Salvelinus alpinus (L.) in Norwegian lakes. J Fish Biol 41:91–101
L’Abée-Lund JH, Aass P, Sægrov H (2002) Long-term variation
in piscivory in a Brown trout population: effect of changes
in available prey organisms. Ecol Freshwat Fish 11:260–
269
Landkildehus F, Jeppesen E, Jensen JP, Dali S (2002) Lake
descriptions. Ann Soc Sci Færoensis Suppl. 36 28–33.
Langeland A, L’Abée-Lund JH, Jonsson B, Jonsson N (1991)
Resource partitioning and niche shift in Arctic charr, Salvelinus alpinus and Brown trout, Salmo trutta. J Anim
Ecol 60:895–912
Langerhans RB, Layman CA, Shokrollahi M, DeWitt T (2004) Predator-driven phenotypic diversification in Gambusia
affinis. Evolution 58:2305–2318
Leips J, Travis J (1999) The comparative expression of life history traits and its relationship to the numerical dynamics of four populations of the least killifish. J Anim Ecol 68:595–616
MacArthur RH, Levins R (1967) The limiting similarity, convergence and divergence of coexisting species. Am
Nat 101:377–385
Malmquist HJ (1992) Phenotype-specific feeding behaviour of two Arctic charr Salvelinus alpinus morphs. Oecologia
3:354–361
Malmquist HJ, Ingimarsson F, Jóhannsdóttir EE, Gíslason D, Snorrason SS (2002) Biology of Arctic charr (Salvelinus alpinus) and Brown trout (Salmo trutta) in four Faroese
lakes. Ann Soc Sci Færoensis Suppl 36:94–103
Mehner T, Holmgren K, Lauridsen TL, Jeppesen E, Diekmann M (2007) Lake depth and geographical position modify
lake fish assemblages of the European ‘Central Plain’
ecoregion. Freshwat Biol 52:2285–2297
Post DM (2002) Using stable isotopes to estimate trophic position: models, methods, and assumptions. Ecology
83:703–718
Post DM, Layman CA, Arrington DA, Takimoto G, Quattrochi J, Montaña CG (2007) Getting to the fat of the matter: models, methods and assumptions for dealing with lipids
in stable isotope analyses. Oecologia 152:179–189
Reznick DN (1989) Life-history evolution in guppies: 2. Repeatability of field observations and the effects of
season on life histories. Evolution 43:1285–1297
Reznick DN, Endler JA (1982) The impact of predation on life history evolution in Trinidadian guppies (Poecilia
retic-ulata). Evolution 36:160–177
Riget F, Jeppesen E, Landkildehus F, Lauridsen TL, Geertz-Hansen P, Christoffersen K, Sparholt H (2000) Landlocked Arctic charr (Salvelinus alpinus) population structure and
lake morphometry in Greenland– is there a connection?
Polar Biol 23:550–558
Saksgård R, Hesthagen T (2004) A 14-year study of habitat use and diet of Brown trout (Salmo trutta) and Arctic charr (Salvelinus alpinus) in Lake Atnsjoen, a subalpine
Norwegian lake. Hydrobiologia 521:187–199
Schluter D, McPhail JD (1992) Ecological character
displace-ment and speciation in stickleback. Am Nat 140:85–108
Schoener TW (1982) The controversy over interspecific
competition. Am Sci 70:586–595
Søndergaard M, Jeppesen E, Jensen JP (2005) Pond or lake: does it
make any difference? Arch Hydrobiol 162:143–165
Svanbäck R, Persson L (2009) Population density fluctuations change the selection gradient in Eurasian perch. Am Nat
173:507–516
Tilman D (1987) The importance of the mechanisms of
interspecific competition. Am Nat 129:769–774
Vadeboncoeur Y, Vander Zanden MJ, Lodge DM (2002) Putting the lake back together: Reintegrating benthic pathways into lake food web models. Bioscience 52:44–54 Vadeboncoeur Y, Jeppesen E, Vander Zanden MJ, Schierup
H-H, Christoffersen K, Lodge DM (2003) From Greenland to green lakes: Cultural eutrophication and the loss of benthic
pathways in lakes. Limnol Oceanogr 48:1408–1418
Vadeboncoeur Y, Peterson G, Vander Zanden MJ, Kalff J (2008) Benthic algal production across lake size gradients: interactions among morphometry, nutrients, and light.
Ecology 89:2542–2552
Werner EE (1977) Species packing and niche complementarity
in three sunfishes. Am Nat 111:553–578
Werner EE, Gilliam JF (1984) The ontogenetic niche and species interactions in size-structured populations. Annu