Submitted to the 1
stInternational Conference on Energy, Environment And Climate Changes
Social and environmental impacts of climate change:
In the absence of mitigation, will we be able to adapt?
Keynote presentation opening the Climate Change session
Pierre OZER
Department of Environmental Sciences and Management, University of Liège Avenue de Longwy 185, B-6700 Arlon, Belgium
e-mail: pozer@ulg.ac.be
Abstract— Warming of the climate system is unequivocal, as it is now evident from observations of increases in global average air and ocean temperatures, widespread melting of snow and ice and rising global average sea level. Observational evidence from all continents and most oceans shows that many natural systems are being affected by regional climate changes, particularly temperature increases. Other effects of regional climate changes on natural and human environments are emerging, although many are difficult to discern due to adaptation and non-climatic drivers. Most of the observed increase in global average temperatures since the mid-20th century is very likely due to the observed increase in anthropogenic greenhouse gases concentrations. In this framework, sea level rise is virtually certain and increasing frequency of heat waves and heavy precipitation events is very likely during the 21st century. This will impact ecosystems, food security, coastal areas, human health, water availability, and economies.
Since current (2000-2010) CO2 emissions are near the worst Intergovernmental Panel on Climate Change (IPCC) scenario (A1F1) projecting a global average surface warming of 2.4 to 6.4°C and a sea level rise of 26 to 59 cm (excluding any future rapid dynamical change in ice flow) at 2090-2099 relative to 1990-1999. And since it is very likely that the international response will be very weak in the near future (as it has been in the past), giving no chance to a second phase to the Kyoto Protocol that expires in 2012. We thus have to accept that climate change mitigation is behind us and that only adaptation to global warming is the response to reduce vulnerability of natural and human systems to climate change effects. However, we know that in the absence of climate change effects, the vulnerability of natural and human systems is extremely high, especially due to the mismanagement of natural resources, the lack of land use planning and the nonexistence of policies focused on natural hazard management.
Keywords: Climate change, extreme events, mitigation, adaptation, developing countries
I. INTRODUCTION
We live in a constantly changing world characterized by an improved knowledge of past, current and future trends of
several indicators. We now have a better understanding of how these global numbers will interact and what will be their impacts on environment, economy, trade, international stability, food security, etc.
In recent years, the world population has dramatically increased, rising from 3.7 billion in 1971 to 7.0 billion currently (2011) and is projected to reach 9.1 billion by 2050. Forty years ago, 64% of the population was living in rural areas. This proportion fell to 50% today and will decline to 30% by 2050 [1]. So the structure of the population changes, not only in absolute number but also in its way of life. In the same time, energy needs intensify in a globalising world. Yet, from 5,500 million tonnes of oil equivalent (Mtoe) in 1971, the world primary energy demand increased up to 12,300 Mtoe in 2008, which represents a 26% increase in energy demand per capita in near four decades. With a major problem: fossil fuels (oil, coal and gas) are the dominant energy sources (82%) and their proportion in the global energy offer should remain unchanged by 2035 [2-4]. Although this allows an unprecedented human development in history, the question is to know if this development is sustainable with regards to the erosion of biodiversity, forests resources decline, advancing desertification or climate change.
The past decade has seen an impressive rise in public awareness of the importance of climate change [5-7] which has become a major issue in corporate, national and global policies. Year after year, large scientific conferences and political negotiations take place all over the world. If the recent scientific understanding of climate change has improved remarkably [8], a spectacular shift in the political process is still awaited [9-10] and before the next Conference of the Parties (COP 17) of the United Nations Framework Convention on Climate Change (UNFCCC) in Durban, South Africa, by the end of 2011, there is no sign from any major greenhouse gas (GHG) emitters of a concrete proposal to establish a legally binding international agreement in significant GHG reductions for the post-Kyoto Protocol period (2008-2012).
This paper briefly reviews the current state of knowledge on climate change, presents why no global dramatic shift in the political process is reach, and demonstrates that –in the absence of climate change effects– the vulnerability of the natural and human systems is extremely high.
II. CAUSES OF CLIMATE CHANGE
The radiative forcing of the climate system is dominated by the long-lived GHGs, and this section considers those whose emissions are covered by the UNFCCC.
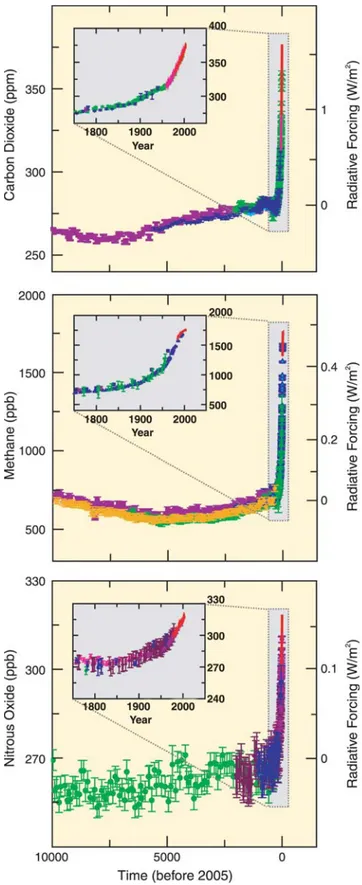
Global GHG emissions due to human activities have grown since pre-industrial times. Global atmospheric concentrations of CO2, CH4 and N2O (the three major GHGs) have increased markedly as a result of human activities since 1750 and now far exceed pre-industrial values determined from ice cores spanning many thousands of years (Fig. 1). The atmospheric concentrations of CO2 (390 ppm in 2010) [11-12] exceed by far the natural range over the last 800,000 years [10,13]. Global increases in CO2 concentrations are due primarily to fossil fuel (coal, oil and gas) use, with land-use change (deforestation, decay of biomass, etc) providing another significant but smaller contribution. CO2 represents 76.7% of the anthropogenic GHG, out of which 59.4% are due to fossil fuel combustion and 17.3% due to land-use change. The analysis of the recent anthropogenic global carbon dioxide budget is extremely interesting.
Recent increase in atmospheric CO2 is driven by fossil fuel burning since 7.7 GtC/y were emitted during the 2000-2009 period compared to the 6.4 GtC/y recorded during the 1990s. This increase is extremely important in just a decade. In 2009, 8.4 GtC/y were released into the atmosphere despite the global financial and economic crisis that started in 2008. In addition, land-use change contributed to 1.1 GtC/y in the 2000s. These 8.8 GtC/y released are largely sufficient to exceed the balancing effect of natural sinks: land (2.4 GtC/y) and oceans (2.3 GtC/y). As a result, 47% of the CO2 released remains into the atmosphere [11,14].
It is very likely1 that the observed increase in CH4 concentration (14.3% of the GHG) is predominantly due to agriculture, fossil fuel use and animal husbandry. The increase in N2O concentration (7.9% of the GHG) is primarily due to agriculture (soil and animal manure management) although important contributions also come from sewage treatment, combustion of fossil fuel, and chemical industrial processes. In addition to that, halocarbons (1.1% of the GHG) have increased from a near-zero pre-industrial background concentration, primarily due to human activities.
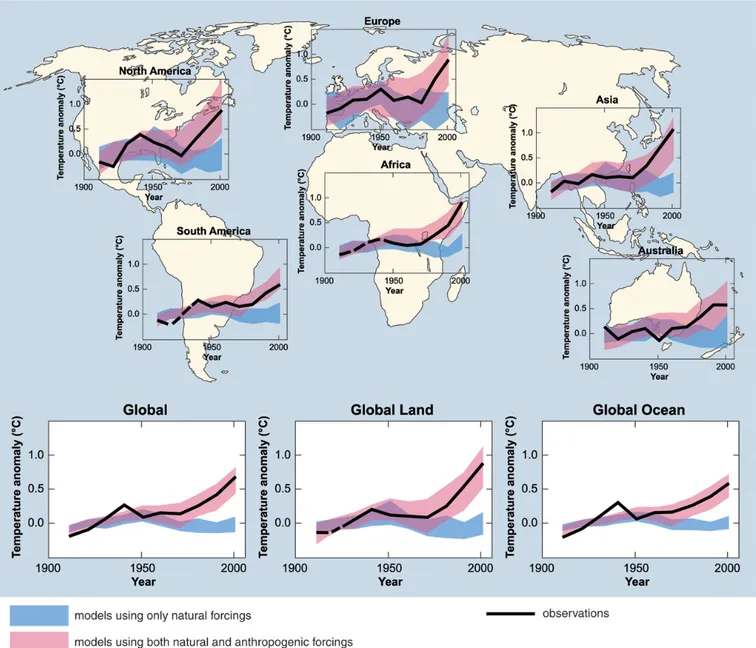
There is very high confidence that the global average net effect of human activities since 1750 has been a warming. Most of the observed increase in global average temperatures since the mid-20th century is very likely due to the observed increase in anthropogenic GHG concentrations. The observed widespread warming of the atmosphere and ocean, together with ice mass loss, support the conclusion that it is extremely unlikely that global climate change of the past 50 years can be explained without external forcing and very likely that it is not due to known natural causes alone. During this period, the sum of solar and volcanic forcings would likely have produced cooling, not warming (Fig. 2).
1 Uncertainty is expressed by a probability of occurrence: virtually certain >99%;
extremely likely >95%; very likely >90%; likely >66%; more likely than not > 50%; about as likely as not 33% to 66%; unlikely <33%; very unlikely <10%; extremely unlikely <5%; exceptionally unlikely <1% [8].
Figure 1. Atmospheric concentrations of CO2, CH4 and N2O over the last
10,000 years (large panels) and since 1750 (inset panels). Measurements are shown from ice cores (symbols with different colours for different studies) and atmospheric samples (red lines). The corresponding radiative
forcings relative to 1750 are shown on the right hand axes of the large panels. [8]
Figure 2. Comparison of observed continental- and global-scale changes in surface temperature with results simulated by climate models using either natural or both natural and anthropogenic forcings. Decadal averages of observations are shown for the period 1906-2005 (black line) plotted against the centre of the decade and relative to the corresponding average for the 1901-1950. Lines are dashed where spatial coverage is less than 50%. Blue shaded bands show the 5 to 95% range for 19 simulations from five climate models using only the natural forcings due to solar activity and volcanoes. Red shaded
bands show the 5 to 95% range for 58 simulations from 14 climate models using both natural and anthropogenic forcings. [8]
III. OBSERVED CHANGES IN CLIMATE
Warming of the climate system is unequivocal, as is now evident from observations of increases in global average air and ocean temperatures, widespread melting of snow and ice and rising global average sea level.
Fig. 3 shows the time series of the combined global land and marine surface temperature record from 1850 to 2010. According to the method of calculation used by the Climate Research Unit of the University of East Anglia [15], the year 2010 was the equal third warmest on record (with 2003), exceeded by 1998 and 2005. The years 2003, 2005 and 2010 are only distinguishable in the third decimal place. The
period 2001-2010 (0.44°C above 1961-90 mean) was 0.20°C warmer than the 1991-2000 decade (0.24°C above 1961-90 mean). The warmest year of the entire series has been 1998, with a temperature of 0.55°C above the 1961-90 mean. After 1998, the next nine warmest years in the series are all in the decade 2001-2010. During this decade, only 2008 is not in the ten warmest years. Even though 2008 was the coldest year of the 21st century it was still the 12th warmest year of the whole record.
Increases in sea level are consistent with warming. Global average sea level rose at an average rate of 1.3 mm/y since 1870, then of 1.8 mm/y over 1961 to 2003 and of about 3.4 mm/y from 1993 to 2008 [8,16]. Since 1993, approximately 30% of the rate of sea level rise is due to
ocean thermal expansion in response to ocean warming. Mass loss in mountain glaciers and ice sheets accounts for approximately another 55% [16].
Figure 3. Global air temperature from 1850 to 2010 [15]. Observed decreases in snow and ice extent are also consistent with warming. Satellite data since 1978 show that annual average Arctic sea ice extent has shrunk by 2.7% per decade, with larger decreases in summer of 7.4% per decade. Mountain glaciers and snow cover on average have declined in both hemispheres. The maximum areal extent of seasonally frozen ground has decreased by about 7% in the Northern Hemisphere since 1900, with decreases in spring of up to 15% [8].
At continental, regional and ocean basin scales, numerous long term changes in other aspects of climate have also been observed. Trends from 1900 to 2005 have been observed in precipitation amount in many large regions. Over this period, precipitation increased significantly in eastern parts of North and South America, northern Europe and northern and central Asia whereas precipitation declined in the Sahel, the Mediterranean, southern Africa and parts of southern Asia. Globally, the area affected by drought has likely increased since the 1970s [8].
Some extreme weather events have changed in frequency and/or intensity over the last 50 years. Yet, it is very likely that cold days, cold nights and frosts have become less frequent over most land areas, while hot days and hot nights have become more frequent. It is also likely that heat waves have become more frequent over most land areas, that the frequency of heavy precipitation events (or proportion of total rainfall from heavy falls) has increased over most areas, and that the incidence of extreme high sea level has increased at a broad range of sites worldwide since 1975 [8].
IV. FUTURE IMPACTS OF CLIMATE CHANGE
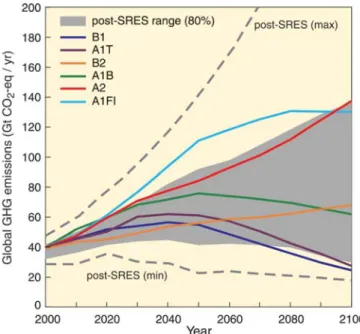
Since we know that climate change is linked to GHG emissions, six scenarios to predict future GHG emissions [8] have been created by the Intergovernmental Panel on Climate Change (IPCC) based on population and economic growth, types of technologies, energy demand, etc. (Fig. 4):
• The B1 scenario believes that the world will be more integrated and more ecologically friendly. It is characterized by: a rapid economic growth but with rapid changes towards a service and information economy; a population rising to 9 billion in 2050 and then declining; reductions in material intensity and
the introduction of clean and resource efficient technologies; and an emphasis on global solutions to economic, social and environmental stability. With this scenario which is the most optimistic about the future behaviour of our societies, best global temperature change estimate between 1980-1999 and 2090-2099 is +1.8°C, with a likely range of +1.1°C to 2.9°C.
• The B2 scenario expects a world more divided but more ecologically friendly. It is characterized by a continuously increasing population (but at a slower rate than in A2); an emphasis on local rather than global solutions to economic, environmental and social stability; intermediate levels of economic development; and a less rapid and more fragmented technological change than in A1 and B1. This scenario would lead to a temperature change of +2.4 [1.4 to 3.8]°C between 1980-1999 and 2090-2099. • The A1 scenarios bet on a more integrated world and
is characterized by: a rapid economic growth; a global population that reaches 9 billion in 2050 and then gradually declines; the quick spread of new and efficient technologies; a convergent world income and way of life converge between regions; and extensive social and cultural interactions worldwide. Three sub scenarios can be distinguished based on their technological emphasis: A1T with a prominence of non-fossil energy sources; A1B with a balanced weight of all energy sources; and A1FI that would be fossil intensive (the worst case scenario). With these scenarios, best global temperature change estimate between 1980-1999 and 2090-2099 are +2.4 [1.4 to 3.8]°C, +2.8 [1.7 to 4.4]°C, and +4.0 [2.4 to 6.4]°C, respectively.
Figure 4. Global GHG emissions (in GtCO2-eq per year) in the absence of
additional climate policies: six illustrative scenarios (coloured lines). The emissions include CO2, CH4, N2O and F-gases. See [8] for additional
• The A2 scenario imagines a more divided world. It is characterized by: a world of independently operating, self-reliant nations, a regionally oriented economic development, a continuously increasing population, a slower and more fragmented technological changes and improvements to per capita income. With this scenario, best global temperature change estimate between 1980-1999 and 2090-2099 is +3.4 [2.0 to 5.4]°C.
For the next two decades a warming of about 0.2°C per decade is projected for a range of IPCC emissions scenarios. Even if the concentrations of all GHGs and aerosols had been kept constant at year 2000 levels, a further warming of about 0.1°C per decade would be expected. Afterwards, temperature projections increasingly depend on specific emissions scenarios. Continued GHG emissions at or above current rates would cause further warming and induce many changes in the global climate system during the 21st century that would very likely be larger than those observed during the 20th century.
The latest IPCC report predicts, by the mid- to late 21st century, a virtually certain sea-level rise, decrease of cold nights and increase in hot days and nights; a very likely increase in warm spells, heat waves and heavy precipitation;
and a likely increase in intense tropical cyclone activity and in areas affected by droughts. Without taking into account any changes or developments in adaptive capacity, the major projected impacts of these changes are [8]:
• Agriculture, forestry and ecosystems: damage to crops; soil erosion, inability to cultivate land due to waterlogging of soils; etc.
• Water resources: adverse effects on quality of surface and groundwater; contamination of water supply; and water stress;
• Human health: increased risk of malnutrition, deaths, injuries and infectious, respiratory and skin diseases; and migration-related health effects;
• Industry, settlement and society: disruption of settlements, commerce, transport and societies due to flooding: pressures on urban and rural infrastructures; loss of property; and population migration [8].
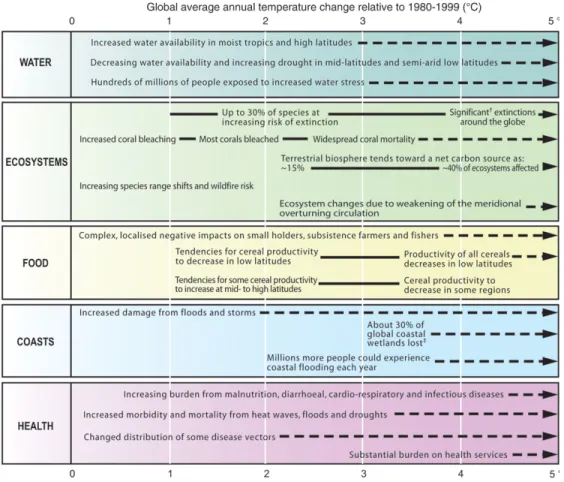
As shown on Fig. 5, the impacts of the future climate change will broadly depend on its magnitude. Globally, it is clear that fast changes on systems and sectors will make adaptation policies more difficult to successfully apply.
Figure 5. Examples of impacts associated with global average temperature change. Illustrative examples of global impacts projected for climate and sea level changes associated with different amounts of increase in global average surface temperature in the 21st century. The black lines link impacts; broken-line arrows indicate impacts continuing with increasing temperature. Entries are placed so that the left-hand side of text indicates the approximate level of warming that is associated with the onset of a given impact. Adaptation to climate change is not included in these estimations. Confidence levels for all
But many uncertainties remain about the impact of the future climate. For example, the latest IPCC report projected a global sea level rise of 18 to 59 cm from 1990 to the 2090s, plus an unspecified amount that could come from changes in the large ice sheets covering Greenland and Antarctica [8]. But since 1993, sea level has risen about 80 per cent faster, at 3.4 mm/y, than the average IPCC model projection of 1.9 mm/y [16]. IPCC’s projections seem therefore obsolete. Yet, as presented in Fig. 6, a number of recent studies taking the semi-empirical approach have predicted much higher sea level rise for the 21st century than the IPCC, exceeding one meter if greenhouse gas emissions continue to escalate [17-18].
Figure 6. Estimates for 21st century sea level rise from semi-empirical models as compared to the IPCC Fourth Assessment Report [8]. For exact
definitions of the time periods and emissions scenarios considered, see [17].
Such uncertainty on future sea level rise is extremely important since its immediate effect is submergence and increased flooding of coastal land, as well as saltwater intrusion of surface waters. Longer-term effects also occur as the coast adjusts to the new conditions, including increased erosion and saltwater intrusion into groundwater. Coastal wetlands such as saltmarshes and mangroves will also decline unless they have a sufficient sediment supply to keep pace with sea level rise, which is rarely the case. These physical impacts in turn have both direct and indirect socioeconomic impacts, which appear to be devastatingly negative. These impacts will even be worst in areas already affected by subsidence such as the Ganges-Brahmaputra, Mekong, and Changjiang deltas [18].
Flooding of coastal land and increasing shoreline erosion will very likely cause massive population displacements, as frequently forecasted as one of the most dramatic possible consequences of climate change. Yet, numerous deltas and shorelines have been studied in order to assess impact of sea level rise on agriculture, economy and people potentially affected. Fig. 7 shows the results simulated for the Nile delta which supported a population of 40.2 million in 2000. It appears that a 50 cm sea level rise would affect (and very likely displace) 4 million people and would submerge a land area of 1,800 km2 out of which many are agricultural lands [20]. A one meter or greater sea level rise would cause
obviously much larger impacts. Yet, the affected population and land would be 6.1, 8.0 and 10.7 million people for a 1, 1.5 and 2 meters of sea level rise, respectively. Food security will also be impacted since thousands of km2 of agricultural lands will be submerged [19-20].
Figure 7. Impact of sea level rise on the Nile delta [19].
Migrations as an adaptation strategy of the poor will not be restricted to sea level rise impacts but will also be driven by several climate modifications and related environmental degradation such drought, floods, extreme climate events, desertification, etc. In 2008, 20 million persons have been
displaced by extreme weather events and this figure is very likely to increase in the next decades. Most widely cited estimates of the so-called climate refugees vary from 200 million to 1 billion people displaced by 2050 because of climate change impacts [21-23]. Three major factors will drive these forced migrations in the future: [i] the increase of climate deregulation affecting [ii] unprepared poor areas with no adaptation strategy to change [iii] in regions characterised by an important demographic growth.
V. WHO IS RESPONSIBLE FOR CLIMATE CHANGE
CO2 emissions from the burning of fossil fuels are the primary cause of global warming. Special attention has been focused on the CO2 directly emitted by each country. Top 10 emitters in 2008 are presented in Table I with comparison values for 1971 and 1990. It shows that 29 gigatonnes of CO2 from fuel combustion were globally emitted in 2008.
Between 1971 and 2008, global emissions doubled, with industrialized countries dominating historical totals. However, the share of developed countries (here represented as the member countries of the Organisation for Economic Co-operation and Development or OECD) progressively shrank as developing countries, led by emerging economies such as China and India (with respectively +714% and +614%), increased at a much faster rate (+260% for non-OECD countries). Yet, non-OECD countries show a 37% increase during the 1971-2008 period while representing 69% of global CO2 emissions in 1971, 54% in 1990, and ‘only’ 47% in 2008. Although such CO2 emissions increase in non-OECD countries may seem impressive, it is worth mentioning that OECD’s member countries have been responsible for more than half of these emissions until 2004 while their population is less than 18% of the total (Table II).
TABLE I. ESTIMATION OF CO2 EMISSIONS FROM FUEL COMBUSTION (IN 106 TONS) AND THEIR EVOLUTION AT THE GLOBAL AND REGIONAL LEVELS, AND TOP 10 EMITTING COUNTRIES IN 2008(ACCOUNTING FOR 67% OF THE WORLD’S CO2 EMISSIONS).(INCLUDING INTERNATIONAL MARINE AND AVIATION
BUNKERS)[24]. Region/Country CO2 emissions (1971) CO2 emissions (1990) CO2 emissions (2008) Evolution (1971-1990) Evolution (1990-2008) Evolution (1971-2008) World 14,096 20,965 29,381 +49 % +40 % +108 % OECD 9,602 11,414 13,189 +19 % +16 % +37 % Non-OECD 4,494 9,550 16,193 +113 % +70 % +260 % 1. China 813 2,259 6,619 +178 % +193 % +714 % 2. United States 4,329 4,999 5,739 +15 % +15 % +33 % 3. Russian Federation 1,264 2,211 1,611 +75 % -27 % +27 % 4. India 202 596 1,442 +195 % +142 % +614 % 5. Japan 813 1,095 1,186 +35 % +8 % +46 % 6. Germany 1,000 971 835 -3 % -14 % -17 % 7. Canada 343 438 555 +28 % +27 % +62 % 8. United Kingdom 644 576 554 -11 % -4 % -14 % 9. Korea 54 235 541 +335 % +130 % +902 % 10. Iran 52 183 511 +252 % +179 % +883 %
TABLE II. OECD AND NON-OECD POPULATIONS (IN MILLION); PART OF THE WORLD CO2 EMISSIONS FROM FUEL COMBUSTION (IN %);CO2 EMISSIONS PER CAPITA (IN TONS) IN 1990 AND 2008 AND RECENT TRENDS (IN %).(INCLUDING INTERNATIONAL MARINE AND AVIATION BUNKERS)[24].
Region Population (2008) % world population (2008) % world CO2 emissions (2008) CO2 emissions per capita (1990) CO2 emissions per capita (2008) CO2 emissions per capita - Evolution 1990-2008 World 6,688 100.0 100.0 4.0 4.4 +10.3 % OECD 1,190 17.8 44.9 10.9 11.1 +1.3 % North America 444 6.6 22.9 15.9 15.1 -4.9 % Pacific 202 3.0 7.4 8.7 10.8 +24.0 % Europe 543 8.1 14.6 8.2 7.9 -3.7 % Non-OECD 5,498 82.2 55.1 2.3 2.9 +30.2 % Europe 53 0.8 1.0 6.6 5.3 -19.5 % North Africa 163 2.4 1.3 1.7 2.3 +39.2 % Sub-Saharan Africa 821 12.3 1.9 0.7 0.7 -8.3 % Middle East 199 3.0 5.4 4.9 8.0 +62.6 %
Former Soviet Union 285 4.3 8.3 12.8 8.6 -32.9 %
Latin America 462 6.9 3.8 1.8 2.4 +36.9 %
Asia - China 2,183 32.6 10.9 0.8 1.5 +75.2 %
In 1971, China was the equal fourth CO2 emitter country (with Japan), largely exceeded by the United States, the Russian Federation and Germany (Table I). At that time, the United States (208 million inhabitants) were emitting as much CO2 than non-OECD countries (2,877 million inhabitants). Recently, things have changed. China took the lead in 2007 and India (#11 in 1971) has become the third top emitter in 2010, exceeding the Russian Federation.
This figure, presenting China and India ranking in the top 3 emitting countries, does not correctly highlight the still existing gap between per capita CO2 emissions between developed and developing countries (Table II). This makes many observers from emerging economies quite uncomfortable since many western medias say that China and India have to “do something” to reduce global CO2 emissions [10,25]. As an example, The Independent, a serious British newspaper, published on the front page “The UK causes two per cent of global carbon emissions. What should we do about the remaining 98 per cent?”. [26]
Yet, detailing ‘per capita’ CO2 emissions would then clearly show that these figures are four times higher in developed countries (11.1 tons CO2/y) than in developing countries (2.9 tons CO2) with an average of 4.4 tons CO2 in 2008. The United States alone generate close to 20% of the global CO2 emissions, despite a population of less than 5% of the world total. In the mean time, China, contributing to a comparable share of global emissions (23%), accounts for 20% of the world population. India, with 17% of the world population contributes to less than 5% of the CO2 emissions. Therefore, the levels of per capita CO2 emissions are very diverse. As an example, one American citizen is annually responsible of 18.8 tons of CO2 emissions, that is the equivalent of near four Chinese, fifteen Indians, or 73 sub-Saharan Africans issued from least developed countries.
In addition, such data sets on the carbon footprint of nations (Tables I and II) only take into account production-based inventories. Very few studies include the emissions associated with consumption of goods and services in each country. Consumption-based accounting of CO2 emissions differ from currently traditional estimates.
In China alone, 30% of the growth in CO2 emissions between 1990 and 2002 was attributable to the production of exports from China that were consumed in other countries, and the share of the growth increased to 50% between 2002 and 2005. In 1990, 16% of Chinese CO2 emissions were from the production of exports, increasing to 30% in 2005. The major part of the exported products was destined for developed countries [27].
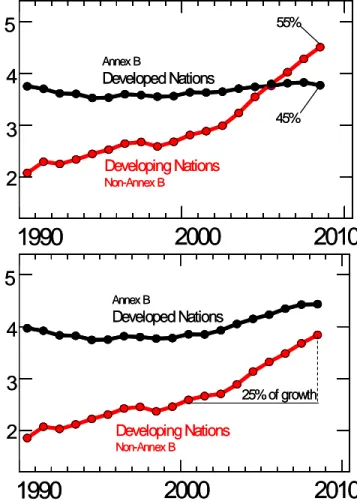
In 2004, 23% of global CO2 emissions were traded internationally, primarily as exports from China and other emerging markets to consumers in developed countries. These studies generally find that rich countries have a larger carbon footprint than their territorial emissions, while the opposite holds for poor countries [28] so that, when considering consumption-based CO2, developed countries are still the major CO2 emitters despite their small population (Fig. 8). Yet, in some wealthy countries, including Austria, Belgium, France, Sweden, Switzerland and the United Kingdom, over 30% of consumption-based emissions were
imported, with net imports to many Europeans of >4 tons CO2 per capita in 2004. Net import of emissions to the United States in the same year was somewhat less: 10.8% of total consumption-based emissions and 2.4 tons CO2 per person. In contrast, 30% of the CO2 emissions produced in China in 2005 were exported to consumers elsewhere [28].
As an example, one Belgian emitted 13.8 tons CO2 per capita in 2008 taking into account production-based inventories (including marine and aviation bunkers) [24]. Using identical inventories, one Chinese emitted 5.0 tons CO2 per capita during the same year [24]. Therefore, one may say that one Belgian’s CO2 emissions are equivalent to those of 2.8 Chinese. But when considering import and export of emissions, it appears that one Chinese exports 1.5 tons CO2 while one Belgian imports goods (mainly “Made in China” [29]) that are equivalent to 5.0 tons CO2 (net flux2) [28]. At the end, one Belgian consumed 18.8 tons CO2 while one Chinese produced 3.5 tons CO2. As a result, CO2 emissions of one Belgian are equivalent to those of 5.4 Chinese. Annex B Developed Nations Developing Nations Non-Annex B
1990
2000
2010
5
4
3
2
55% 45% Annex B Developed Nations Developing Nations Non-Annex B1990
2000
2010
5
4
3
2
55% 45%1990
2000
2010
5
25% of growth Annex B Developed Nations Developing Nations Non-Annex B4
3
2
1990
2000
2010
5
25% of growth Annex B Developed Nations Developing Nations Non-Annex B4
3
2
Figure 8. Fossil fuel CO2 emissions (GtC per year) since 1990 from
AnnexB countries (mostly advanced economies) and non-AnnexB
countries (mostly developing countries) taking into account
production-based (top) and consumption-production-based (down) inventories [30].
2
The early 2000’s have known an unexpected rapid economic growth in a globalizing world. Although a relatively quick spread of efficient technologies is on the way in developed countries, more and more goods are produced “low cost” in emerging economies countries in order to feed developed countries. Since fossil fuel CO2 emissions coming from emerging economies have a high carbon intensity and an increasing reliance on coal, global CO2 emissions from the burning of fossil fuels have increased at an unpredicted rate [11]. Indeed, Fig. 9 shows that fossil fuel CO2 emissions during the past decade have been more important than any scenario elaborated from 2000 onwards. Recent emissions are higher than the worst case scenario (A1FI) which is fossil intensive and which would lead to a best global temperature change estimate between 1980-1999 and 2090-2099 of +4.0 [2.4 to 6.4]°C.
Figure 9. Fossil fuel CO2 emissions (GtC per year) since 1990 compared
with the six IPCC scenarios [30].
VI. WHAT DO WE DO TO FIGHT AGAINST CLIMATE CHANGE?
Responding to climate change involves a global risk management process that includes both mitigation (GHG emissions reduction can reduce the exposure to climate change) and adaptation capacity that can reduce sensitivity to climate change. In recent years, the understanding about the relationship between impacts and vulnerability has improved.
Vulnerability and damage implied will depend on exposure (the rate and magnitude of climate change, Fig. 5), sensitivity, which is determined in part and where relevant by development status, and adaptive capacity.
It is now clearly understood that neither adaptation nor mitigation alone can avoid climate change impacts. Adaptation is necessary both in the short term and longer term to address impacts resulting from the warming that would occur even for the lowest stabilisation scenarios assessed, especially when recent trends show that we currently are above the worst case scenario in terms of emissions (Fig. 9). Adaptation and mitigation can complement each other and together can significantly reduce the risks of climate change.
In order to stabilise the concentration of GHGs in the atmosphere, emissions would need to peak and decline thereafter. The lower the stabilisation level, the more quickly this peak and decline would need to occur. Mitigation efforts over the next two to three decades will have a large impact on opportunities to achieve lower stabilisation levels.
In the best case scenario for global mitigation strategy, atmospheric CO2 concentration (390 ppm in 2010) should be stabilised in between 350 and 400 ppm [8,12]. The peaking year for global CO2 emissions should be between 2000 and 2015, together with a reduction in global CO2 emissions ranging from -50% to -85% in 2050 compared to 2000. This would prevent most areas from dramatic adverse effects of climate change. Although recent trends in global CO2 emissions show that this scenario is now almost impossible to meet, developing countries claim it and it became a key issue in climate negotiations.
A. Mitigation: The current and post-Kyoto Protocol The ultimate objective of the UNFCCC is to achieve stabilization of greenhouse gas concentrations in the atmosphere at a level that would prevent dangerous anthropogenic interference with the climate system. Such a level should be achieved within a time-frame sufficient to allow ecosystems to adapt naturally to climate change, to ensure that food production is not threatened and to enable economic development to proceed in a sustainable manner.
Although the UNFCCC does not set mandatory limits on GHG emissions for individual countries and contains no enforcement mechanisms, it provided the Kyoto Protocol that sets mandatory emission limits. It was initially adopted on 11 December 1997, signed by 192 countries, and entered into force on 16 February 2005. All developed countries (Annex I Parties) signed the Kyoto Protocol with the objective to reduce their GHG by -5.2% between 1990 and 2008-2012 but the United States did not ratify it while their reduction target was initially -7.0%.
Over the period 1990-2008, total aggregate GHG emissions excluding emissions/removals from land use, land-use change and forestry (LULUCF) for all Annex I Parties decreased by 6.1%, and total GHG emissions/removals including LULUCF decreased by 10.4%. For Annex I Parties with economies in transition (Annex I EIT Parties), GHG emissions excluding and including LULUCF decreased by 36.8% and 48.5%, respectively. For Annex I non-EIT Parties, GHG emissions excluding LULUCF increased by 7.9% cent and GHG emissions including LULUCF increased by 8.3% [31]. Note that GHG emissions for international aviation and for international marine transportation increased by 74.8% and by 19.5% over the period 1990-2008, and are not taken into account by the Kyoto Protocol.
So that, if the Kyoto Protocol GHG emissions reduction target will certainly be met by Annex I Parties during the 2008-2012 period, it will be due to the large decrease observed in economies in transition, to the global financial and economic crisis that started in 2008, and to the unanticipated augmentation of energy, especially oil.
If the European Union (EU) already met its Kyoto Protocol GHG emissions reduction commitment and that
Japan will probably meet it, other developed countries will definitely not. Yet, between 1990 and 2008, the United States increased their GHG emissions by 15.3% (including LULUCF) while their target (that was not ratified) by 2008-2012 is -7.0%. Canada, Australia and New-Zealand present even more important increases, by over 30%, very far from their Kyoto Protocol commitments (Table III).
As an example, with a GHG emissions (including LULUCF) increase of 62.4% between 1990 and 2008, New Zealand will not respect its obligation under the Kyoto Protocol to maintain its 2008-2012 emissions to 1990 levels. In addition to that, the country proposed a GHG reduction objective of -20% by 2020 (in the case of a global agreement) before the Copenhagen Conference, cutting by half its emissions in 12 years: an impossible target when considering previous and future energy scenarios, even without including consumption-based emissions. The position of Canada is not better. While its obligation under the Kyoto Protocol is to cut its GHG emissions by 6% to 1990 levels on average over the 2008-2012 commitment period, those have increased by 33.6%. Their proposed reduction objective is -20% compared to … 2006, that is a 24% increase between 1990 and 2020: a very unpleasant objective for an industrialized developed country with respect to developing countries expectancies!
In 2009, before the COP 15 of the UNFCCC which was held in Copenhagen, developed countries proposed their quantified emission limitation and reduction objectives (QELRO) for the post-Kyoto phase (1990-2020). These proposals were not those expected by developing countries. Yet, reduction objectives of developing countries were ranging from +24% for Canada to -30% for the EU (in the case of a global agreement), while the United States (second world’s major GHG emitter) proposed a reduction objective of -3% (Table III).
Lately, the second 2011 meeting of the Parties held to the forthcoming COP 17 of the UNFCCC in Durban, which was held in Bonn (6-19 June) ended without major decisions on the shape of a follow-up to the post-Kyoto commitments. The debate regarding the possibility of a second commitment period of the Kyoto Protocol was inconclusive since the positions of the different negotiating groups were as distant as ever. With Russia, the United States, Canada and Japan all rejected an extension of the Protocol, as wished by developing countries. The heat was on the EU, whose commitment regarding climate change (-20% to -30% between 1990 and 2020) has turned it into a key player in the post-2012 debate. The pressure from developing countries to the EU to unilaterally sign a second commitment period to the Kyoto Protocol was met with resistance by the EU Climate Commissioner, who commented that, despite its efforts, the EU represents a minor share of global GHG emissions and that other major emitters should be pressured and involved in climate negotiations. In fact, at the end of the Bonn meeting, even the EU confirmed that such possibility is not feasible unless all major emitting countries commit to binding reduction targets.
In se, the EU is not wrong since its share of global production-based CO2 emissions from the burning of fossil fuels was ‘only’ 13.5% in 2008, exceeded by China (22.5%) and the United States (19.5%) [24], but such declarations are very symptomatic of the current state of the negotiations: “If you move, I will follow. If you do not…” In the same time, it is true that efforts made from 1990 to 2008 by the EU to meet its Kyoto Protocol CO2 emissions reduction commitment represented less than 3 months of Chinese CO2 increase in 2007 [24].
But for the G77, a coalition of 131 developing countries currently led by Argentina, the “common but differentiated responsibility”, one of the key principles of the UNFCCC, is not respected.
TABLE III. OFFICIAL GHG EMISSIONS* EVOLUTION FROM 1990 TO 2008 IN SOME SELECTED DEVELOPED COUNTRIES WITH AND WITHOUT LAND-USE, LAND-USE CHANGE AND FORESTRY (LULUCF); THEIR GHG EMISSIONS REDUCTION COMMITMENT WITHIN THE KYOTO PROTOCOL AND THEIR QUANTIFIED EMISSION LIMITATION AND REDUCTION OBJECTIVES (QELRO) BEFORE
THE COPENHAGEN CONFERENCE AND SINCE [31-32]. Countries GHG evolution without LULUCF (1990-2008) GHG evolution with LULUCF (1990-2008) Kyoto Protocol commitment (by 2008-2012)
Proposed QELRO for 2020 before the Copenhagen Conference (2009) and since†
Europe** -11.3% -13.3% -8.0% -20% to -30% compared to 1990 levels
USA +13.3% +15.3% -7.0%
(but not ratified)
-15% compared to 2005, that is -3% compared to 1990 None (June 2011) †
Japan +1.0% -0.2% -6.0% -15% compared to 2005, that is
-25% compared to 1990 None (June 2011) †
Canada +24.1% +33.6% -6.0% -20% compared to 2006, that is
+24% compared to 1990 None (June 2011) †
Australia** +31.4% +33.1% +8.0% -5% to -25% compared to 2000, that is -3% to -24% compared to 1990
New Zealand** +22.7% +62.4% 0.0% -10% to -20% compared to 1990
* Considering all GHG (CO2, CH4, NO2, HFCs, PFCs and SF6). All data expressed in CO2 equivalent (CO2 eq). http://unfccc.int/
Yet, Article 3 of the UNFCCC states: “The Parties should protect the climate system for the benefit of present and future generations of humankind, on the basis of equity and in accordance with their common but differentiated responsibilities and respective capabilities. Accordingly, the developed country Parties should take the lead in combating climate change and the adverse effects thereof”. Indeed, it is recognized that developed countries are principally responsible for the current high levels of GHG emissions in the atmosphere as a result of more than 120 years of industrial activity [33].
In 2008, the United States and the EU concentrated 12% of the world population and 32% of the global production-based CO2 emissions from fossil fuels use, but their cumulative CO2 emissions were representing 50% and 37% of the global CO2 emissions since 1890 and 1990, respectively. In the same time, Chinese and Indians represent 37% of the world population and their cumulative CO2 emissions were much lower: 12% since 1890 and 19% since 1990, compared to the current 27% [24,34]. The historical CO2 emissions debt is therefore huge. This so-called ‘climate justice’ is another reason for developing countries to ask for large cuts in GHG emissions from developed countries.
One thing is now clear for climate negotiators of developing countries and other observers: global mitigation strategies will certainly not be sufficient to stabilise atmospheric CO2 concentration in between 350 and 400 ppm by 2015, and industrialized developed countries have to take the lead in addressing the climate problem by drastically reducing GHG emissions while excluding developing countries from binding GHG emissions reductions.
B. Adaptation: Will we make it?
As mentioned above, developing countries are least responsible for causing climate change but are very likely to face disproportionate impacts in terms of natural disasters, agriculture, health effects and food security since already existing stresses on health, well-being, limited financial, institutional and human resources leave the poor most vulnerable and least able to adapt to the impacts of negative rapid changes, including climate change. Consequently, climate change may undermine the ability of developing countries, particularly least developed countries, to meet some targets of the Millennium Development Goals (MDGs), thereby slowing progress towards sustainable development. Yet, climate change poses a particular threat to those marginalized from development and global adaptation cost estimates for developing countries are extremely important as shown in Table IV.
TABLE IV. ESTIMATES OF ADAPTATION COSTS IN DEVELOPING COUNTRIES FOR 2010-2015[35]
Source US$ billion per year
World Bank (2006) 9-41
Stern (2006) 4-37
Oxfam (2007) >50
UNDP (2007) 86-109
UNFCCC (2007) 27-66
According to different studies, adaptation costs estimates in developing countries range in between 4 and 109 billion US$ per year for the 2010-2015 period [35].
At the COP 15 of the UNFCCC (the Copenhagen climate conference), developed countries agreed on an international aid package worth hundreds of billions of US$ for adaptation to threats linked to climate change prioritized for the most vulnerable countries, such as least developed countries, small islands developing States and Africa. The so-called fast-start fund worth US$ 10 billion annually would operate from 2010 until 2012. For long-term finance, developed countries agreed to support a goal of jointly mobilizing US$ 100 billion a year by 2020 to address the adaptation needs of developing countries.
A first key problem is that the amounts are much lower than many experts say is necessary to help poor countries adapt to climate change and develop cleaner technologies (Table IV). Another problem is that the Copenhagen Accord did not specify who would pay or how the money would be raised, at a time when most rich-world governments face unprecedented pressures to shore up their own budgets and find ways of supporting their own industries in the wake of agonizing debt and banking crises. In addition, while the Copenhagen Accord specifies that financing must be new and additional, it appeared than some donors have simply renamed existing aid budgets or counted previous pledges of climate finance [36].
So far, as of August 2011, the UNFCCC has recorded commitments for the fast-start funds of about US$ 5.9 billion, far short of the US$ 30 billion goal. But only 14 countries have already participated in that project, with one important missing country (Japan) who has promised half the total of the fast-start funds (US$ 15 billion) but who dramatically suffered from the recent devastating tsunami in addition to the global financial crisis [37].
Those difficulties, and others, over fast-start financing suggest that wealthy nations will face even more obstacles delivering on the larger promise of US$ 100 billion annually in new aid by 2020.
Recent actuality such as the current famine affecting 12 million people in East Africa shows that raising money for major emergency humanitarian aid is not an easy task while the problem of rainfall shortages and starvation is far from being new and surprising in this region of the world.
In addition, there is a large body of evidence that, even without climate change effects, the vulnerability of natural and human systems is extremely high, especially due to the mismanagement of natural resources, the lack of land use planning and the nonexistence of policies focused on natural hazard management.
The future of adaptation strategies to climate change seems therefore gloomy.
VII. CONCLUSION
Despite improving scientific understanding of climate change and a remarkable rise in public awareness of the importance of environmental issues, a shift in the political process is still awaited. Yet, no change is expected if all
current and historical major emitters do not negotiate and make mitigation efforts.
This situation is the same for corporate policies. As an example, Albert Frère, an important European businessman said: “We have to be reasonable in a globalized economy and not react too massively [about GHG emissions reduction] unless you offer such advantages to emerging competitors who do not respect the same ecologic standards that they could destroy our companies, in particular those who did strong ecological choices. This would be the worst thing to do in Europe. Yet, we have to act but only within the sound of our own economic survival.”3
In recent years, major changes in developed countries are seen in the development of more efficient technologies and the merchandising surrounding these progresses, such as the sudden apparition of the so-called greenwashing techniques used in advertising that suggest that all new products are ‘green’, ‘good for the planet’, ecologically friendly and beneficial to the environment (e.g. Fig. 10).
Figure 10. “Changing the world without changing the planet”. Typical ‘greenwasing’ advertising.
In the meantime, developing countries are very likely to face disproportionate impacts in terms of natural disasters,
3 « Ce n’est pas à vous que je dois rappeler qu’il faut savoir respecter la raison dans
une économie mondialisée et ne pas réagir trop massivement sous peine de donner à des compétiteurs émergents qui ne respecteraient pas les mêmes objectifs écologiques des avantages tels qu’ils pourraient réduire à néant nos entreprises et, en particulier, précisément celles ayant fait des choix écologiques déterminés. Ce serait en effet la dernière chose à faire en Europe. Au risque de me répéter, il faut agir mais dans les limites respectueuses de notre propre survie économique. » [38]
agriculture, health effects and food security while they are least responsible for causing climate change. It is not sure whether they will be able to adapt to such changes since it has been shown that even developed countries are not prepared for abrupt and extreme climate change [39].
REFERENCES
[1] FAO, “FaoStats,” 2011, http://faostat.fao.org/.
[2] International Energy Agency, World Energy Outlook 2004. OECD/IEA, Paris, France, 2004.
[3] International Energy Agency, World Energy Outlook 2009. OECD/IEA, Paris, France, 2009.
[4] International Energy Agency, World Energy Outlook 2010. OECD/IEA, Paris, France, 2010.
[5] J. Lyytimaki, “Mainstreaming climate policy: The role of media coverage in Finland,” Mitig. Adapt. Strateg. Glob. Change, vol. 16, pp. 649-661, 2011, doi: 10.1007/s11027-011-9286-x
[6] Y. Sampei and M. Aoyagi-Usui, “Mass-media coverage, its influence on public awareness of climate-change issues, and implications for Japan’s national campaign to reduce greenhouse gas emissions.” Glob. Environ. Change, vol. 19, pp. 203-212, 2009, doi:10.1016/j.gloenvcha.2008.10.005 [7] S. Billett, “Dividing climate Change: global warming in the
Indian mass media,” Climatic Change, vol. 99, pp.1-16, 2010, doi: 10.1007/s10584-009-9605-3
[8] Core Writing Team, R. K. Pachauri, and A. Reisinger, Climate Change 2007: Synthesis Report. Contribution of Working Groups I, II and III to the Fourth Assessment Report of the Intergovernmental Panel on Climate Change. IPCC, Geneva, Switzerland, 2007.
[9] M. Cozier, “Restoring confidence at the Cancun Climate Change Conference,” Greenhouse Gas Sci. Technol., vol. 1, pp. 8–10, 2011, doi: 10.1002/ghg3.010
[10] P. Ozer, “Vague de froid sur la Conférence de Cancun?,” La Libre Belgique, Bruxelles, Belgium, pp. 52-53, 2010.
http://hdl.handle.net/2268/76872
[11] P. Friedlingstein, R. A. Houghton, G. Marland, J. Hackler, T. A. Boden, et al., “Update on CO2 emissions,” Nature Geosci.,
vol. 3, pp. 811-812, 2010.
[12] T. Conway and P. Tans, “Trends in atmospheric carbon
dioxide”, NOAA/ESRL, 2011,
www.esrl.noaa.gov/gmd/ccgg/trends/
[13] D. Lüthi, M. Le Floch, B. Bereiter, T. Blunier, J.-M. Barnola, et al., “High-resolution carbon dioxide concentration record 650,000–800,000 years before present,” Nature, vol. 453, pp. 379-382, 2008, doi:10.1038/nature06949
[14] Global Carbon Project, “Carbon Budget 2009,” 20 January 2011, http://www.globalcarbonproject.org/.
[15] P. Jones, “Global temperature record,” January 2011,
http://www.cru.uea.ac.uk/cru/info/warming/.
[16] A. Cazenave and W. Llovel, “Contemporary sea level rise,” Annu. Rev. Mar. Sci., vol. 2, pp. 145-73, 2010, doi: 10.1146/annurev-marine-120308-081105
[17] S. Rahmstorf, “A new view on sea level rise,” Nature Reports Climate Change, vol. 4, pp. 44-45, 2010, doi: doi:10.1038/climate.2010.29
[18] R. J. Nicholls and A. Cazenave, “Sea-level rise and its impact on coastal zones,” Science, vol. 328, pp. 1517-1520, 2010, doi: 10.1126/science.1185782.
[19] UNEP/GRID-Arendal, “Impact of sea level rise on the Nile delta,” UNEP/GRID-Arendal Maps and Graphics Library,
2009, http://maps.grida.no/go/graphic/impact-of-sea-level-rise-on-the-nile-delta
[20] K. Warner, M. Hamza, A. Oliver-Smith, F. Renaud, and A. Julca, “Climate change, environmental degradation and migration,” Nat. Hazards, vol. 55, pp. 689-715, 2010, doi:10.1007/s11069-009-9419-7
[21] F. Laczko and C. Aghazarm, Migration, environment and climate change: assessing the evidence. International Organisation for Migration, Geneva, Switzerland, 2009. [22] Christian Aid, Human tide: The real migration crisis.
Christian Aid Report, London, UK, 2007.
[23] N. Myers, “Environmental refugees: a growing phenomenon of the 21st century,” Phil. Trans. R. Soc. Lond. B, vol. 357, pp. 609-613, 2002, doi:10.1098/rstb.2001.0953
[24] International Energy Agency, CO2 emissions from fuel combustion – Highlights 2010. OECD/IEA, Paris, France, 2010.
[25] P. Ozer, “Developing countries facing global warming: a post-Kyoto assessment. Round-table debate,” In: M. De Dapper, D. Swinne, and P. Ozer, Eds. Developing countries facing
global warming: a post-Kyoto assessment, Académie royale
des Sciences d’Outre-Mer, Brussels, Belgium, pp. 327-334, 2010, http://hdl.handle.net/2268/96011
[26] The Independent, “The UK causes 2 per cent of global carbon emissions. What should we do about the remaining 98 per cent?,” The Independent, 27 June 2007,
http://www.independent.co.uk/environment/climate-change/climate-change-the-big-debate-454851.html
[27] D. Guan, G. P. Peters, C. L. Weber, and K. Hubacek, “Journey to world top emitter: An analysis of the driving forces of China’s recent CO2 emissions surge,” Geophys. Res.
Lett., vol. 36, 2009, L04709, doi:10.1029/2008GL036540 [28]S.J. Davis and K. Caldeira, “Consumption-based accounting
of CO2 emissions,” PNAS, vol. 107, pp. 5687-5692, 2010,
doi:10.1073/pnas.0906974107
[29] P. Ozer and D. Perrin, “Les Chinois croient au Père Noël,” Le Soir, Bruxelles, Belgium, p. 20, 2007.
http://hdl.handle.net/2268/16672
[30] C. Le Quéré, M. R. Raupach, J. G. Canadell, G. Marland, L. Bopp, et al., “Trends in the sources and sinks of carbon dioxide,” Nature Geosci., vol. 2, pp. 831-836, 2009.
[31] UNFCCC, National greenhouse gas inventory data for the period 1990-2008. United Nations, 2010.
http://unfccc.int/resource/docs/2010/sbi/eng/18.pdf
[32] P. Ozer, “Négociations sur les changements climatiques: Le point sur les enjeux des acteurs de Copenhague,” Working Paper, Département des Sciences et Gestion de l’Environnement, Université de Liège, 2009,
http://hdl.handle.net/2268/25296
[33] W. S. Broecker, “CO2 arithmetic,” Science, vol. 315, p. 1371,
2007.
[34] International Energy Agency, How the energy sector can deliver on a climate agreement in Copenhagen. OECD/IEA, Paris, France, 2009.
[35] M. Parry, N. Arnell, P. Berry, D. Dodman, S. Fankhauser, et al., Assessing the costs of adaptation to climate change: A review of the UNFCCC and other recent estimates. International Institute for Environment and Development / Grantham Institute for Climate Change, London, UK, 2009.
http://pubs.iied.org/pdfs/11501IIED.pdf
[36] J. Kanter, “Calculating commitment to the climate,” The New York Times, New York, USA, 24 October 2010.
http://www.nytimes.com/2010/10/25/business/energy-environment/25green.html?_r=2&ref=science
[37] http://www.faststartfinance.org/content/contributing-countries
[38] A. Frère, “Réponse à Felipe van Keirsblick,” Etopia, Revue d’écologie politique, vol. 9, pp. 11-13, 2011.
[39] P. Martens, J. C. J. H. Aerts, B. Amelung, L. M. Bouwer, C. T. Chang, et al., “Imagining the unimaginable: synthesis of essays on abrupt and extreme climate change,” Current Opinion in Environmental Sustainability, vol. 2, pp. 347-355, 2010, doi:10.1016/j.cosust.2010.10.005
![Figure 6. Estimates for 21st century sea level rise from semi-empirical models as compared to the IPCC Fourth Assessment Report [8]](https://thumb-eu.123doks.com/thumbv2/123doknet/6163986.158115/6.918.472.839.206.965/figure-estimates-century-empirical-compared-fourth-assessment-report.webp)

![Figure 9. Fossil fuel CO 2 emissions (GtC per year) since 1990 compared with the six IPCC scenarios [30]](https://thumb-eu.123doks.com/thumbv2/123doknet/6163986.158115/9.918.86.441.383.623/figure-fossil-fuel-emissions-gtc-compared-ipcc-scenarios.webp)

![TABLE IV. E STIMATES OF ADAPTATION COSTS IN DEVELOPING COUNTRIES FOR 2010-2015 [35]](https://thumb-eu.123doks.com/thumbv2/123doknet/6163986.158115/11.918.96.439.957.1056/table-iv-e-stimates-adaptation-costs-developing-countries.webp)
