HAL Id: hal-01484555
https://hal.sorbonne-universite.fr/hal-01484555
Submitted on 7 Mar 2017
HAL is a multi-disciplinary open access
archive for the deposit and dissemination of
sci-entific research documents, whether they are
pub-lished or not. The documents may come from
teaching and research institutions in France or
abroad, or from public or private research centers.
L’archive ouverte pluridisciplinaire HAL, est
destinée au dépôt et à la diffusion de documents
scientifiques de niveau recherche, publiés ou non,
émanant des établissements d’enseignement et de
recherche français ou étrangers, des laboratoires
publics ou privés.
Distributed under a Creative Commons Attribution| 4.0 International License
Loss of spatacsin function alters lysosomal lipid
clearance leading to upper and lower motor neuron
degeneration
Julien Branchu, Maxime Boutry, Laura Sourd, Marine Depp, Céline Leone,
Alexandrine Corriger, Maeva Vallucci, Typhaine Esteves, Raphaël Matusiak,
Magali Dumont, et al.
To cite this version:
Julien Branchu, Maxime Boutry, Laura Sourd, Marine Depp, Céline Leone, et al.. Loss of
spatac-sin function alters lysosomal lipid clearance leading to upper and lower motor neuron degeneration.
Neurobiology of Disease, Elsevier, 2017, 102, pp.21-37. �10.1016/j.nbd.2017.02.007�. �hal-01484555�
Loss of spatacsin function alters lysosomal lipid clearance leading to
upper and lower motor neuron degeneration
Julien Branchu
a,b,c,d, Maxime Boutry
a,b,c,d, Laura Sourd
a,b,c,d,e, Marine Depp
a,b,c,d,e, Céline Leone
a,b,c,d,e,
Alexandrine Corriger
a,b,c,d,e, Maeva Vallucci
a,b,c,d,e, Typhaine Esteves
a,b,c,d,e, Raphaël Matusiak
a,b,c,d,
Magali Dumont
a,b,c,d, Marie-Paule Muriel
a,b,c,d, Filippo M. Santorelli
f, Alexis Brice
a,b,c,d,
Khalid Hamid El Hachimi
a,b,c,d,e, Giovanni Stevanin
a,b,c,d,e,⁎
, Frédéric Darios
a,b,c,d,⁎
a
Sorbonne Universités, UPMC Univ Paris 06, UMR S 1127, F-75013 Paris, France
b
Inserm, U1127, F-75013 Paris, France
c
CNRS, UMR 7225, F-75013 Paris, France
dInstitut du Cerveau et de la Moelle épinière, ICM, F-75013 Paris, France
eEcole Pratique des Hautes Etudes, PSL Research University, Laboratoire de Neurogénétique, F-75013 Paris, France f
Molecular Medicine, IRCCS Stella Maris Foundation, Calambronne, I-56100 Pisa, Italy
a b s t r a c t
a r t i c l e i n f o
Article history: Received 26 October 2016 Revised 10 January 2017 Accepted 20 February 2017 Available online 22 February 2017Mutations in SPG11 account for the most common form of autosomal recessive hereditary spastic paraplegia (HSP), characterized by a gait disorder associated with various brain alterations. Mutations in the same gene are also responsible for rare forms of Charcot-Marie-Tooth (CMT) disease and progressive juvenile-onset amyo-trophic lateral sclerosis (ALS). To elucidate the physiopathological mechanisms underlying these human pathol-ogies, we disrupted the Spg11 gene in mice by inserting stop codons in exon 32, mimicking the most frequent mutations found in patients. The Spg11 knockout mouse developed early-onset motor impairment and cognitive deficits. These behavioral deficits were associated with progressive brain atrophy with the loss of neurons in the primary motor cortex, cerebellum and hippocampus, as well as with accumulation of dystrophic axons in the corticospinal tract. Spinal motor neurons also degenerated and this was accompanied by fragmentation of neu-romuscular junctions and muscle atrophy. This new Spg11 knockout mouse therefore recapitulates the full range of symptoms associated with SPG11 mutations observed in HSP, ALS and CMT patients. Examination of the cellular alterations observed in this model suggests that the loss of spatacsin leads to the accumulation of lipids in lysosomes by perturbing their clearance from these organelles. Altogether, our results link lysosomal dysfunction and lipid metabolism to neurodegeneration and pinpoint a critical role of spatacsin in lipid turnover. © 2017 The Authors. Published by Elsevier Inc. This is an open access article under the CC BY-NC-ND license (http:// creativecommons.org/licenses/by-nc-nd/4.0/). Keywords: Motor neuron Neurodegeneration Lysosome Lipids SPG11 1. Introduction
Hereditary spastic paraplegias (HSP) constitute the second most common group of motor neuron diseases. They are characterized by progressive bilateral weakness, spasticity and the loss of vibration sen-sation in the lower limbs. These symptoms are mostly due to the degen-eration of upper motor neuron axons in the corticospinal tracts (Harding, 1983). The main causes of autosomal recessive HSP are muta-tions in the SPG11 gene. Symptoms of SPG11 patients generally appear
during thefirst decade of life and, in addition to spastic gait disorder, in-clude cognitive impairment, mental retardation, peripheral neuropathy, cerebellar ataxia, parkinsonism and retinal degeneration (Anheim et al., 2009; Puech et al., 2011; Stevanin et al., 2008). These symptoms are often associated with progressive thinning of the corpus callosum and white matter hyperintensities by brain magnetic resonance imaging (MRI) (Hehr et al., 2007; Stevanin et al., 2007). Mutations in SPG11 also account for autosomal-recessive Charcot Marie Tooth (CMT) dis-ease (Montecchiani et al., 2016) and slowly progressive juvenile-onset autosomal recessive amyotrophic lateral sclerosis (ALS) without cogni-tive impairment or abnormal MRI (Daoud et al., 2012; Orlacchio et al., 2010). In agreement, a recent neuropathological analysis of the brain from two patients with the full-blown SPG11 phenotype showed that the pathology partially mimics ALS lesions (Denora et al., 2016).
SPG11 encodes a 2443-amino acid protein called spatacsin. Regard-less of the associated phenotype, the vast majority of mutations
⁎ Corresponding authors at: Institut du Cerveau et de la Moelle épinière, Inserm U1127, CNRS UMR 7225, UPMC UMR S 1127, Hôpital de la Salpêtrière, 47, boulevard de l'Hôpital, 75013, France.
E-mail addresses:giovanni.stevanin@upmc.fr(G. Stevanin),frederic.darios@upmc.fr
(F. Darios).
Available online on ScienceDirect (www.sciencedirect.com).
http://dx.doi.org/10.1016/j.nbd.2017.02.007
0969-9961/© 2017 The Authors. Published by Elsevier Inc. This is an open access article under the CC BY-NC-ND license (http://creativecommons.org/licenses/by-nc-nd/4.0/).
Contents lists available atScienceDirect
Neurobiology of Disease
identified in SPG11 patients are nonsense or frameshift mutations, which are predicted to lead to the loss of function of spatacsin (Montecchiani et al., 2016; Orlacchio et al., 2010; Stevanin et al., 2008). The nature of the mutation is not responsible for the variability in phenotype as intrafamilial phenotypic variability has been observed, with the same mutations leading to juvenile ALS in one patient and HSP with a thin corpus callosum in his sibling (Daoud et al., 2012).
Spatacsin interacts with proteins involved in membrane-trafficking (Hirst et al., 2013), among which AP5Z1 (SPG48) and spastizin/ zFYVE26 (SPG15) are also implicated in hereditary spastic paraplegia, when mutated (Hanein et al., 2008; Slabicki et al., 2010). The symptoms of patients mutated in the SPG15 or SPG11 gene are very similar (Hanein et al., 2008), in agreement with their involvement in the same cellular mechanisms. Indeed, recent investigations infibroblasts of SPG11 and SPG15 patients (Renvoise et al., 2014) and studies in mouse models
have suggested that the loss of spatacsin or spastizin alters the function of the endolysosomal system (Khundadze et al., 2013; Varga et al., 2015). Furthermore, spatacsin and spastizin have been shown to be in-volved in lysosome-recycling after fusion with autophagosomes in HeLa cells (Chang et al., 2014). In agreement, an Spg11 knockout mouse model, obtained by inserting a genetrap cassette in thefirst intron of the Spg11 gene, showed that the loss of spatacsin impairs autolysosome reformation, ultimately leading to depletion of lysosomes and impaired autophagic clearance (Varga et al., 2015). This Spg11 model reproduced the neurodegeneration in the motor cortex and cerebellum observed in SPG11 patients, but did not show any early-onset motor or cognitive deficits, amyotrophy or alterations of the corpus callosum as frequently observed in SPG11 patients.
We therefore extensively characterized a new Spg11 knockout mouse model. These Spg11−/−animals displayed early-onset motor
Fig. 1. Spg11 knockout causes a progressive motor deficit in mice. (A). Diagram showing the genomic structure of the Spg11 gene (top), the targeting vector (middle) and the targeted locus upon excision of the neomycin resistance cassette and action of the Cre-recombinase (bottom). The mutations introduced were c.6052CNT (p.Arg2018*), corresponding to c.6091CNT (p.Arg2031*) in human and c.6061CNT (p.Gln2021*), corresponding to c.6100CNT (p.Arg2034*) in human. (B) Western blot of brain protein extracts showing the absence of spatacsin in Spg11−/−samples and the strong decrease in the levels of spastizin. Representative image of three independent experiments. * : non-specific band. (C and D), Pictures showing an Spg11+/+
(C) and Spg11−/−mouse (D) at 16 months of age. Knockout mice had an abnormal posture and kyphosis of the spine.
Fig. 2. Spg11 knockout mice develop a progressive spastic and ataxic gait disorder. (A and B) Gait angle sketch (A) and values recorded (B) during a forced walk on a treadmill. The gait angle decreased in Spg11−/−mice from four months of age (n≥ 12 animals/genotype/age; Kruskal-Wallis test; *p ≤ 0.05 and ***p ≤ 0.001). (C) Step sequence regularity values recorded during a forced walk on a treadmill. Spg11−/−mice exhibited motor coordination impairment from eight months of age (n≥ 12 animals/genotype/age; Kruskal-Wallis test; **p ≤ 0.01 and ***p≤ 0.001). (D and E) Rotarod duration (D) and maximum speed (E). The duration and maximum speed of Spg11−/−in accelerated rotarod testing was less than those of heterozygous
and control mice at as early as six weeks of age (n≥ 12 animals/genotype/age; Kruskal-Wallis test; *p ≤ 0.05, **p ≤ 0.01 and ***p ≤ 0.001). (F and G) The Y-maze principle (F) and spontaneous alternation values (G). Knockout mice did not show a preference between the visited and the unknown arm of the maze from four months of age (n≥ 12 animals/ genotype/age; Kruskal-Wallis test; ***p≤ 0.001). This altered cognitive behavior underlines a spatial learning or a memory deficit. (H and I) Fear conditioning. Percentage of time spent in a frozen posture on day 1 before and after electrical shocks (H). There was no obvious learning deficit during the conditioning of the mice at any age. Percentage of time spent in a frozen posture on day 2, without any electrical shocks, after conditioning (I). Although the task was learned, knockout mice spent less time in a frozen position from eight months of age, indicating a cognitive and memory deficit (n ≥ 10 animals/genotype/age; Kruskal-Wallis test; **p ≤ 0.01 and ***p ≤ 0.001).
and cognitive deficits as well as signs of peripheral neuropathy, recapit-ulating the human disease. These deficits were paralleled by neurode-generation in the motor cortex, cerebellum, hippocampus, and spinal cord as well as alterations of neuromuscular junctions and muscular at-rophy. This degeneration was accompanied by an accumulation of lipid
material in lysosomal structures, similar to the observations made in human SPG11 brains (Denora et al., 2016). Investigation of primary cul-tures of mouse embryonicfibroblasts and cortical neurons showed that this accumulation was due to the loss of lipid clearance in lysosomes normally promoted by spatacsin.
2. Results
We investigated the physiological role of spatacsin by disrupting the expression of Spg11 in mice by inserting two successive stop codons in exon 32 of the gene (Fig. 1A), the most frequently mutated exon in SPG11 patients (Stevanin et al., 2008; Stevanin et al., 2007). When het-erozygous mice (Spg11+/−) were mated, knockout mice were generat-ed in the expectgenerat-ed Mendelian ratio and were viable. They developgenerat-ed normally, were fertile and had survival rates similar to those of their wild-type and heterozygous littermates (data not shown). We used Western blotting to verify that the disruption of the Spg11 gene resulted in spatacsin depletion (Fig. 1B). Spatacsin has been shown to interact with spastizin/zFYVE26. Thus, we tested whether the loss of spatacsin affected spastizin expression levels. As observed in patientfibroblasts (Renvoise et al., 2014), spastizin levels in Spg11−/−brain samples were 9.0% ± 3.8% (n = 3) of those of control (Spg11+/+) brain samples
(Fig. 1B).
Spg11−/−mice had no dysmorphic features or abnormalities up to the age of eight months relative to control littermates (data not shown). However, at 16 months, the age at which we stopped the study for ethical reasons, most of the knockout mice had an abnormal posture with spread hind limbs, lower pelvic elevation and pronounced kyphosis of the thoracic spine (Fig. 1C and D).
2.1. Spg11-knockout mice develop an early-onset motor deficit
We evaluated the consequences of the loss of function of spatacsin on motor functions by performing a series of complementary behavioral tests. From the age of four months onwards, Spg11−/−mice displayed a progressive gait disorder and ataxia, which were quantified by record-ing the walkrecord-ing of mice on a treadmill at moderate speed (10 cm.s−1) (Fig. 2A, B and C). This test showed that gait angle, the position of the hind paws relative to the axis of the body, was significantly higher in knockout mice than in control mice, from the age of four months on-wards (Fig. 2A and B). With age, Spg11−/−mice displayed a spreading of the hind limbs and began to drag their feet slightly during a forced walk (data not shown). We evaluated a possible ataxic gait by analyzing step sequence regularity, which reflects motor coordination. The regu-larity of the step sequence of Spg11−/−mice was much lower than that of Spg11+/+mice from eight months of age (Fig. 2C). The motor
deficit was even more marked in the rotarod test, a forced-run-para-digm. Spg11−/−mice displayed thefirst signs of motor impairment at the age of only six weeks in this test. The knockout mice remained on an accelerating rotarod for significantly less time than heterozygous and control mice, and could not reach the same maximum speed on the rotarod apparatus (Fig. 2D and E). This motor deficit worsened with time. Motor performance decreased with age in control and het-erozygous mice, but was systematically better in these mice than in the knockout mice.
2.2. Loss of spatacsin causes a cognitive deficit in mice
We subjected mice to the Y-maze spontaneous-alternation test to evaluate any cognitive deficits. This test relies on the tendency of mice to explore new environments and is used to monitor spatial memory (Hughes, 2004) (Fig. 2F). During thefirst phase, mice were allowed to freely explore the only open arm of the maze and were confined there for one minute by closing a door behind them. During the second phase, they were placed at the entrance of the maze with both arms open. As expected, Spg11+/+and Spg11+/−mice naturally chose to
ex-plore the unknown arm of the maze, a new environment, in ~75% of the trials, rather than the part of the maze that had already been explored. In contrast, Spg11−/−mice showed a lower tendency to enter the un-known arm than the Spg11+/+mice at six weeks of age, and from four months on, the Spg11−/−mice showed no preference between the vis-ited and unknown arms (Fig. 2G), suggesting an alteration in short-term
spatial working memory in the knockout mice. We performed a fear conditioning experiment, in which a neutral context was associated with two aversive electric shocks, to determine whether different types of memory were affected. Freezing normally reflects the stress be-havior in response to an aversive stimulus. The freezing baseline slightly increased with age, but we observed no significant differences between knockout mice and wild-type or heterozygous littermates. The two elec-tric shocks triggered a marked increase of freezing in all groups (Fig. 2H). The next day, the percentage of time that wild-type and heterozy-gous mice spent in a frozen posture without an electric shock was high, showing that the task was learned. In contrast, Spg11−/−mice spent less time in a frozen posture from eight months on (Fig. 2I), suggesting that the knockout mice had a long-term emotional memory deficit. 2.3. Loss of spatacsin causes cortical, cerebellar and hippocampal atrophy
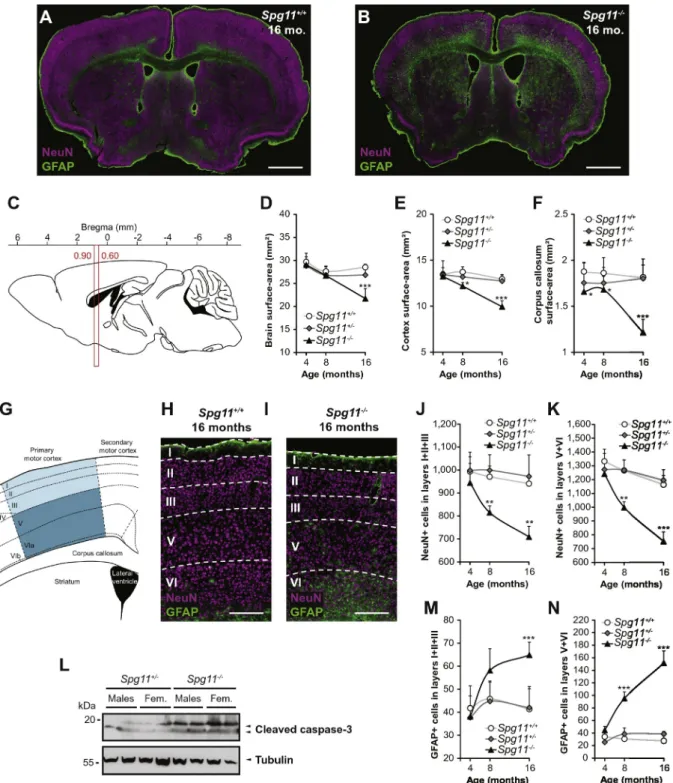
We investigated whether the observed behavioral phenotypes re-sulted from neurodegeneration by analyzing the cortex, cerebellum and hippocampus of Spg11−/−mice. We measured the surface-areas of the brain and cortex on coronal brain sections (Bregma 0.90 to 0.60 mm) (Fig. 3A–E). The surface-area of the brain was lower in the Spg11−/−than wild type mice only at 16 months (Fig. 3D), but the sur-face-area of the cortex was lower from eight months onwards (Fig. 3E). The surface-area of the corpus callosum was affected after only four months (Fig. 3F). We then determined the number of cortical neurons in the primary motor cortex by immunostaining coronal sections of the brain for NeuN (Fig. 3G, H, and I). The number of neurons in the cor-tical layers was unaffected in four-month-old Spg11−/−mice, but from the age of eight months on, it was significantly lower than in Spg11+/ +mice (Fig. 3J and K). Neuronal degeneration worsened with time
and was accompanied by astrogliosis, as shown by an increase in GFAP-positive cells (Fig. 3H, I, M, and N). We also observed increased levels of active caspase-3 in the cortex of Spg11−/−mice, suggesting that neuronal death occurs via an apoptotic pathway (Fig. 3L).
Similarly, we measured the surface-areas of coronal sections of the cerebellum (Bregma−6.00 to −6.30 mm) (Fig. 4A) and showed that this structure was atrophied in Spg11−/−mice from eight months on (Fig. 4B). Accordingly, the degeneration of Purkinje cells, labeled by Calbindin-immunostaining, followed a similar time course and was also accompanied by marked astrogliosis (Fig. 4C, D, and E).
As the Spg11−/−mice displayed memory deficits, we examined the hippocampus by labeling neurons with anti-NeuN antibodies and astro-cytes with anti-GFAP antibodies (Fig. 4G and H). We measured the sur-face-area of the hippocampus in brain coronal sections (Bregma−1.70 to−2.00 mm) (Fig. 4F). Spg11−/−mice exhibited atrophy of the hippo-campus relative to the control mice from four months on (Fig. 4G–I). The surface-areas of the granule layer of the CA1 region and the dentate gyrus were lower in the knockout than control mice from four months of age. The surface area of the granule layer in the CA2 and CA3 regions was lower in the Spg11−/−than control mice only at 16 months of age (Fig. 4J–L). We observed no astrocyte proliferation in these structures. 2.4. Spg11−/−mice show spinal cord atrophy and axonal degeneration in the corticospinal tract
We examined transverse, 0.5μm semi-thin sections of cervical and lumbar spinal cords of mice of different ages by toluidine blue-staining (Fig. 5A and B). The surface-area and structure of the whole spinal cord of knockout and control mice were similar at four months of age. How-ever, by 16 months of age, the whole spinal cord of Spg11−/−mice showed significant atrophy compared to the Spg11+/+
mice (Cervical −31,5%, lumbar −29,2%) (Fig. 5A–F), as in the brain and cerebellum. Accordingly, at that stage, the surface-areas of the white and gray mat-ter were lower in both the cervical and lumbar sections of Spg11−/− spi-nal cords (Fig. 5E and F). At eight months of age, the surface-areas of the white and gray matter in the cervical section of knockout mice were
similar to those of the control mice (Fig. 5C). In contrast, at that age, lumbar sections already showed thefirst signs of atrophy, with a slightly lower surface-area of the white matter than in controls (Fig. 5D).
We then assessed whether the degeneration of the cortico-spinal tracts that occurs in the human SPG11 disease, also occurs in Spg11
knockout mice. We found that the distribution of the nervousfibers of the corticospinal tract was different in Spg11−/−mice compared to that of Spg11+/+mice (Fig. 5G and H). The percentage of small axons
(b5 μm2
) was significantly higher in Spg11−/−mice from eight months
of age than in age-matched controls (Fig. 5K). In parallel, the percentage of large axons (N15 μm2) was significantly lower in the knockout-mice.
Fig. 3. Loss of spatacsin causes severe cortical damage. (A and B) Brain coronal slices of Spg11+/+
(A) and Spg11−/−(B) mice at 16 months of age. GFAP (green; astrocyte marker), and NeuN (magenta; neuronal marker) immunostaining. Scale bars: 1 mm. (C) Sagittal view of mouse brain showing the location of the coronal cut sections between Bregma 0.90 and 0.60 mm. (D– F) Brain (D), cortex (E) and corpus callosum (F) surface-areas. The surface-areas of the cortex and corpus callosum decreased from eight and four months, respectively, prior to general brain atrophy (n≥ 5 slices/animal and n ≥ 5 animals/genotype/age; Kruskal-Wallis test; *p ≤ 0.05 and ***p ≤ 0.001). (G) Diagram of the primary motor cortex layers between Bregma 0.90 and 0.60 mm. (H and I) NeuN (magenta) and GFAP (green) immunostaining in the primary motor cortex of Spg11+/+
(H) and Spg11−/−(I) mice at 16 months of age. Scale bars: 200μm. (J and K) Quantification of total NeuN-positive cells in the primary motor cortex layers I + II + III (J) and V + VI (K). Immunostaining revealed a significant reduction in the number of neurons from layers I–VI of the motor cortex in knockout mice from eight months of age. (n ≥ 10 slices/animal and n ≥ 5 animals/genotype/age; Kruskal-Wallis test; **p≤ 0.01 and ***p ≤ 0.001). (L) Western blot of 16-month-old Spg11+/−and Spg11−/−brain samples showing the presence of cleaved (active) caspase-3 in the absence of spatacsin.
(M and N) Quantification of total GFAP-positive cells in the primary motor cortex layers I + II + III (M) and V + VI (N). Neuron loss was accompanied by marked astrogliosis (n ≥ 10 slices/animal and n≥ 5 animals/genotype/age; Kruskal-Wallis test; ***p ≤ 0.001).
This pathological phenotype worsened with time (Fig. 5L). In addition, the corticospinal tract of knockout mice exhibited numerous dystrophic axons from eight months of age (Fig. 5H and N). On the contrary, the
structure and organization of an ascending tract, the cuneate fasciculus, were similar between Spg11−/−and Spg11+/+mice of any age (Fig. 5I,
2.5. Loss of spatacsin causes loss of lower motor neurons and myofibers We evaluated the loss of spinal motor neurons by staining sections of lumbar spinal cord with an anti-choline acetyl transferase (ChAT) an-tibody (Fig. 6A and B). The number of motor neurons decreased in the spinal cord of Spg11−/−mice from eight months onwards (Fig. 6C). Measurement of the cell body size in these neurons showed that the number of large motor neurons, with a surface-areaN600 μm2, was
lower in knockout animals, whereas the number of small motor neu-rons (b300 μm2) was unaffected (Fig. 6D–F). We then examined the
neuromuscular junctions (NMJ) of the soleus muscle, staining the post-synaptic compartment withα-bungarotoxin and the presynaptic com-partment with anti-neurofilament and anti-synaptophysin antibodies (Fig. 6G–I). The size of the NMJ decreased and the number of fragmented NMJs increased in Spg11−/−mice from eight months on (Fig. 6J, and K). This alteration of NMJs was associated with slight and progressive atrophy of the soleus muscle from the age of eight months in Spg11−/−mice (Fig. 6L and M). This atrophy resulted from a decrease in the number of myofibers in the soleus muscle of Spg11−/−mice and a slight decrease in their surface-area (Fig. 6N and O), suggesting that these animals exhibit progressive amyotrophy. We observed similar re-sults in the tibialis and plantaris skeletal muscles (data not shown). Ac-cordingly, a grip test that measures traction strength showed that Spg11−/−mice lost muscular strength in both forelimbs and hind limbs from 12 months on (Fig. 6P).
2.6. Loss of spatacsin leads to early lysosomal dysfunction
We then evaluated the cellular alterations underlying neurodegen-eration in Spg11−/−mice. Autofluorescent intracellular material accu-mulated in the neurons of the cerebral cortex in Spg11−/−mice. We observed this accumulation in six week-old knockout mice, whereas large autofluorescent particles were not detected until the age of 16 months in control mice. At this stage, the deposits in the motor neu-rons of knockout mice were more numerous and larger than those in control mice (Fig. Sup 1A). We did not detect autofluorescence upon ex-citation at 635 nm (Fig. Sup 1B), so it was possible to analyze its colocalization with various markers. Lamp1 immunoreactivity surrounded the autofluorescent aggregates (Fig. 7A), suggesting that the loss of spatacsin altered lysosomal function. Lysosomes play a key role in autophagosome degradation, and lysosomal dysfunction is thought to lead to the accumulation of autophagolysosomes (Menzies et al., 2015). We therefore investigated whether the autofluorescent ag-gregates colocalized with p62, a marker of autophagy substrates. We observed colocalization of p62 with autofluorescent aggregates only in Spg11−/−mice at 16 months of age (Fig. 7B). We observed similar autofluorescent aggregates surrounded by Lamp1 immunostaining in Purkinje cells in the cerebellum (Fig. Sup 2A and B) and in spinal motor neurons (data not shown) of 16 month-old Spg11−/−mice. The autophagy marker p62 also colocalized with the autofluorescent aggre-gates in Purkinje cells of Spg11−/−mice from the age of eight months (Fig. Sup 2C). These data suggest that autophagic substrates accumulate in lysosomal structures in the cerebral and cerebellar cortex and in spi-nal motor neurons in Spg11−/−mice, but only at late stages of the dis-ease. We further investigated changes in autophagy by carrying out
Western blotting to determine the levels of LC3-II, the lipidated form of LC3 recruited to autophagosomes. LC3-II levels were similar in control and knockout mice, at all ages (Fig. 7C). Thus, spatacsin loss led to the accumulation of the p62 autophagic marker, but this accumulation seems to be only a late event in the disease process.
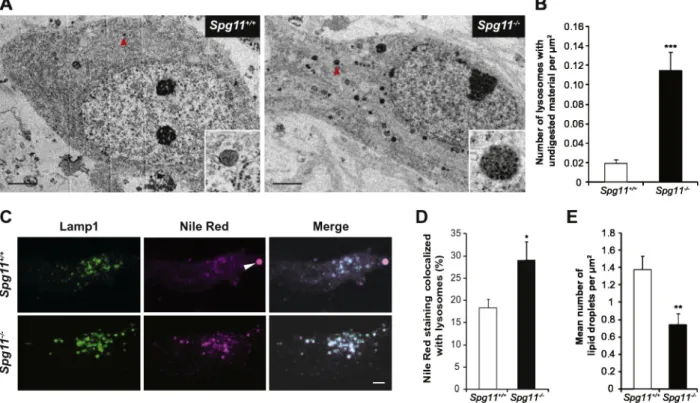
We analyzed cortical and spinal neurons by electron microscopy to confirm the alteration of lysosomal function in the brain and spinal cord of Spg11−/−mice (Fig. 8). Lysosomes appeared as electron-dense organelles surrounded by a membrane. We observed in the cortical neu-rons of two-month old knockout animals lysosomes containing osmiophilic material, suggesting the presence of undigested material (Fig. 8A). These lysosomes also contained low-density structures that are consistent with lipid droplets (Fig. 8A). The size of these lipofuscin-like particles strongly increased with age, as did the size of ly-sosomes containing autofluorescent material (Fig. 8A). We also ob-served similar lysosomes in spinal motor neurons, Purkinje cells and hippocampal neurons of Spg11−/−mice from the age of two months (Fig. 8Band data not shown). These structures were positive for cathep-sin D, suggesting a lysosomal origin (Fig. 8C). Similar structures have been observed in a large number of cortical neurons in the brain of an SPG11 patient (Denora et al., 2016) carrying two truncating heterozy-gous mutations in trans (Fig. 8D), suggesting that they contribute to the neuropathological process. The significant increase in lipid-contain-ing structures in Spg11−/−neurons, even in young animals, suggests that lipid clearance by lysosomes may be impaired.
2.7. Spatacsin promotes the clearance of lipids from lysosomes
We investigated the cellular alterations underlying lysosomal dys-function in the brains of Spg11−/−mice by studying primary cultures of mouse embryonicfibroblasts and cortical neurons by electron mi-croscopy. The proportion of lysosomes containing osmiophilic material was significantly higher in Spg11−/−fibroblasts (Fig. 9A and B) and
neu-rons (Fig. 10A and B), as observed in the brains of Spg11 knockout mice and human SPG11 patients. We tested whether lysosomes accumulated lipidic material, by labeling lysosomes infibroblasts and neurons with the Lamp1 antibody and total lipids with Nile red, which stains all neu-tral and polar lipids (Greenspan et al., 1985). The proportion of Nile red staining colocalized with lysosomes was higher in Spg11−/−fibroblasts (Fig. 9C and D) and cortical neurons (Fig. 10C and D) than control cells, confirming the accumulation of lipids in lysosomes in both these cell types under basal conditions.
Material may accumulate in lysosomes due to changes in lysosomal pH or the inhibition of lysosomal proteolytic activity. The lysosomal pH was 4.59 ± 0.19 in controlfibroblasts and 4.53 ± 0.21 in Spg11−/−
fi-broblasts (n = 500 cells per replicate, 5 independent experiments per-formed in quadruplicate) as measured using the Lysosensor Green probe. Cathepsin B activity, monitored with the Magic Red Cathepsin B substrate, was not affected by the absence of spatacsin (data not shown). These data suggests that the accumulation of lipids in lyso-somes of Spg11−/−fibroblasts or neurons was not due to changes in ly-sosomal pH or cathepsin B activity.
We hypothesized that spatacsin could play a role in the clearance of lipids from lysosomes. It has been suggested that autophagy shuttles phospholipids of organelle membranes into lysosomes, and that fatty
Fig. 4. Loss of spatacsin causes cerebellar and hippocampal impairment. (A) Sagittal view of mouse brain showing the location of the coronal cut sections between Bregma−6.00 and −6.30 mm. (B) The surface-area of the cerebellum was lower in the knockout than in the control mice from eight months. (n ≥ 5 slices/animal and n ≥ 5 animals/genotype/age; Kruskal-Wallis test; *p≤ 0.05). (C) The number of Purkinje cells was lower from eight months of age in knockout mice (n ≥ 5 slices/animal and n ≥ 5 animals/genotype/age; Kruskal-Wallis test; ***p≤ 0.001). (D and E) Cerebellar sections immunostained for GFAP (green; astrocyte marker), Calbindin (magenta, Purkinje cell marker), and Hoechst-33258 (blue, nucleus marker) revealed a severe loss of Purkinje cells in knockout mice (E) compared to control mice (D). Scale bars: 100μm. PCL: Purkinje Cell Layer. (F) Sagittal view of mouse brain showing the location of the coronal cut sections between Bregma−1.70 and −2.00 mm. (G–H) NeuN (magenta; neuronal marker) and GFAP (green; astrocyte marker) immunostaining in the hippocampus of Spg11+/+(G) and Spg11−/−(H) mice at 16 months of age. Scale bars: 0.5 mm. CA1: cornu Ammonis 1 region, CA2: cornu Ammonis 2 region,
CA3: cornu Ammonis 3 region, DG: Dentate Gyrus region. (I) Hippocampal surface-area. The surface-area of the hippocampus was smaller in knockout than control mice at all ages (n≥ 5 slices/animal and n ≥ 5 animals/genotype/age; Kruskal-Wallis test; *p ≤ 0.05). (J–L) CA1 (J), CA2 + CA3 (K), and dentate gyrus (L) granule layer surface-areas. The surface-area of CA1 and the dentate gyrus granule layer were affected by atrophy from four months of age in knockout mice compared to control mice (n≥ 5 slices/animal and n ≥ 5 animals/ genotype/age; Kruskal-Wallis test; *p≤ 0.05).
acids hydrolyzed by the lysosomes then accumulate in lipid droplets (Rambold et al., 2015). We investigated whether autophagy induction affected the accumulation of lipids in lysosomes by monitoring Nile red and Lamp1 staining. We observed an accumulation of lipids in lyso-somes two and six hours after amino-acid deprivation, followed by lipid clearance from lysosomes and the accumulation of lipid droplets (Fig. 9C and D). Inhibition of lysosomal enzymes by pH neutralization with bafilomycin A1 blocked lipid clearance from the lysosomes, confirming that lipid clearance from lysosomes occurred actively (data not shown). Lipids were cleared significantly more slowly from the lysosomes of Spg11−/−fibroblasts than control cells, suggesting a role for spatacsin in lysosomal lipid clearance (Fig. 9D). Consistent with thesefindings, the number of lipid droplets was smaller in Spg11−/−than control cells after 24 h of amino-acid starvation (Fig. 9E). In untreated cells, the number of lipid droplets was also smaller in Spg11−/−fibroblasts or primary cortical neurons than in control cells (Figs. 9E and10E), also suggesting a role for spatacsin in the clearance of lipids from lyso-somes under basal conditions.
3. Discussion
Loss of function mutations in SPG11 cause a large variety of pheno-types ranging from pure to complex forms of motor neuron diseases, in-cluding pure forms of HSP, juvenile-onset ALS or CMT and complex forms of HSP associated with mental impairment or cognitive decline, neuropathy and abnormal MRI features (Montecchiani et al., 2016; Orlacchio et al., 2010; Stevanin et al., 2008). The most striking and com-mon clinical hallmark observed in SPG11 patients is gait disturbance with motor difficulties generally developing in the two first decades of life. Most patients display progressive spasticity of the lower limbs asso-ciated with severe muscular weakness. In the Spg11−/−mouse model generated in this study, behavioral tests revealed progressive gait im-pairment and motor dysfunction, beginning at the age of six weeks, con-sistent with thefirst symptoms detected in human patients before the age of 10 years. This phenotype was associated with progressive neuro-degeneration in the motor cortex and cerebellum, as well as the pres-ence of dystrophic axons in the corticopinal tract. SPG11 patients also frequently present peripheral neuropathy associated with distal muscle wasting, in particular when diagnosed with juvenile-onset ALS or CMT. In agreement, the Spg11−/−mouse model described here also present-ed a progressive loss of large motor neurons in the gray matter of the lumbar spinal cord and a high proportion of fragmented neuromuscular junctions. This degeneration together with the loss of muscular strength in 12-month old Spg11−/−mice is consistent with a late ALS-like pheno-type in the Spg11 mouse model. However, the homogenous decrease in the cross section of myofibers in Spg11−/−mice suggests that muscular
atrophy was not a consequence of denervation of individualfibers. Spatacsin may thus play a more general role in muscle physiology, and the loss of function of this protein could directly result in muscular atrophy. Our observation in the Spg11−/−mouse model is also consis-tent with the mental impairment observed in most SPG11 patients and the worsening cognitive decline as the disease progresses (Siri et al., 2010; Stevanin et al., 2008; Stevanin et al., 2006). The cognitive
impairment in the mouse was associated with the early atrophy of the hippocampus.
The Spg11 mouse model we characterized develops motor deficits much earlier than the Spg11-knockout mouse developed byVarga et al. (2015). We also observed degeneration of lower motor neurons and thinning of the corpus callosum that were absent in the model of
Varga et al. (2015), as well as cognitive impairment that was not report-ed. The discrepancies between the two models may be due to the strat-egy used to inactivate Spg11. Varga et al. inactivated Spg11 by inserting a genetrap cassette in thefirst intron of the gene, whereas we inserted stop codons in exon 32 to mimic the most frequent mutation observed in SPG11 patients (Hehr et al., 2007; Stevanin et al., 2008). The effects of these two types of mutations on some spatacsin isoforms may account for the differences in the results obtained by these two studies. The con-struct used byVarga et al. (2015)was predicted to encode a cytoplasmic fusion protein of the 82 N-terminal amino acids of spatacsin withβgeo (Varga et al., 2015). We could not verify whether the insertion of stop codons in exon 32 led to the production of a truncated protein or com-plete degradation of the mutant protein, because the antibody we used recognizes the C-terminal domain of spatacsin. The difference between the two studies reflects the remarkable range of phenotypes observed in humans. Indeed, no genotype-phenotype correlation has been shown in SPG11 patients. The same mutations can lead to different phenotypes in the same family (Daoud et al., 2012) and mutations in different parts of the SPG11 gene lead to the same pathology (Stevanin et al., 2008; Stevanin et al., 2007). Other factors, such as environmental, genomic, or epigenetic factors, may contribute to the variability of phenotypes found in SPG11 patients, and could contribute to the difference in the phenotype observed between our Spg11 mouse model and that devel-oped byVarga et al. (2015).
Histological and electron microscopy analyses showed the presence of cellular dysfunction in young animals, before neuronal death occurred. In the neurons of Spg11−/− animals, we observed autofluorescent particles that were surrounded by the lysosomal mark-er Lamp1 and organelles that contained lipidic matmark-erial by electron mi-croscopy. The size of both markers increased with age, suggesting that they are the same structure. There was no significant difference in the levels of the autophagy marker LC3-II in brains of the Spg11−/−mice relative to controls. It is however possible that mild changes in the au-tophagy pathway occur during disease progression, explaining the large accumulation of lipids and p62 in lysosomes in 16-month-old Spg11−/−mice, as well as in the brains of SPG11 patients (Denora et al., 2016).
Our data show that lipids accumulate in lysosomes very early in de-velopment. Indeed, they were already detected in cultured Spg11−/− fi-broblasts and neurons obtained from embryos. This may contribute in the long term to the generation of lipofuscin that has been proposed to be composed of numerous lipid species (Sulzer et al., 2008). How the loss of spatacsin function leads to the accumulation of lipids in lyso-somes remains to be determined. The absence of spatacsin did not alter lysosomal pH nor impair cathepsin B catalytic activity. Artificial activa-tion of autophagy in mouse embryonicfibroblasts resulted in the tran-sient accumulation of lipids in lysosomes and the formation of lipid
Fig. 5. Spg11−/−mice show spinal cord atrophy and axonal degeneration of the corticospinal tract. (A and B) Toluidine blue-stained transverse slices of Spg11+/+(A) and Spg11−/−(B)
mouse cervical spinal cord at 16 months of age. Scale bars: 0.5 mm. GM: gray matter, WM: white matter. (C–F) Surface-areas of the white and gray matter of the cervical (C and E) and lumbar (D and F) spinal cord at eight and 16 months of age. At eight months, the white matter surface-area of the lumbar spinal cord was lower in Spg11−/−mice than controls and at 16 months of age, the whole spinal cord of knockout mice was atrophied (n≥ 5 slices/animal and n ≥ 5 animals/genotype/age; Kruskal-Wallis test; *p ≤ 0.05 and **p ≤ 0.01). (G and H) Toluidine blue-stained transverse slices of Spg11+/+
(G) and Spg11−/−(H) mouse corticospinal tract at 16 months of age. Scale bars: 10μm. (I and J) Toluidine blue-stained transverse slices of Spg11+/+
(G) and Spg11−/−(H) mouse cuneate fasciculus at 16 months of age. Scale bars: 10μm. (K and L) Distribution of corticospinal tract axons according to their section surface-area at eight (I) and 16 (J) months of age. Knockout mice displayed a lower percentage of large surface-area axons than control mice from eight months of age (n≥ 5 slices/ animal and n≥ 10 animals/genotype/age; Kruskal-Wallis test; *p ≤ 0.05 and ***p ≤ 0.001). (M) Distribution of cuneate fasciculus axons according to their section surface-area at 16 months of age (n≥ 5 slices/animal and n ≥ 1 0 animals/genotype/age; Kruskal-Wallis test). (N) Number of dystrophic axons in a 10,000 μm2
area of the corticospinal tract at 4, 8, and 16 months of age (n≥ 5 slices/animal and n ≥ 10 animals/genotype/age; Kruskal-Wallis test; **p ≤ 0.01 and ***p ≤ 0.001). (O) Number of dystrophic axons in a 10,000 μm2
area of the cuneate fasciculus at 4, 8, and 16 months of age (n≥ 5 slices/animal and n ≥ 10 animals/genotype/age; Kruskal-Wallis test).
droplets, as observed in other models (Rambold et al., 2015). The clear-ance of lipids from lysosomes was lower in absence of spatacsin, which may account for the slight accumulation of lipids in lysosomes and the smaller number of lipid droplets at steady state. We were unable to pro-mote lipid accumulation in lysosomes upon starvation in cultured neu-rons, because they do not respond to this stimulus (data not shown), as previously reported (Mizushima et al., 2004). Nevertheless, the change in lipid metabolism was evident under basal conditions, suggesting that the loss of spatacsin function impaired lipid clearance from lysosomes in neurons as well.
The mechanism for spatacsin-mediated clearance of lipids from ly-sosomes remains enigmatic, especially as the precise subcellular locali-zation of spatacsin is still debated (Chang et al., 2014; Khundadze et al., 2013; Sagona et al., 2010; Slabicki et al., 2010; Vantaggiato et al., 2013). We hypothesize that spatacsin acts as a lipid transporter as it has been proposed to have transmembrane regions (Stevanin et al., 2007) and has been found to be localized in lysosomes (Hirst et al., 2013). Alterna-tively, the proposed role of spatacsin in autolysosome reformation (Chang et al., 2014) could play a role in sorting lipids within lysosomes. However, it was not possible to evaluate whether these tubular lyso-somal structures contained lipids, detected by Nile Red staining, be-cause of their small diameter. The absence of spatacsin function may also deregulate lysosomal protein machinery implicated in lipid egress, which remains to be identified, possibly through a disturbance in mem-brane-trafficking, which is altered in SPG11 cells (Perez-Branguli et al., 2014).
Regardless of the molecular mechanism involved, the loss of spatacsin function resulted in the presence of fewer lipid droplets. Changes in lipid droplet metabolism have been reported for other pro-teins associated with the physiopathology of HSP, such as spastin, atlastin1, REEP1 and spartin (Falk et al., 2014; Klemm et al., 2013; Papadopoulos et al., 2015; Renvoise et al., 2016; Renvoise et al., 2012). It would be informative to investigate whether the changes in lipid droplet number or size reflect changes in lysosome-mediated lipid traf-ficking in these models, as in the Spg11−/−mouse model. Proteins
linked to the biogenesis of lipid droplets were identified as neurotoxic-ity modifiers associated with VAPB, a gene mutated in ALS8 (Sanhueza et al., 2015). It would be worthwhile to investigate whether lysosomal function and lipid droplet metabolism are also altered in various ALS mouse models to better understand the overlap between SPG11/ALS5 and typical ALS pathology.
In conclusion, the Spg11−/−mouse model presented here reca-pitulates the full set of symptoms observed in human HSP, CMT and juvenile-onset ALS and is therefore a good model to investigate the mechanisms underlying their physiopathology. Examination of the cellular alterations observed in this model suggests that the loss of spatacsin function alters lipid metabolism in lysosomes. Our study therefore links two of the main themes, lysosome dysfunction and lipid metabolism, that are recurrent in the function of proteins encoded by the numerous genes associated with HSP and opens common avenues of research for future therapy linked to lipid turnover.
4. Methods
4.1. Generation and breeding of Spg11 knockout mice
Spg11-knockout mice were generated as previously described (Schnutgen et al., 2003). The gene targeting vector was constructed by inserting a fragment corresponding to mouse exon 32 to exon 34 (sv129 genetic background) into intron 34 in an inverse orientation, with c.6052CNT and c.6061CNT substitutions in exon 32 (Fig. 1A). MCI-129Sv/Pas ES cell lines were transfected with the resulting con-struct and screened by Southern blotting and PCR. Homologous recom-binant clones were injected into blastocysts. Chimeric mice were mated with C57BL/6 females to obtain germline transmission. The Neo selec-tion cassette was removed by crossing with aflp-expressing mouse. The ubiquitous insertion of exon 32-bearing stop mutations was achieved by crossing the mice with a line expressing Cre recombinase under the control of the CMV promoter. Heterozygous mice were then backcrossed with C57BL/6N mice for 10 generations.
Genotyping was performed by PCR with the 5′GCCAAGGTATGCACCA GACGGGG3′ and 5′TCCTGCCCTTCACCACGTCAGG3′ primers. PCR prod-ucts of 493 and 434 bp were obtained for the invalidated and wild-type alleles, respectively. Mice were housed in same-sex groups and main-tained on a 12-h light/12-h dark cycle with unrestricted access to food and water.
4.2. Behavioral evaluation
At least 10 animals per genotype and per age were tested. All behav-ioral procedures were performed between 8:00 a.m. and 1:00 p.m. Bias was minimized by randomly testing mice in experimental cohorts, re-gardless of their genotype. The treadmill test was performed with an ap-paratus consisting of a plastic chamber containing a 4 × 16 cm treadmill (CleverSys). The mice were tested individually at a controlled speed of 10 cm·s−1. After a 1-min habituation phase, the gait of the mice was re-corded for 20 s (80 frames per s, BCam). Gait was analyzed using GaitScan software (CleverSys). The motor deficit was also evaluated with a Rotarod apparatus (accelerating model LE8200, Bioseb). Mice were placed on the accelerating rod at a starting speed of 4 rpm. The final speed of 40 rpm was reached within 5 min. Mice were tested on two consecutive days, infive trials per day, with an interval of 15 min between trials. The duration for which they were able to remain on the rod was recorded.
Cognitive function was monitored using the Y-maze and fear condi-tioning tests. The Y-maze consists of three transparent arms of equal length separated by the same distance (40 cm long, 20 cm high, 10 cm wide, 120°). Visual cues are placed in the room. One arm of the maze (arm B) was blocked by a removable opaque partition and the mice were placed individually in the starting arm (arm A) of the apparatus facing the center of the maze. The mouse was allowed to walk freely into the maze. When it arrived at the end of the open arm (arm C), the partition was put in place retaining the mouse. After 1 min, the mouse was immediately placed in the starting arm again (arm A), and
Fig. 6. Loss of spatacsin leads to spinal motor neuron degeneration and amyotrophy. (A and B) ChAT (red; spinal motor neuron marker) immunostaining of lumbar spinal cord slices of Spg11+/+
(A) and Spg11−/−(B) mice at 16 months of age. Scale bars: 50μm. (C–F) Quantitative analysis of the total number (C) and cell body area (D–F) of motor neurons per ventral horn in the lumbar spinal cord of Spg11+/+, Spg11+/−and Spg11−/−mice at 4, 8, and 16 months of age. Knockout mice displayed fewer large spinal motor neurons than controls from eight
months. (n≥ 5 slices/animal and n ≥ 10 animals/genotype/age; Kruskal-Wallis test; **p ≤ 0.01 and ***p ≤ 0.001). (G–I) Neuromuscular junction labeling with α-bungarotoxin (Red, postsynaptic marker) and anti-neufilament plus anti-synaptophysin antibodies (green, presynaptic markers), representing a normal Pretzel-like plaque (G) and abnormal fragmented plaques (H and I). Scale bars: 10μm. (J) Neuromuscular junction (NMJ) surface-area in the soleus of Spg11+/+
, Spg11+/−, and Spg11−/−mice at eight and 16 months of age. (n≥ 200 NMJ/animal and n≥ 5 animals/genotype/age; Kruskal-Wallis test; *p ≤ 0.05; **p ≤ 0.01). The NMJ surface-area of Spg11−/−mice was significantly less than in control mice. (K)
Percentage of fragmented NMJ in the soleus of Spg11+/+
, Spg11+/−, and Spg11−/−at 8 and 16 months of age. (n≥ 200 NMJ/animal and n ≥ 5 animals/genotype/age; Kruskal-Wallis test; *p≤ 0.05). Spg11−/−mice exhibited a higher percentage of fragmented neuromuscular junctions than control mice. (L and M) Hematein/Eosin-stained transverse slices of the
medial part of the Spg11+/+(L) and Spg11−/−(M) soleus at 16 months of age. Scale bars: 400μm. (N and O) Total number (N) and cross-section area (O) of soleus myofibers from
Spg11+/+
, Spg11+/−, and Spg11−/−mice at eight and 16 months of age (n≥ 3 muscle slices/animal and n ≥ 5 animals/genotype/age; Kruskal-Wallis test; *p ≤ 0.05). (P) Grip test. Spg11−/−mice showed a significant loss of muscular strength in both forelimbs and hindlimbs from 12 months of age compared to control mice (n ≥ 12 animals/genotype/age; Kruskal-Wallis test; **p≤ 0.01 and ***p ≤ 0.001).
the partition was removed to offer two choices. Alternation was defined as spontaneous entry into the unvisited arm (arm B). On the contrary, re-entry into the already explored arm (arm C) was considered to be an error. Contextual fear conditioning was performed in a Plexiglas chamber (17 × 17 × 25 cm) placed in a sound-attenuating box (Fear Conditioning Systems Series 46000, Ugo Basile SRL Comerio Italy). The
walls of the chamber are covered by a removable checkerboard context. The bottom of the chamber is composed of a stainless steel gridfloor (rods were 2 mm in diameter and spaced 1 cm apart) connected to a scrambled shock generator. Training was initiated by placing the mice in the training context and the freezing baseline was scored during thefirst 120 s. Then, two electric shocks (2 s, 0.62 mA spaced by 60 s)
Fig. 7. Accumulation of autofluorescent particles colocalised with Lamp1 in cortical motor neurons of Spg11−/−mice. (A) Lamp-1 (magenta; lysosome marker) immunostaining and
autofluorescent material (green) in Spg11+/+
and Spg11−/−cortical motor neurons from six-week and eight-month-old animals. Confocal microscopy images show autofluorescent particles surrounded by Lamp-1-positive staining in Spg11−/−neurons. Scale bars: 10μm. (B) p62 (magenta) immunostaining and autofluorescence (green) in Spg11+/+and
Spg11−/−cortical motor neurons at six weeks, eight months, and 16 months of age. Confocal microscopy images show autofluorescent particles colocalizing with p62-positive staining only in the cortical motor neurons of 16-month-old Spg11−/−mice. Scale bars: 10μm. (C) Western blot showing levels of LC3I, LC3-II, and tubulin in extracts from Spg11+/+
and Spg11−/−mouse cortices taken from animals of different ages. Quantification of LC3-II band intensities normalized against tubulin levels. The graph shows the mean ± SEM values. n = 3 independent samples.
were delivered under the control of AnyMaze software. The end of the training session consisted of a 120 s period during which freezing was recorded. Contextual fear conditioning was tested 24 h after training by returning mice to the training chamber and scoring freezing for 180 s without electrical shocks.
Muscle strength was recorded with a grip test system (Dual Sensor 1027CD-M, Colombus, Linton Instrumentation). When the animal firm-ly gripped the triangular metal rod, the experimenter gentfirm-ly pulled its tail horizontally until the animal released its hold. The maximum trac-tion force (mN) developed by the forelimbs and hindlimbs was recorded.
4.3. Antibodies
Antibodies used in the study were: rabbit anti-spatacsin (Protein Tech, directed against aa 2094–2443 of human spatacsin); rabbit anti-spastizin (Murmu et al., 2011); mouse anti-α-tubulin (Abcam); mouse anti-NeuN (Millipore); rabbit anti-GFAP (DAKO); monoclonal mouse anti-Calbindin, 1:300, (Swant); goat anti-Choline acetyltransfer-ase (ChAT), 1:500, (Millipore); rabbit anti-Neurofilament-L, 1:100, (Millipore); mouse Alexa Fluor® 488 conjugated anti-Synaptophysin, 1:25, (Millipore); rat anti-Lamp1 (Clone 1D4B), mouse anti-p62 (Abcam); rabbit anti-LC3 (Novus Biologicals); goat anti-caspase-3
Fig. 8. Loss of spatacsin promotes the accumulation of lipids in lipofuscine-like structures in neurons. (A) Electron micrographs of cortical neurons from Spg11+/+
and Spg11−/−mice at two or 16 months. Red lines indicate the plasma membrane of neurons. Arrowheads indicate low-density structures consistent with lipid droplets. Scale bars: 5μm (upper panels) and 1μm (lower panels). (B) Electron micrographs of spinal cord motor neurons from two-month old Spg11+/+
and Spg11−/−mice. Red lines indicate the plasma membrane of motor neurons. White squares indicate the zone shown at higher magnification in the insets. Scale bars: 5 μm. (C) Cathepsin D immunoelectron microscopy revealed with diaminobenzidine (DAB), showing the presence of DAB precipitates in lipofuscin-like structures (red arrowheads). Note the presence of DAB precipitates in a lysosome (red arrow). Asterisks indicate low-density structures compatible with lipid droplets. Scale bar: 500 nm. (D) Electron microscopy images of cortical neurons in the brain of an SPG11 patient (duration of disease: 10 years; age at death: 32 years), showing the accumulation of lipofuscin (arrowheads). The patient had the typical clinical features of SPG11 and carried, in trans, the heterozygous mutations c.2358_2359delinsTT (p.Glu786_Gly787delinsAspfs*) in exon 13 and c.4868delT (p.Leu1623Tyrfs*17) in exon 28. Post-mortem delay was 48 h, explaining the presence of vacuoles in the tissue. Scale bar: 2μm.
(Millipore). For immunoblotting, the secondary antibodies were conju-gated to horseradish peroxidase (Jackson Laboratories) or fluoro-chromes (IR-dye 800 or IR-dye 680; LI-COR). Secondary antibodies used for immunofluorescence were purchased from Life Technologies. 4.4. Histological and immunohistochemical analyses
Mice were anesthetized by the intraperitoneal injection of 1/6 2% xylazine (Rompun), 1/3 ketamine (10 mg·ml−1, Imalgen 1000) in phosphate-buffered saline (PBS) and were subjected to intracardiac perfusion of 4% paraformaldehyde in PBS.
For immunostaining analysis, the brains and spinal cords were dis-sected and post-fixed by incubation for 24 h in 4% paraformaldehyde and 24 h in 30% sucrose PBS. Slices (20μm for brain and 40 μm for lumbar spinal cord) were cut on a freezing microtome (Microm HM450, Thermo Scientific) and maintained in 0.02% sodium azide in PBS at 4 °C. After 90 min incubation in blocking solution, sections were incubated with pri-mary antibodies in 2% BSA/0.25% Triton X-100 in PBS overnight at 4 °C.
After washing, the sections were incubated with the secondary antibod-ies for 90 min at room temperature, and mounted in Fluoromount-G mounting medium (Southern Biotechnology). Staining specificity was determined by incubation in the absence of primary antibodies.
Whole-mount preparations of musclefibers were stained for motor endplates with Alexa Fluor® 555-conjugatedα-bungarotoxin 1:500 (Life technologies) and for presynaptic motor nerve terminals with anti-Neurofilament L and anti-Synaptophysin antibodies in 2% BSA/ 0.5% Triton X-100 Glycin 0.15% in PBS 48 h at 4 °C. After washing, the sections were incubated with the secondary antibodies for 60 min at room temperature, and mounted in Fluoromount-G mounting medium (Southern Biotechnology).
For morphological analysis, cervical (C1 to C7) and lumbar (L1 to L5) parts of the spinal cords were placed in 2% glutaraldehyde for 24 h. They were then embedded in EPON resin and 1μm-thin sections were stained with toluidine blue for 1 h.
For muscle typology, soleus muscles were frozen into NEG-50™ (Thermo Scientific) at −60 °C. Transversal sections (10 μm) of the
Fig. 9. Spatacsin loss prevents the egress of lipids from lysosomes in mouse embryonicfibroblasts. (A). Electron micrographs of fibroblasts obtained from Spg11+/+
or Spg11−/−embryos. The inset shows a higher magnification of the lysosomes indicated by the arrowheads. Note the presence of osmiophilic, undigested material in the lysosomes of Spg11−/−cells. (B).
Quantification of lysosome density and the mean number of lysosomes containing undigested material per μm2
. The graph shows the means ± SEM. nN 20 cells in two independent experiments. t-test; ***p≤ 0.001. (C). Lamp1 Immunostaining (green) and Nile red staining (magenta) of primary cultures of mouse embryonic fibroblasts cultured for 0, 2, or 24 h in an amino acid-poor medium (HBSS). After 24 h in HBSS, the Nile red staining was concentrated in lipid droplets. Scale bar: 2μm. (D). Quantification of the colocalization of Nile red staining with the lysosomal marker Lamp1 in cells cultured for 0, 2, or 24 h in an amino acid-poor medium (HBSS). The graph shows the means ± SEM. nN 50 cells in five independent experiments. Two-way ANOVA followed by the Holm-Sidak test; *p≤ 0.05. (E). Quantification of the number and size of lipid droplets. Graphs show the means ± SEM (nN 50 cells in five independent experiments). Two-way ANOVA followed by the Holm-Sidak test; *p ≤ 0.05; ***p ≤ 0.001.
medial part of the muscle were prepared with a Leica CM3050S cryostat and stained with Hematein for 3 min and Eosin for 1 min.
The surface-areas of the brains or brain regions were determined using NDPview software. Counting of cell populations was performed using ImageJ software. Spinal motor neuron, neuromuscular junction, and corticorspinal tract images were collected with a Leica DFC500 cam-era mounted on a Leica DM4000B microscope with 40×, 60× and 100× objectives. Whole spinal cord and muscle Images were obtained with a NanoZoomer 2.0-RS (Hamamatsu) equipped with a 20 × objective. Identical brightness, contrast and colour balance adjustments were ap-plied to all groups. Confocal images were acquired with an Olympus FV-1000 confocal laser scanning microscope, with a 60× objective. Auto flu-orescence was triggered by excitation with a 488 nm laser.
4.5. Cell biology
Mouse embryonicfibroblasts and primary cultures of cortical neu-rons were prepared as previously described (Gautier et al., 2012). Im-munostaining was performed after six days of culture in vitro, as previously described (Murmu et al., 2011). For lipid staining, cells were incubated for 1 h with Nile Red (1μg/ml) in PBS, and then washed three times in PBS. Images were acquired on an inverted Zeiss Axiovert 200 M microscope and processed using Huygens deconvolution soft-ware. ImageJ was used to quantify the colocalization of Nile Red staining with lysosomes. Lipid droplets were stained either with Bodipy 493/503 (Life Technologies) or Nile Red. Their number and size were analyzed using the spot detector of ICY software.
Cathepsin B catalytic activity and lysosomal pH were quantified on an automated ArrayScan XTI apparatus (Thermo-Fisher) using the Gen-eral Intensity Measurement protocol, analyzingN500 cells per well and per set of conditions. Fibroblast detection was facilitated by incubation
with Cell Tracker Deep Red (Life Technologies) in HCSS (0.12 M NaCl, 5.4 mM KCl, 15 mM glucose, 2 mM CaCl2, 0.7 mM MgCl2, 20 mM
Hepes, pH 7.4) for 30 min. Cathepsin B activity was determined with the Magic Red Cathepsin B Assay Kit, according to the manufacturer's in-structions (ImmunoChemistry Technologies). Lysosomal pH was deter-mined by incubating the cells with Lysosensor Green (Life Technologies) in HCSS for 1 h. Fluorescence intensity was compared with that of cells incubated in calibration solutions with a pH ranging from 3.5 to 6. For calibration, cells were incubated for 30 min in 145 mM KCl, 10 mM glucose, 1 mM MgCl2, and 20 mM MES
supple-mented with 5 μM nigericin (Sigma) and 0.25 μM valinomycin (Sigma), with artificial adjustment of the pH. Fluorescence was convert-ed into pH values by curvefitting.
4.6. Electron microscopy
Briefly, mice were anesthetized and sacrificed by intracardiac perfu-sion with a solution of 4% paraformaldehyde in 0.1 M phosphate buffer at pH 7.4. Samples from the frontal cortex and spinal cord werefixed in 1% glutaraldehyde in the same buffer, post-fixed in 2% osmium tetrox-ide, dehydrated, and embedded in Araldite. Ultrathin sections were stained with uranyl acetate and lead citrate and examined by a Hitashi transmission electron microscope. To analyze culturedfibroblasts and neurons, cells werefixed with 2.5% glutaraldehyde in PBS for 2 h at 22 °C. The cells were then post-fixed in 1% osmium tetroxide for 20 min, rinsed in distilled H2O, dehydrated in 50% and 70% ethanol,
in-cubated in 1% uranyl acetate for 30 min, processed in graded dilutions of ethanol (95–100%, 5 min each), and embedded in Epon. Ultrathin (70 nm) sections were cut, stained with uranyl acetate and lead citrate, and analyzed with a JEOL 1200EX II electron microscope at 80 kV.
Fig. 10. Spatacsin loss promotes lipid accumulation in lysosomes in primary cultures of cortical neurons. (A). Electron micrographs of primary cultures of cortical neurons derived from Spg11+/+
or Spg11−/−embryos. The inset shows a higher magnification of the lysosomes indicated by arrowheads. Note the presence of undigested material in the lysosomes of Spg11−/−neurons. Also, note the large number of lysosomes containing undigested material, appearing in black, in Spg11−/−neurons. Scale bar: 2μm. (B). Quantification of the mean number of lysosomes containing undigested material perμm2
. The graph shows the means ± SEM (nN 20 cells). t-test; ***p ≤ 0.001. (C). Lamp 1 immunostaining (green) and Nile red staining (magenta) of primary cultures of cortical neurons. The arrowheads indicate lipid droplets appearing as very bright structures upon Nile red staining. (D). Quantification of the colocalization of Nile red staining with the lysosomal marker Lamp1. The graph shows the means ± SEM (nN 70 cells in four different experiments). t-test; *p ≤ 0.05. (E). Number of lipid droplets per neuron in primary cultures of cortical neurons. The graph shows the means ± SEM (nN 70 cells in four independent experiments). t-test; **p ≤ 0.005.
4.7. Western blot analysis
Cells or tissues were lysed by incubation in 100 mM NaCl, 10 mM Tris HCl pH 7.4, 1 mM EGTA, 2 mM MgCl2, 1% SDS, and Halt™ Protease
Inhibitor Cocktail (Thermo Scientific) for 5 min at room temperature. Western blotting was performed as described previously (Esteves et al., 2014). Signals were visualized with a chemiluminescence substrate (SuperSignal West Dura), or acquired with an Odyssey ClX (Li-COR). Signal intensities were quantified using ImageJ software.
4.8. Statistics
All values are displayed as the means ± SEM within each group. A Kolmogorov–Smirnov normal distribution analysis was first performed on all data. Data sets were compared using the Kruskal–Wallis test for nonparametric data sets and the 2-tailed Student's t-test for parametric data sets (Systat version 8.0; SPSS Inc., Chicago, IL, USA). For cellular ex-periments, two-way ANOVA followed by the Holm Sidak test was used to analyze differences between genotypes at different time points. A p value of 0.05 or less was considered to be statistically significant. 4.9. Study approval
The care and treatment of animals followed the N° 2010/63/UE Eu-ropean legislation and national authority (Ministère de l'agriculture, France) guidelines for the detention, use, and ethical treatment of labo-ratory animals. All the experiments were approved by the local ethics committee (Ce5/2012/045 approval number) and experiments were conducted by authorized personnel. Patient-derived material was ob-tained through procedures approved by the ethics committee with the written, informed consent of the family (approval SST04/11/04052011). Conflict of interest
The authors have declared that there is no conflict of interest. Author contributions
Conceived and designed the experiments: JB, MB, MDu, AB, KHEH, GS, FD.
Performed the experiments: JB, MB, LS, MDe, CL, AC, MV, TE, RM, MPM, FMS, KHEH, FD.
Analyzed the data: JB, MB, LS, MDe, CL, AC, MV, TE, RM, KHEH, FD. Wrote the paper: JB, GS, FD.
Acknowledgments
We are grateful to the Institut de la Clinique de la souris (ICS)/ Phenomin for the generation of the mouse model presented here. We thank the behavior core facility of the ICM and the Plateforme d'Imagerie Cellulaire de la Pitié-Salpêtrière for their contributions. This work benefited from equipment and services from the CELIS cell culture core facility. We also thank Merle Ruberg for critical reading of the man-uscript, Agnès Rastetter, Annick Prigent, and Marie Coutelier for their help and Alexandra Durr for discussions. The 1D4B monoclonal anti-body developed by August J. Thomas was obtained from the Develop-mental Studies Hybridoma Bank, created by the NICHD of the NIH and maintained at The University of Iowa, Department of Biology, Iowa City, IA 52242. This study benefited from the program “Investissements d'avenir” ANR-10-IAIHU-06 and ANR-11-INBS-0011-NeurATRIS (Trans-lational Research Infrastructure for Biotherapies in Neurosciences), and was funded by the Verum Foundation [SPATAX to A.B. and G.S.], the French Agency for Research ANR [13-ISV1-00002 to G.S], the GIS-Mala-dies Rares Foundation [06/GIS/PB/SJ/n°71 to G.S.], the Fondation Roger de Spoelberch (to A.B.), the Action Ponctuelle of the Ecole Pratique des Hautes Etudes (to K.H.H.), and the European Union with the ANR (to
A.B., Seventh Framework Programme - FP7, Neuromics [FP7-2012-305121]; to G.S., ERARE programme, Neurolipid [ANR-13-ERARE-0003-02]) and the European Research Council [ERC, Starting grant No 311149 to F.D.]. M.B. received a fellowship from the French Ministry of Research (doctoral school ED3C).
Appendix A. Supplementary data
Supplementary data to this article can be found online athttp://dx. doi.org/10.1016/j.nbd.2017.02.007.
References
Anheim, M., et al., 2009.SPG11 spastic paraplegia. A new cause of juvenile parkinsonism. J. Neurol. 256, 104–108.
Chang, J., et al., 2014.Spastic paraplegia proteins spastizin and spatacsin mediate autoph-agic lysosome reformation. J. Clin. Invest. 124, 5249–5262.
Daoud, H., et al., 2012.Exome sequencing reveals SPG11 mutations causing juvenile ALS. Neurobiol. Aging 33 (839), e5–e9.
Denora, P.S., et al., 2016.Motor neuron degeneration in spastic paraplegia 11 mimics amyotrophic lateral sclerosis lesions. Brain.
Esteves, T., et al., 2014.Loss of association of REEP2 with membranes leads to hereditary spastic paraplegia. Am. J. Hum. Genet. 94, 268–277.
Falk, J., et al., 2014.Functional mutation analysis provides evidence for a role of REEP1 in lipid droplet biology. Hum. Mutat.
Gautier, C.A., et al., 2012.Regulation of mitochondrial permeability transition pore by PINK1. Mol. Neurodegener. 7, 22.
Greenspan, P., et al., 1985.Nile red: a selectivefluorescent stain for intracellular lipid droplets. J. Cell Biol. 100, 965–973.
Hanein, S., et al., 2008.Identification of the SPG15 gene, encoding spastizin, as a frequent cause of complicated autosomal-recessive spastic paraplegia, including Kjellin syn-drome. Am. J. Hum. Genet. 82, 992–1002.
Harding, A.E., 1983.Classification of the hereditary ataxias and paraplegias. Lancet 1, 1151–1155.
Hehr, U., et al., 2007.Long-term course and mutational spectrum of spatacsin-linked spas-tic paraplegia. Ann. Neurol. 62, 656–665.
Hirst, J., et al., 2013.Interaction between AP-5 and the hereditary spastic paraplegia pro-teins SPG11 and SPG15. Mol. Biol. Cell 24, 2558–2569.
Hughes, R.N., 2004.The value of spontaneous alternation behavior (SAB) as a test of re-tention in pharmacological investigations of memory. Neurosci. Biobehav. Rev. 28, 497–505.
Khundadze, M., et al., 2013.A hereditary spastic paraplegia mouse model supports a role of ZFYVE26/SPASTIZIN for the endolysosomal system. PLoS Genet. 9, e1003988.
Klemm, R.W., et al., 2013.A conserved role for atlastin GTPases in regulating lipid droplet size. Cell Rep. 3, 1465–1475.
Menzies, F.M., et al., 2015.Compromised autophagy and neurodegenerative diseases. Nat. Rev. Neurosci. 16, 345–357.
Mizushima, N., et al., 2004.In vivo analysis of autophagy in response to nutrient starva-tion using transgenic mice expressing afluorescent autophagosome marker. Mol. Biol. Cell 15, 1101–1111.
Montecchiani, C., et al., 2016.ALS5/SPG11/KIAA1840 mutations cause autosomal reces-sive axonal Charcot-Marie-Tooth disease. Brain 139, 73–85.
Murmu, R.P., et al., 2011.Cellular distribution and subcellular localization of spatacsin and spastizin, two proteins involved in hereditary spastic paraplegia. Mol. Cell. Neurosci. 47, 191–202.
Orlacchio, A., et al., 2010.SPATACSIN mutations cause autosomal recessive juvenile amyo-trophic lateral sclerosis. Brain 133, 591–598.
Papadopoulos, C., et al., 2015.Spastin binds to lipid droplets and affects lipid metabolism. PLoS Genet. 11, e1005149.
Perez-Branguli, F., et al., 2014.Dysfunction of spatacsin leads to axonal pathology in SPG11-linked hereditary spastic paraplegia. Hum. Mol. Genet. 23, 4859–4874.
Puech, B., et al., 2011.Kjellin syndrome: long-term neuro-ophthalmologic follow-up and novel mutations in the SPG11 gene. Ophthalmology 118, 564–573.
Rambold, A.S., et al., 2015.Fatty acid trafficking in starved cells: regulation by lipid droplet lipolysis, autophagy, and mitochondrial fusion dynamics. Dev. Cell 32, 678–692.
Renvoise, B., et al., 2012.Spg20−/− mice reveal multimodal functions for Troyer syn-drome protein spartin in lipid droplet maintenance, cytokinesis and BMP signaling. Hum. Mol. Genet. 21, 3604–3618.
Renvoise, B., et al., 2014.Lysosomal abnormalities in hereditary spastic paraplegia types SPG15 and SPG11. Ann. Clin. Transl. Neurol. 1, 379–389.
Renvoise, B., et al., 2016.Reep1 null mice reveal a converging role for hereditary spastic paraplegia proteins in lipid droplet regulation. Hum. Mol. Genet.
Sagona, A.P., et al., 2010.PtdIns(3)P controls cytokinesis through KIF13A-mediated re-cruitment of FYVE-CENT to the midbody. Nat. Cell Biol. 12, 362–371.
Sanhueza, M., et al., 2015.Network analyses reveal novel aspects of ALS pathogenesis. PLoS Genet. 11, e1005107.
Schnutgen, F., et al., 2003.A directional strategy for monitoring Cre-mediated recombina-tion at the cellular level in the mouse. Nat. Biotechnol. 21, 562–565.
Siri, L., et al., 2010.Cognitive profile in spastic paraplegia with thin corpus callosum and mutations in SPG11. Neuropediatrics 41, 35–38.
Slabicki, M., et al., 2010.A genome-scale DNA repair RNAi screen identifies SPG48 as a novel gene associated with hereditary spastic paraplegia. PLoS Biol. 8, e1000408.
Stevanin, G., et al., 2006.Spastic paraplegia with thin corpus callosum: description of 20 new families, refinement of the SPG11 locus, candidate gene analysis and evidence of genetic heterogeneity. Neurogenetics 7, 149–156.
Stevanin, G., et al., 2007.Mutations in SPG11, encoding spatacsin, are a major cause of spastic paraplegia with thin corpus callosum. Nat. Genet. 39, 366–372.
Stevanin, G., et al., 2008.Mutations in SPG11 are frequent in autosomal recessive spastic paraplegia with thin corpus callosum, cognitive decline and lower motor neuron de-generation. Brain 131, 772–784.
Sulzer, D., et al., 2008. Neuronal pigmented autophagic vacuoles: lipofuscin, neuromelanin, and ceroid as macroautophagic responses during aging and disease. J. Neurochem. 106, 24–36.
Vantaggiato, C., et al., 2013.Defective autophagy in spastizin mutated patients with he-reditary spastic paraparesis type 15. Brain 136, 3119–3139.
Varga, R.E., et al., 2015.In vivo evidence for lysosome depletion and impaired autophagic clearance in hereditary spastic paraplegia type SPG11. PLoS Genet. 11, e1005454.