HAL Id: hal-00019785
https://hal.archives-ouvertes.fr/hal-00019785
Preprint submitted on 27 Feb 2006
HAL is a multi-disciplinary open access archive for the deposit and dissemination of sci-entific research documents, whether they are pub-lished or not. The documents may come from teaching and research institutions in France or abroad, or from public or private research centers.
L’archive ouverte pluridisciplinaire HAL, est destinée au dépôt et à la diffusion de documents scientifiques de niveau recherche, publiés ou non, émanant des établissements d’enseignement et de recherche français ou étrangers, des laboratoires publics ou privés.
Space charge behaviour in an epoxy resin: the influence
of fillers, temperature and electrode material
Olivier Gallot-Lavallée, G. Teyssedre, C. Laurent, S. Rowe
To cite this version:
Olivier Gallot-Lavallée, G. Teyssedre, C. Laurent, S. Rowe. Space charge behaviour in an epoxy resin: the influence of fillers, temperature and electrode material. 2006. �hal-00019785�
Space charge behaviour in an epoxy resin:
the influence of fillers, temperature and electrode material
Short title: Space charge in an epoxy resin
O. Gallot-lavallée 1*, G. Teyssedre 1, C. Laurent 1 and S. Rowe 2
1
Laboratoire de Génie Electrique de Toulouse, Université Paul Sabatier - 118, route de Narbonne, Toulouse, 31062, France
2
Direction des Recherches Matériaux, Schneider Electric SA - 20, Rue Henri Tarze, Grenoble, 38050, France
* E-mail : olgl@free.fr
PACS Numbers:
72.20.-i : Conductivity phenomena in semiconductors and insulators 72.80.sk : Insulators
43.58.+z : Acoustical measurements and instrumentation
Abstract:
This study has the aim to characterize the behaviour of the space charge in an epoxy resin used as electrical insulation in systems such as transformers and bus bars. Temperature, field level, filler content and nature of the electrodes are the parameters that were considered. Space charge measurements were performed using the Pulsed Electro Acoustic technique (PEA), in a range of field and temperature up to 40kV/mm and 72°C, respectively, on gold-coated and uncoated samples. We discuss the possibility of performing space charge measurement on filled epoxy resin despite the piezoelectricity of quartz fillers. Under DC field we observed a quasi-symmetrical build-up of homocharges at both electrodes, followed by a substitution of the homocharges by heterocharges, mainly close to the cathode. In addition, we recorded the space charge behaviour just before breakdown on filled sample at 72°C under 12kV/mm.
1. Introduction
Epoxy resins are widely used as electrical insulation in electrical engineering applications such as transformers, bus bars, electrical machines and so on (Dakin 1974). To illustrate the kind of stress to which such insulation may be subjected, consider the application targeted for the material investigated in this work. The resin is a DiGlycidyl Ether of Bisphenol A (DGEBA) - based epoxy used as solid insulation in three-phase transformers made of coated windings. These distribution transformers cover a broad range of power going from 160 kVA to 15 MVA, with a service voltage going up to 36kV. The bulk insulation consists of an epoxy resin including active filler moulded under vacuum. Local field values can be higher than 2kV/mm. During the nominal operation of the system, the insulator is brought uninterruptedly up to a temperature of 130°C with hot points up to 155°C. At these temperatures the epoxy is in a rubber-like state, since its glass transition temperature is about 65°C. Also, high temperatures combined with thermal cycling may lead to particularly alarming atmospheric oxidation (Le Huy et al. 1992).
In spite of the fact that epoxy is by no way a new material, very little is known about electrical ageing in this kind of dielectric. Published reports focussed on the effect of partial discharges and electrical treeing (Champion and Dodd 1995, Champion et al. 1996), but there is comparatively scarce data on the possible influence of internal space charges generated by the thermo-electric stress itself (Guillermin et al. 2004, Griseri et al. 2002, Iisuka et al. 1999). Conclusions of these investigations converge towards consistent results, picturing essentially injection of homocharge close to the electrodes. In addition, Iisuka et al. have notably shown that moisture conditioning of epoxy sample could lead to the development of heterocharges. But to date there is no general report taking into account filled/unfilled epoxy, temperature, field level and stressing time altogether.
In the perspective where charge transport and trapping combined with thermal stresses could drive ageing phenomena (Laurent et al. 1997), we have set-up a project aiming at characterising space charge, conduction and electroluminescence measurements (Gallot-lavallée et al. 2004a). The present report focuses on space charge results as a function of field, temperature and filler content. The influence of the electrodes and dipolar response effects are also considered.
2. Materials and measurement technique
2.1 Samples
Within the framework of this study, we focused on one type of epoxy resin with and without mineral fillers. The material is a mixture with proportions in weight as follows: 100 parts of base resin CY225 (Diglycidyl ether of bisphenol A), 100 parts of hardener HY227 (Methyltetrahydrophtalic anhydride + flexibiliser di-ester di-acide) and 0.6 parts of catalyzer DY062 (N,N-Dymethylamine). These are Huntsman (ex Ciba Geigy) references. For composites, 300 parts of SiO2 filler are added (60
wt.% SiO2). The epoxy resin, obtained after 16h of curing at 100°C, has a glass transition temperature
(Tg) of 65°C. Moulded specimens have a thickness of about 500 µm (+/- 10 µm) and a diameter of 110mm. One series of samples was gold-coated by sputtering providing circular electrodes (0.56cm2 area and 300Ǻ thickness). The other series was not metallized, and hence electrodes were those of the PEA system. The sound velocity of this kind of sample is around 2400m/s.
The quartz (SiO2) filler dispersed in composite samples is a powder with an average grain size
of 60µm and a relatively wide distribution, since their diameter can be as high as 160µm. Figure 1 shows a scanning electron microscope (SEM) picture of the powder which illustrates the wide dispersity of particle size and shape. Note finally that these particles are known to be piezoelectric (Holé et al. 2004).
2.2 Space charge measurement
Space charge measurements were achieved with the pulsed electro acoustic (PEA) technique (Maeno 1999). The electrodes of our PEA test bench are made of aluminium for the electrode close to the acoustic sensor (to the right in space charge profiles presented in the following) and a polymer filled with carbon black for the other electrode. The effective surface of probing S is about 0.5cm2 (sensor size). The amplitude of the PEA pulse source was set to 300 V, giving a pulse field of 0.6kV/mm. We use a classical referencing procedure to eliminate the unknown transfer function of the piezoelectric sensor and related electronics (Gallot-lavallée et al. 2005). For that we consider a sample free from bulk charges to which a constant voltage U is applied for a short time. Referencing also integrates physical parameters (permittivity, thickness, applied voltage) for the reference sample, and sound velocity for the sample under test. In our case, referencing was achieved on the test sample, prior to any stressing.
Space charge measurements were carried out in air within a thermostated oven, without control of the hygrometry, at temperatures of 24°C and 72°C, i.e. below and above Tg of the epoxy. The DC stress cycle consisted of polarization / relaxation steps for fields from 4kV/mm up to 40kV/mm. We used short time stressing as 10min on / 10min off, as well as relatively longer ones, 1hour on / 1hour off, with a time interval of 20s between each space charge profile acquisition. In this paper 0V and Volt off indicate a PEA measurement made with the electrodes shorted (relaxation), tp is the
polarization time, i.e. the time for which the voltage was applied and tr is the relaxation time, i.e. the
time for which the sample electrodes were shorted before a measurement was made. Note lastly that the response of the PVDF sensor changes with temperature. Therefore we performed signal referencing at each temperature value.
3. Influence of metallization and study of orientational polarization
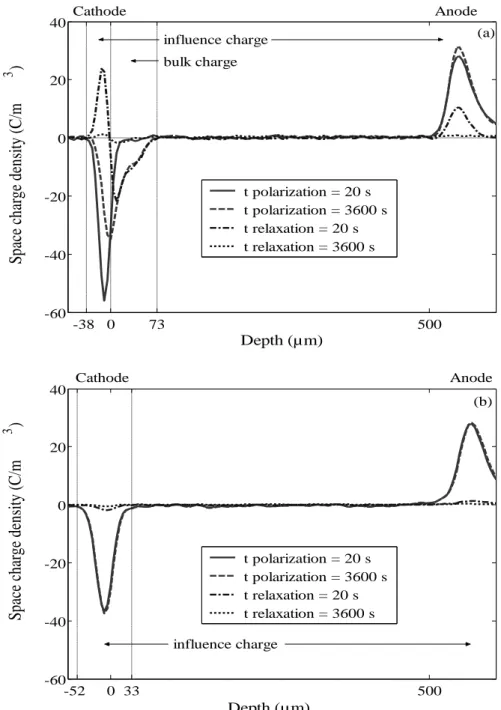
Gold coated and un-coated samples were polarised for 1 hour at 40kV/mm, then short-circuited for 1 hour. Figure 2 shows profiles obtained at the beginning and end of the polarization and relaxation steps. At the beginning of relaxation, negative bulk charge with its corresponding image charge are clearly revealed to the left-hand part of Figure 2 (a) (i.e. around cathode), for the un-coated sample. Dipolar polarization (P), due to either field-induced molecular dipoles or permanent dipoles, and absolute electric displacement (0E) are the two contributions to the total polarization charge D,
i.e. D=P+0E. Note that orientational polarization processes may be slow, providing a time-dependent
response at the time scale of our experiments. Polarization charge seems to dominate at short polarization time, whereas growth of negative charge (homocharge) is evidenced at long polarization time at the cathode of Figure 2. (a). The build-up of bulk charge is necessarily accompanied by the appearance of corresponding image charges on the electrodes. Hence, the influence charge, that is the charge actually measured on the electrodes and which results from the superposition of polarization charge and image charge, decreases with polarization time due to the build-up of negative homocharge. Under short-circuit, it appears that polarization charge decreases faster than image charge since the signal in the first 20s of relaxation appears dominated by the image charge (reflecting bulk charge). For the metallized sample, Figure 2 (b), the behaviour is quite different, since no space charge is apparent. Regarding the signal on the anode side, there is no evidence of homocharge accumulation, in either kind of sample.
In a general way, the definition of specific regions in space charge profiles as for example the position of the electrodes, or the limits of a charged zone, are uncertain due to signal spreading. This degradation has several origins such as the inhomogeneous acoustic dispersion in the material, the limitation in the resolution relative to the discrete acquisition (500 MHz rate of the oscilloscope used) and the spectral degradation during the numerical processing (relative to Gauss and Wiener filter functions). Gauss and Wiener functions are aimed at limiting the frequency range of the signal spectrum and avoiding division by zero in the Fourier space, respectively [Jeroense 1997]. The effect of Gaussian filter processing on space charge spreading is modelled in (Gallot-lavallee and Teyssèdre 2004b). In spite of this, we have tentatively separated bulk and electrode charged regions by vertical lines, referring to the first profile recorded during relaxation. In Figure 2 (a) the transition region is defined arbitrarily as the point at which the charge density is null in depolarization. For this specific case, the separation method probably leads to an underestimation of both the bulk charge and influence charge since the responses overlap for the reasons explained above. There is however no simple way to separate the two contributions, especially as the bulk charge is close to the electrode.
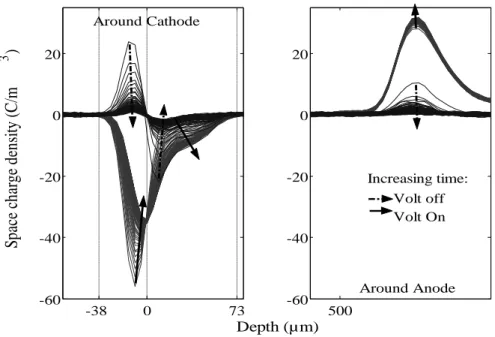
In Figure 3, the whole set of profiles obtained in 20s intervals on the un-coated sample is shown thus allowing the kinetics of charge build-up to be followed. On the cathode side, all profiles exhibiting a negative influence charge were obtained during polarization. Those exhibiting a positive influence charge correspond to the relaxation. In the neighbourhood of the cathode, we observe that the amplitude of the influence charge in Volt-on decreases with time and the position of the maximum moves towards the bulk with time, as a consequence of homocharge accumulation. In Volt-off, the polarization charge decreases quickly and hence the influence charge is essentially the image of bulk charges, whatever the time. The bulk charge is very small after one hour of relaxation.
Concerning what happens in the neighbourhood of the anode, the situation is not as clear as around the cathode. The influence charge grows during polarization and decays quickly during relaxation. The most likely scenario would be that no injection takes place, so that what we observe is just the effect of a slow polarization process (due to permanents dipoles) and perhaps a weak contribution of the image of the negative homocharge. The second scenario would be that the effective degradation of the resolution of the PEA signal in respect to the distance to the sensor smoothes the bulk and influence charge (the right side of profiles is the furthest from the sensor). Thus the absence of significant signal on the anode side could be due either to a lack of injection from this electrode, or to degradation of the resolution.
If the charge is enough confined on the respective electrodes, then we can separate bulk charge, influence charge and polarization contributions to the PEA signal. First we have to write a simplified relation between the bulk charge (QbK) and the related image charge (QimK), the index K referring to
the cathode:
K K Qim
Qb (1)
The influence charge, QiK, is a superposition of the image charge, QimK and of the polarization
charge QpK as:
K K
K Qp Qim
Qi (2)
The access to the polarization processes from the space charge profiles then becomes possible considering the relation:
K K K Qi Qb
Qp (3)
We have integrated the net charge, for each of the regions bounded by dotted lines in Figure 2. The dynamics of build-up and relaxation of the charge is represented in Figure 4 for the cathode region of the un-coated sample. We notice that the variations of charge are important in the first moments of the application of the stress or after the short circuit. These variations become much slower after 20 minutes. This is visible in an almost symmetric way for the influence charge and the bulk charge in Figure 4, thus revealing that the variation in influence charge is primarily due to the build-up of the injected charge (weak contribution of dipolar polarization).
In Figure 5, we compare the polarization contribution between the gold-coated and the un-coated sample. In the case of un-un-coated sample, QpK was obtained according to relation (3), while in
the case of gold-coated sample the processing was direct. We observe that the polarization increases during the time under stress, which appears consistent with a phenomenon of slow polarization of the material. We also observe in Figure 5 that the relaxation transient of the un-coated sample is slower than that of the gold-coated one. This could be related to the fact that accumulated space charge could influence dipolar relaxation processes (Wintle 1988).
The other noticeable behaviour is that the polarization level appears lower for the gold-coated sample. This could result from the limits of integration of the charged regions, as well as from the difference of thickness between the two samples (statistically +/-2%).
4. Behaviour of composites under pulsed electrical stimulation
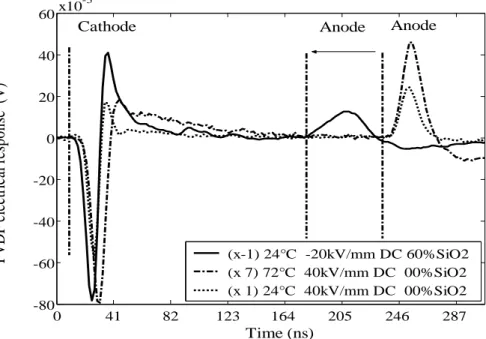
We present in this section specific features of measurements on composites (epoxy filled with 60 wt.% SiO2 ). Figure 6 shows output signals from the PEA system (piezoelectric signal after
amplification) at different applied fields and temperatures.
Increasing temperature from 24 to 72°C leads to a decrease in the acoustic signal by a factor 5 on pure epoxy whereas the sound velocity remains approximately the same as denoted by the same position of the "anode" peaks on the right-hand side of the figure. A small shift in the first peak corresponding to the aluminium electrode ("cathode") is observed, which could be related to thermal expansion of the 1cm-thick aluminium electrode.
The effect of the mineral filler on the sound velocity is clearly revealed by the shift to the left of the "anode" peak as compared to its position in unfilled material. An increase by 15% in the 60 wt.% filled SiO2 sample in respect to pure epoxy can be observed. Finally, the level of polarization is
increased by a factor 3 between a pure epoxy disc and a disc charged at 60 wt.%, whereas the relative permittivity of the filler (SiO2: r=4.34 at 30MHz) is only slightly higher than that of the unfilled
material (Pure epoxy resin: r=3.5 at 1MHz). The multiplication of interfaces due to fillers could also
explain this abrupt increasing of polarization.
Another specific aspect of the epoxy/quartz composite is its piezoelectricity (Holé et al. 2004). We can expect that space charge measurement techniques such as the PEA or the LIPP method (Laser Induced Pressure Pulse) reveal this piezoelectricity either by acoustic impact or by pulsed electric stimulation. Figure 7 shows a series of measurements carried out on a 1000µm-thick test sample constituted by the association of two layers: a 500µm-thick layer of pure epoxy and a 500µm-thick layer of filled epoxy (60 wt.% SiO2). The transmission line of the electric pulses being imperfect,
electromagnetic reflections are generated which imply a succession of electric stimulation of decreasing amplitude instead of a single impulse. The response of the sample to this excitation is a succession of acoustic signals which overlap, due to the fact that the transit of the acoustic signal
within the 1mm-thick sample is longer than the time between two harmonics of the pulse voltage. For example, two harmonics of the anode signal are seen in Figure 7.
We clearly observe the transition between the two materials, through probably an interfacial polarization phenomenon, which is, as expected, dependent on the electric field. Some oscillations are observed on the signal in the bulk of the filled material, and this is best seen in the zoomed area. These oscillations appear independent of the applied DC level in both their position in time and amplitude and are interpreted as the response of the piezoelectric filler according to Holé et al (2004). We could expect some influence of the DC field on this signal considering that it could be perturbed by strong fields, but nothing in this experiment indicates it.
Holé et al. (Holé et al.-04) have already reported that an SiO2-filled sample (standard quartz)
produces oscillatory acoustic waves or an electric induction on the electrodes respectively by electric or acoustic stimulation of the quartz grains contained in the epoxy composite. In other words, the quartz grains (known for their piezoelectricity) embedded in an epoxy resin give rise to a composite with a piezoelectric behaviour.
Insofar as this piezoelectricity seems to depend exclusively on the strength of the mechanical or electric stimulus, the exploitation of the PEA techniques remains possible since the piezoelectric contribution is identifiable.
5. Space charge behaviour versus temperature and electric field
5.1. Space charge in un-filled and filled epoxy
Figure 8 compares space charge profiles obtained on gold-coated (a) and un-coated (b) pure
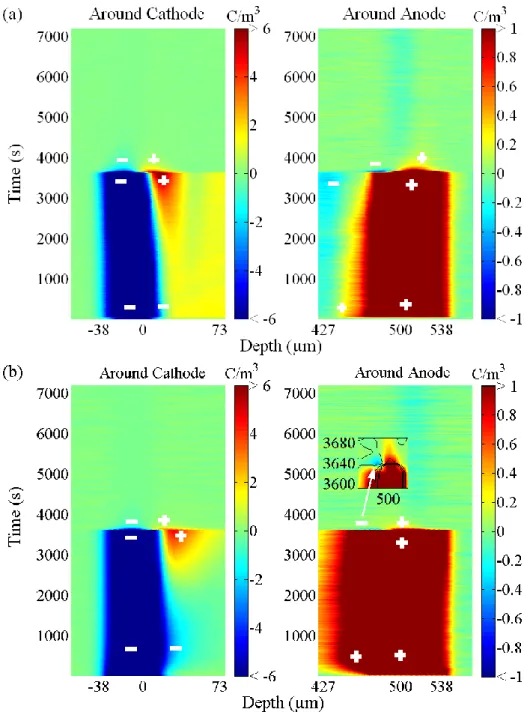
epoxy samples, at 72°C. Profiles were recorded at a frequency of 1/20s, for 1h under 40kV/mm followed by 1h under short-circuit. Because the resolution is improved near the grounded electrode which is the closest to the piezoelectric sensor, results presented for the cathode region were obtained using a positive DC voltage whereas those close to the anode correspond to a negative applied voltage. In the first moments of voltage application, homocharge build up is observed at both anode and cathode. This is particularly evidenced in un-coated samples. Homocharge is subsequently replaced (at both electrode for gold-coated sample and at the cathode for un-coated sample) or mitigated (at the anode for un-coated sample) by space charge of opposite polarity, forming an heterocharge layer or
decreasing the density of homocharge. This is clearly seen after 30min of polarization. The existence of these heterocharges is confirmed by measurements in Volt-off, in which they are the dominant carriers considering either bulk or electrode signal. Relaxation of these heterocharges is effective within some minutes in relaxation.
Figure 9 provides a picture of the behaviour of charges in the bulk of the insulation. The
progression of a front of negative charges from cathode to anode is clearly observed. This means that the negative charge accumulation observed at the anode after some time under stress is potentially due to a drift of injected charges towards the opposite electrode. The apparent velocity of the charge front is relatively low (500µm/h). Such phenomenon was not observed for positive charges. It is however supposed that a similar process holds, with probably a more diffusive transit of charges. Note the accumulation of heterocharge layers at both electrodes in volt-off (Figure 9).
We propose in Figure 10 another form of representation of the results presented in Figure 8 a by considering the time dependence of the influence charges during voltage application. We observe at short time in K (cathode) a reduction in absolute value of the influence charge which is consistent with the development of negative charge in the vicinity of the cathode, then a strong increase of the influence charge explained by the progressive accumulation of the positive charge. Concerning the behaviour at the anode and in a similar way, the slight reduction in the influence charge at short time corresponds to the positive charge accumulation whereas the increase in the influence charge after about 1500s reflects the accumulation of negative charge. Let us note finally that through this analysis, we have underestimated the homocharge concentration since slow polarization, which is likely in epoxy, has an effect (increase of the influence charge) opposite to that of homocharge accumulation.
Figure 11 compares the space charge profiles obtained in pure and filled epoxy 5min after
application of a field of 20kV/mm at room temperature and 20 sec. after volt-off. It can be seen that the same process of homocharge accumulation is evidenced in filled epoxy.
5.2. Effect of temperature and electric field
The results of Figure 11 let us suppose that space charge accumulation is driven by homocharge generation close to the electrodes. Hence, heterocharge build-up would be a consequence of this generation. In order to evaluate the dependence of homocharges accumulation as a function of the applied field and temperature, we applied increasing electric stress by steps of 4kV/mm with 10
min polarization and relaxation (0kV/mm) at each stress value, and so up to a maximum field of 20kV/mm. In this way, we are in a situation where homocharges are the dominant carriers.
Because the homocharge is released very quickly in Volt-off at 72°C, we have estimated the field dependence of homocharge density by considering volt-on profiles and by integrating the charge within the region close to the interface, as defined by dashed lines in Figure 11. The charge thus integrated includes a fraction of the influence charge which represents at most 50% of the total influence charge. We have introduced this upper limit of the contribution from influence charge in
Figure 12 where quantitative results are presented.
Homocharges appear to be detected at low field (4kV/mm) for measurements at 24°C, with however an increasing rate of accumulation at around 10kV/mm. When temperature is increased, less homocharges are accumulated, which could be due to an activated drift of charges in the bulk. Concerning the effect of the filler, conflicting trends are observed in the low field range, depending on temperature. Early breakdown of samples at 72°C did not allow investigating the high field range.
5.3. Space charge behaviour near breakdown
Breakdown of the filled sample at 72°C occurred at a field of 12kV/mm. Interesting features are revealed in space charge profiles just before breakdown as shown in Figure 13. It is clearly shown that homocharges accumulate for a field of 8kV/mm. In the bulk, alternating regions of positive and negative charges are observed, with increasing densities with the applied field. This could correspond to an accumulation of space charge in the interfacial region of SiO2 grains. The important event in this
experiment is observed at field level of 12kV/mm, when accumulation of heterocharges is observed instead of homocharges which tend to disappear. Heterocharges can be considered as harmful in the sense that they reinforce the interfacial field, where breakdown is thought to be initiated.
6. Discussion
A single scenario, depicted in Figure 14, of generation and transport of space charge within the investigated epoxy can be proposed based on the overall space charge measurements carried out on samples, being gold-coated or not, filled or not, and at 24 or 72°C:
(1) A development of positive and negative homocharges would appear systematically under the effect of a relatively weak electric field (4kV/mm with a clear enhancement above 10kV/mm) and whatever the temperature (cf. Figure 12). The nature of the electrode/insulator interface plays an important role in this first phenomenon. Indeed when gold electrodes are deposited on samples, the injection phenomenon is lowered (cf. Figure 8). In this context, we consider the quality of the electrode/sample contact, and the electrode material. Regarding the latter, as far as polyethylene-type insulations were considered, it has been reported in several instances that a semiconducting electrode – i.e. the material used as HV electrode of the PEA system for acoustic impedance adaptation – is much more injecting than a metallic electrode (see e.g. Chen et al. 2001; Fleming et al. 2000). Besides, aluminium electrodes appear to be more efficient for injection than gold electrodes: this has been observed experimentally (Chen et al. 2001) and this is an expected result given the difference in work function for Au (4.70eV) and Al (4.08eV) (Fukunaga et al. 1998). Regarding now the quality of the contact, gold electrodes are in deep contact with the insulation surface since it was deposited by sputtering. For not-metallized samples, films are clamped between the two electrodes so that it is not completely unexpected that microdischarges be generated at the interfaces. In this situation, additional kinetic energy of charges could increase there injection. On the whole, the decrease in charge generation in gold-metallized epoxies is an expected process.
Several literature reports support homocharge injection in epoxy resins. Bipolar injection combined to slow polarization has been reported by Griseri et al. in a somewhat different epoxy resin (2002). Iizuka et al. (Iizuka 1999) have reported a similar behaviour in an epoxy resin, with some effect of relative humidity. Finally Guillermin et al. (2004), who investigated epoxy resins of the same nature as those considered therein, observed bipolar injection by the LIPP method with an enhanced efficiency above 13kV/mm at 55°C.
(2) A slow migration of positives and negatives charges towards the opposite electrodes would lead to the growth of heterocharges, still for both kinds of carriers, with apparently a faster process for positive charges (Figure 10). This growing is possible if associated with partially blocking electrodes. This phenomenon is strongly dependent on temperature, since it was not observed at 24°C.
Once heterocharges have been accumulated, the process may end-up by dielectric breakdown, as observed in filled samples at 72°C (Figure 13). An enhancement of the interface field and therefore of injection could be expected. This phenomenon is most probably favoured by the existence of
multiple interfaces due to the silica grains. Similar results were already reported on other insulating materials such as low density polyethylene (Matsui et al. 2002).
7. Conclusion
Critical densities of space charges were revealed in the investigated epoxy-based insulation, leading to a single scenario for space charge build-up: creation of homocharge by injection at both electrodes, then drift of these homocharges towards the opposite electrode, providing profiles revealing heterocharges at both electrodes for a suitable combination of stressing parameters that are time, temperature and field. Breakdown could follow, depending on temperature, and on the presence of mineral filler. Gold electrodes significantly limit space charge injection. On a technologic point-of-view, the PEA technique may be capable of separating space charge contributions from dipolar polarization, bulk charge and associated image charge. Finally, we have shown that space charge measurement on filled epoxy resin is possible by the PEA method, even though the quartz filler exhibits piezoelectric properties.
Acknowledgements
We are grateful to K Fukunaga, Five Labs, Japan for providing us with the Peanuts® Software for data acquisition and processing.
References
[Dakin 1974] T. W. Dakin 1974 Application of epoxy resins in electrical apparatus IEEE Trans. Elec. Insul. 9 121-8. [Champion 1995] J. V. Champion and S. J. Dodd 1995 The effect of voltage and material age on the electrical tree growth and breakdown characteristics of epoxy resins J. Phys. D: Appl. Phys. 28 398-407.
[Champion 1996] J. V. Champion, S. J. Dodd and J. M. Alison 1996 The correlation between the partial discharge behaviour and the spatial and temporal development of electrical trees grown in an epoxy resin J. Phys. D: Appl. Phys. 29 2689-95.
[Chen 2001] G. Chen, T.Y.G. Tay, A.E. Davies, Y. Tanaka, T. Takada 2001 Electrodes and charge injection in low-density polyethylene IEEE Trans. Diel. & Elec. Insul. 8 867-873.
[Fleming 2000] R.J. Fleming, M. Henriksen, J.T. Holbøll 2000 The influence of electrodes and conditionning on space charge accumulation in XLPE et al. 2000 IEEE Trans. Diel. & Elec. Insul. 7 561-571.
[Fukunaga 1998] K. Fukunaga, T. Maeno, Y. Hashimoto, K. Suzuki 1998 Space charge formation at the interface between a charge transport layer an a polyester film IEEE Trans. Diel. & Elec. Insul. 5 276-280.
[Gallot-Lavallee 2004a] O. Gallot-Lavallee, G. Teyssedre, C. Laurent and S. Rowe 2004 Electroluminescence and thermo stimulated luminescence in an epoxy resin under uniform ac field Proc. 8th International Conference on Solid Dielectrics (IEEE) 703-6.
[Gallot-Lavallee 2004b] O. Gallot-Lavallee and G. Teyssèdre 2004 Space charge measurement in solid dielectrics by the pulsed electro-acoustic technique Proc. 8th International Conference on Solid Dielectrics (IEEE) 268-271.
[Gallot-Lavallee 2005] O. Gallot-Lavallee, V. Griseri, G. Teyssedre and C. Laurent 2005 The pulsed electro-acoustic technique in research on dielectrics for electrical engineering: today's achievements and perspectives for the future RIGE (Hermes/Lavoisier) Ref. 216.
[Griseri 2002] V. Griseri, L. A. Dissado, J. C. Fothergill, G. Teyssedre, and C. Laurent 2002 Electroluminescence excitation mechanisms in an epoxy resin under divergent and uniform field
IEEE-Transactions-on-Dielectrics-and-Electrical-Insulation 9 150-60.
[Guillermin 2004] C. Guillermin, P. Rain, and S. Rowe 2004 Influence of Tg on space charge development in epoxy resin
Proc. 8th International Conference on Solid Dielectrics (IEEE) 229-232.
[Holé 2004] S. Holé, A. Sylvestre, and S. Rowe 2004 The influence of filler particles on space charge measurements J.
Phys. D: Appl. Phys. 37 1869-76.
[Iizuka 1999] T. Iizuka, K. Yoshimoto, H. Takai, K. Fukunaga, and T. Maeno 1999 Measurement of Space Charge Distribution in Epoxy Resin Elec. Eng. in Japan 129 129-34.
[Jeroense 1997] M. Jeroense, "Charges and discharges in HVDC cables", Delft: Delft University Press, 1997.
[Laurent 1997] C. Laurent, F. Massines, and C. Mayoux 1997 Optical emissions due to space charge effects in electrically stressed insulating polymers IEEE Trans. Diel. & Elec. Insul. 4 585-603.
[Le Huy 1992] H. M. Le Huy, V. Bellenger, and J. Verdu 1992 Thermal oxidation of anhydride cured epoxies. I- mechanistic spects Polymer Degradation and Stability 35 77-86.
[Maeno 1999] T. Maeno 1999 Calibration of pulsed electroacoustic method for measuring space charge density T. IEE
Japan 119-A 1114-9.
[Matsui 1902] K. Matsui, Y. Tanaka, T. Fukao, T. Takada, and T. Maeno 2002 Short-duration Space Charge Observation
Proc. Conference-on-Electrical-Insulation-and-Dielectric-Phenomena (IEEE) 598-601.
Figure captions
Figure 1: Scanning Electron Micrography (SEM) of SiO2 powder.
Figure 2: Space charge profiles during and after DC stressing under 40kV/mm. (a) un-coated sample. (b) gold-coated sample.
Figure 3: Space charge profiles around anode and cathode during the polarization (1h) / relaxation (1h) cycle, for an un-coated sample. Profiles were obtained in 20s intervals. Solid and dashed arrows indicate the time evolution during polarization and relaxation, respectively.
Figure 4: Dynamic of net charge variation during a polarization / relaxation cycle at the cathode of an un-coated sample. Quantities were integrated in the regions limited by dashed lines in Figure 2 and are relevant to a 0.5cm² area of the sample. The samples was grounded at 3600s.
Figure 5: Dynamic of the polarization charge -QpK during a polarization / relaxation cycle. (a) un-coated sample; (b)
gold-coated sample. Quantities are relevant to a 0.5cm² area of the sample.
Figure 6: Dynamic response of the piezoelectric sensor associated to the amplifiers. The pulsed electric stimulation (5ns) was the same for all the samples. Signals were acquired during the 1st min. of voltage application.
Figure 7: Dynamic response of the piezoelectric sensor associated to amplifiers. Signals 1 to 4 were recorded
consecutively, with a short stressing time at each level. The sample is composed of a 500µm-thick layer of pure epoxy and a 500µm-thick layer of 60 wt.% filled epoxy. An,Kn: response to the "n" harmonic of electrical pulse, corresponding respectively to the capacitive charge from cathode and anode.
Figure 8: Cartographic vision of space charge density in the vicinity of the electrodes, obtained under 40kV/mm (t<3600s) and in volt-off (t>3600s) on a pure epoxy sample at 72°C. (a) gold-coated sample. (b) un-coated sample. Cathode around x=0; Anode around x=500µm.
Figure 9: Cartographic vision of space charge density in the bulk of the insulation, obtained under 40kV/mm and in volt-off (t>3600s) on a pure epoxy sample with gold electrodes at 72°C. The long and short diagonal arrow indicates the progression of a front of negatives charges from cathode to anode.
Figure 10: Density of the influence charge (in absolute value) taken on the electrode, as derived from data presented in
Figure 8a (gold-coated sample). A and K stand for anode and cathode respectively.
Figure 11: Space charge profiles obtained at 24°C (a) on a pure epoxy sample, (b) on a filled epoxy sample after 5min under 20kV/mm and after 20s in volt-off on un-coated samples. The dashed lines define integration limit used to quantify the homocharge in volt-on as reported in Figure 12.
Figure 12: Field dependence of negative homocharge obtained by integration in the area delimited by dashed lines in Figure 11, for different materials and measurement temperature. Samples are not gold-coated. The dash-dot line represents an upper limit of the capacitive charge Qp taken into account in the integration.
Figure 13: Space charge evolution of an un-coated filled epoxy sample just before breakdown at 72°C. Volt-on and volt-off periods last for 600s.
Figure 14: Phenomenological proposal on the build-up of space charge in our epoxy resin featuring: homocharges generation at room temperature, temperature-enhanced drift of positives and negatives charges towards opposite electrodes leading to heterocharges accumulation, field-enhancement at the interfaces leading to breakdown possibly favoured in filled samples.
Figures
-38 0 73 500 -60 -40 -20 0 20 40 Depth (µm) S pa ce c ha rg e de ns it y (C/ m 3 ) t polarization = 20 s t polarization = 3600 s t relaxation = 20 s t relaxation = 3600 s bulk charge
influence charge (a)
Cathode Anode -52 0 33 500 -60 -40 -20 0 20 40 t polarization = 20 s t polarization = 3600 s t relaxation = 20 s t relaxation = 3600 s Depth (µm) S pa ce c ha rg e de ns it y (C/ m 3 ) influence charge (b) Cathode Anode
Figure 2: Space charge profiles during and after DC stressing under 40kV/mm. (a) un-coated sample. (b) gold-coated sample.
-38 0 73 -60 -40 -20 0 20 500 -60 -40 -20 0 20 Depth (µm) S pa ce c ha rg e de ns it y (C/ m 3 ) Around Anode Volt off Volt On Increasing time: Around Cathode
Figure 3: Space charge profiles around anode and cathode during the polarization (1h) / relaxation (1h) cycle, for an un-coated sample. Profiles were obtained in 20s intervals. Solid and dashed arrows indicate the time evolution during polarization and relaxation, respectively.
0 1000 2000 3000 4000 5000 6000 7000 -8 -6 -4 -2 0 2 4 6x 10 -8 Qi K (Influence charge) Qb K (Bulk charge) E lc tri ca l c ha rg e qu an ti ty (C) Time (s) 3600s Polarization Relaxation
Figure 4: Dynamic of net charge variation during a polarization / relaxation cycle at the cathode of an un-coated sample. Quantities were integrated in the regions limited by dashed lines in Figure 2 and are relevant to a 0.5cm² area of the sample. The samples was grounded at 3600s.
0 2000 4000 6000 0 1 2 3 4 5 6 7 8x 10 -8 -Qp K 0 2000 4000 6000 0 1 2 3 4 5 6 7 8x 10 -8 -Qp K (b) (a) E le ct ri ca l c ha rg e qu an ti ty (C) Time (s) Gold-coated sample Un-coated sample
Figure 5: Dynamic of the polarization charge -QpK during a polarization / relaxation cycle. (a) un-coated sample; (b)
0 41 82 123 164 205 246 287 -80 -60 -40 -20 0 20 40 60 Time (ns) P V D F e le ct ri ca l re sp on se (V ) (x-1) 24°C -20kV/mm DC 60%SiO2 (x 7) 72°C 40kV/mm DC 00%SiO2 (x 1) 24°C 40kV/mm DC 00%SiO2
Cathode Anode Anode
x10-3
Figure 6: Dynamic response of the piezoelectric sensor associated to the amplifiers. The pulsed electric stimulation (5ns) was the same for all the samples. Signals were acquired during the 1st min. of voltage application.
100 300 500 700 -2 -1 0 1 2 3 4x 10 -3 Time (ns) P V D F e le ct ri ca l re sp on se (V ) Pure epoxy -6kV/mm(4) -4kV/mm(3) -2kV/mm(2) 0kV/mm(1) -1 0 1 x 10⁻³ Zoom* K1 Zoom* Filled epoxy A2 A3 K2 (4) (2) (3) (1) Overlapping area A1 3.5 4 x10⁻⁷
Figure 7: Dynamic response of the piezoelectric sensor associated to amplifiers. Signals 1 to 4 were recorded consecutively, with a short stressing time at each level. The sample is composed of a 500µm-thick layer of pure epoxy and a 500µm-thick layer of 60 wt.% filled epoxy. An, Kn: response to the "n" harmonic of electrical pulse, corresponding to the capacitive charge from anode and cathode, respectively.
Figure 8: Cartographic vision of space charge density in the vicinity of the electrodes, obtained under 40kV/mm (t<3600s) and in volt-off (t>3600s) on a pure epoxy sample at 72°C. (a) gold-coated sample. (b) un-coated sample. Cathode around x=0; Anode around x=500µm.
Figure 9: Cartographic vision of space charge density in the bulk of the insulation, obtained under 40kV/mm and in volt-off (t>3600s) on a pure epoxy sample with gold electrodes at 72°C. The long and short diagonal arrow indicates the progression of a front of negatives charges from cathode to anode.
0 400 800 1200 1600 2000 2400 2800 3200 3600 20 22 24 26 28 30 32 34 36 Time (s) In fl ue nc e ch arg e de ns it y (C/ m 3 ) Homocharges build-up Heterocharges build-up Homocharges build-up Heterocharges build-up K A A K
Figure 10: Density of the influence charge (in absolute value) taken on the electrode, as derived from data presented in Figure 8 a (gold-coated sample). A and K stand for anode and cathode respectively
-38 0 100 -30 -20 -10 0 10 20 30 Polarization 20kV/mm (24°C) Relaxation 0kV/mm (24°C)
Negative homocharge integration area (Volt On) Image charge Negative homocharge Cathode Anode S pa ce c ha rg e de ns it y (C/ m 3 ) Depth (µm) (a) -38 0 150 -30 -20 -10 0 10 20 30 Depth (µm) S pa ce c ha rg e de ns it y (C/ m 3 ) Polarization 20kV/mm (24°C) Relaxation 0kV/mm (24°C) Cathode Anode
Negative homocharge integration area (V.On) Negative homocharge Image charge (b)
Figure 11: Space charge profiles obtained at 24°C (a) on a pure epoxy sample, (b) on a filled epoxy sample after 5min under 20kV/mm and after 20s in volt-off on un-coated samples. The dashed lines define integration limit used to quantify the homocharge in volt-on as reported in Figure 12.
4 6 8 10 20 0 1 2 3 4 5x 10 -8 Electric field (kV/mm) N eg at iv e ho m oc ha rg e (C) 24°C pure 72°C pure 24°C 60% SiO 2 72°C 60% SiO 2 Ref. 50% Qp
Figure 12: Field dependence of negative homocharge obtained by integration in the area delimited by dashed lines in Figure 11, for different materials and measurement temperature. Samples are not gold-coated. The dash-dot line represents an upper limit of the capacitive charge Qp taken into account in the integration.
Figure 13: Space charge evolution of an un-coated filled epoxy sample just before breakdown at 72°C. Volt-on and volt-off periods last for 600s.
A K Epoxy
Ti
m
e
Depth 72°C SiO2+72°C Breakdown 24°CFigure 14: Phenomenological proposal on the build-up of space charge in our epoxy resin featuring: homocharges generation at room temperature, temperature-enhanced drift of positives and negatives charges towards opposite electrodes leading to heterocharges accumulation, field-enhancement at the interfaces leading to breakdown possibly favoured in filled samples.