HAL Id: hal-00271575
https://hal.archives-ouvertes.fr/hal-00271575
Preprint submitted on 9 Apr 2008
HAL is a multi-disciplinary open access
archive for the deposit and dissemination of
sci-entific research documents, whether they are
pub-lished or not. The documents may come from
teaching and research institutions in France or
abroad, or from public or private research centers.
L’archive ouverte pluridisciplinaire HAL, est
destinée au dépôt et à la diffusion de documents
scientifiques de niveau recherche, publiés ou non,
émanant des établissements d’enseignement et de
recherche français ou étrangers, des laboratoires
publics ou privés.
Finding ultracool brown dwarfs with MegaCam on
CFHT: method and first results
Philippe Delorme, Chris Willott, Thierry Forveille, Xavier Delfosse, Céline
Reylé, Emmanuel Bertin, Loic Albert, Etienne Artigau, Annie Robin, France
Allard, et al.
To cite this version:
Philippe Delorme, Chris Willott, Thierry Forveille, Xavier Delfosse, Céline Reylé, et al.. Finding
ultracool brown dwarfs with MegaCam on CFHT: method and first results. 2008. �hal-00271575�
hal-00271575, version 1 - 9 Apr 2008
April 9, 2008
Finding ultracool brown dwarfs with
MegaCam on CFHT: method and first results
⋆
P. Delorme
1, C.J. Willott
2, T. Forveille
1, X. Delfosse
1, C. Reyl´e
3, E. Bertin
4, L. Albert
5, E. Artigau
6, A.C. Robin
3, F.
Allard
7, R. Doyon
8, and G.J. Hill
91 Laboratoire d’Astrophysique de Grenoble,Universit´e J.Fourier, CNRS, UMR5571, Grenoble, France
2 University of Ottawa, Physics Department, 150 Louis Pasteur, MacDonald Hall, Ottawa, ON K1N 6N5, Canada 3 Observatoire de Besanc¸on, Institut Utinam, UMR CNRS 6213, BP 1615, 25010 Besanc¸on Cedex, France 4 Institut d’Astrophysique de Paris-CNRS, 98bis Boulevard Arago, F-75014, Paris, France
5 Canada-France-Hawaii Telescope Corporation, 65-1238 Mamalahoa Highway, Kamuela, HI96743, USA 6 Gemini Observatory Southern Operations Center c/o AURA, Casilla 603 La Serena, Chile
7 C.R.A.L. (UMR 5574 CNRS), ´ecole Normale Sup´erieure, 69364 Lyon Cedex 07, France
8 D´epartement de physique and Observatoire du Mont M´egantic, Universit´e de Montr´eal, C.P. 6128, Succursale Centre-Ville,
Montr´eal, QC H3C 3J7, Canada
9 McDonald Observatory, University of Texas at Austin, 1 University Station C1402, Austin, TX 78712-0259, USA
ABSTRACT
Aims.We present the first results of a wide field survey for cool brown dwarfs with the MegaCam camera on the CFHT telescope, the Canada-France Brown Dwarf Survey, hereafter CFBDS. Our objectives are to find ultracool brown dwarfs and to constrain the field-brown dwarf mass function thanks to a larger sample of L and T dwarfs.
Methods.We identify candidates in CFHT/MegaCam i′
and z′
images using optimised psf-fitting within Source Extractor, and follow them up with pointed near-infrared imaging on several telescopes.
Results.We have so far analysed over 350 square degrees and found 770 brown dwarf candidates brighter than z′
AB=22.5. We currently
have J-band photometry for 220 of these candidates, which confirms 37% as potential L or T dwarfs. Some are among the reddest and farthest brown dwarfs currently known, including an independent identification of the recently published ULAS J003402.77-005206.7 and the discovery of a second brown dwarf later than T8, CFBDS J005910.83-011401.3 . Infrared spectra of three T dwarf candidates confirm their nature, and validate the selection process.
Conclusions. The completed survey will discover ∼100 T dwarfs and ∼500 L dwarfs or M dwarfs later than M8, approximately doubling the number of currently known brown dwarfs. The resulting sample will have a very well-defined selection function, and will therefore produce a very clean luminosity function
Key words.Low mass stars: Brown Dwarfs – photometry – spectroscopy – Methods: data analysis – Surveys
Send offprint requests to: P. Delorme, e-mail: [email protected]
⋆ Based on observations obtained with MegaPrime/MegaCam, a joint
project of CFHT and CEA/DAPNIA, at the Canada-France-Hawaii Telescope (CFHT) which is operated by the National Research Council (NRC) of Canada, the Institut National des Sciences de l’Univers of the Centre National de la Recherche Scientifique (CNRS) of France, and the University of Hawaii. This work is based in part on data products produced at TERAPIX and the Canadian Astronomy Data Centre as part of the Canada-France-Hawaii Telescope Legacy Survey, a collabo-rative project of NRC and CNRS. Based on observations made with the ESO New Technology Telescope at the La Silla Observatory under pro-gramme ID 76.C-0540(A), 77.C-0594, 77.A-0707, 78.A-0651, 78.C-0629 and 79.A-0663. Based on observations obtained at the Gemini Observatory, which is operated by the Association of Universities for Research in Astronomy, Inc., under a cooperative agreement with the NSF on behalf of the Gemini partnership: the National Science Foundation (United States), the Science and Technology Facilities Council (United Kingdom), the National Research Council (Canada), CONICYT (Chile), the Australian Research Council (Australia), CNPq (Brazil) and CONICET (Argentina). Based on observations with the Kitt Peak National Observatory, National Optical Astronomy Observatory, which is operated by the Association of Universities for Research in Astronomy, Inc. (AURA) under cooperative agreement
1. Introduction
Brown dwarfs (BD) are of interest in many fields of stellar and planetary astrophysics, including star and planet formation the-ories, the physics of degenerate stellar interiors, and that of very cool stellar atmospheres. Since the discovery in 1995 of an old brown dwarf companion to a star (Nakajima et al. 1995) and a few free-floating young brown dwarfs in the Pleiades cluster (Rebolo et al. 1995), numerous isolated cold field brown dwarfs have been discovered by very wide field surveys like DENIS (DEep Near Infrared Survey Epchtein et al. 1997; Delfosse et al. 1997, 1999; Mart´ın et al. 1999; Kendall et al. 2004), 2MASS (2 Microns All Sky Survey Skrutskie et al. 2006; Kirkpatrick et al. 1999; Burgasser et al. 2000, 2004), SDSS (Sloan Digital Sky Survey York et al. 2000; Strauss et al. 1999; Hawley et al. 2002; Knapp et al. 2004; Chiu et al. 2006) and UKIDSS (UKIRT Infrared Deep Sky Survey Lawrence et al. 2007; Lodieu et al.
with the National Science Foundation. Based on observations made with the Nordic Optical Telescope, operated on the island of La Palma jointly by Denmark, Finland, Iceland, Norway, and Sweden, in the .Spanish Observatorio del Roque de los Muchachos of the Instituto de Astrofisica de Canarias. This paper includes data taken at The McDonald Observatory of The University of Texas at Austin.
2007). Follow up of these discoveries, and of the fewer brown dwarfs identified as companions to stars (e.g. Scholz et al. 2003), has lead to spectacular advances on (1) interaction between mat-ter and radiation in cool dense and complex turbulent atmo-sphere, where molecules and dust form and dissipate; (2) stellar and planetary formation and (3) galactic structure, with the first characterization of the substellar mass function (e.g. Chabrier (2001), for an extensive review).
Much interesting work however remains to be done, and the advent of wide field cameras on large telescopes makes an unprecedented volume of the Milky Way accessible for brown dwarf searches. Here we use two large surveys with MegaCam1 on the CFHT telescope, the Canada-France-Hawaii
Telescope Legacy Survey (CFHTLS2) and the Red-sequence
Cluster Survey 2 (RCS-2; Yee et al. (2007)), and complement them by additional observations to address three areas of brown dwarf physics:
(1) Detection and physics of ultracool brown dwarfs (Teff <
1000 K). As of today, observed stellar and substellar atmo-spheres cover a continuum of physical conditions from the hottest stars (∼ 100 000 K) to the coolest known brown dwarf (Delorme et al. 2008, ∼ 625 K,). There remains a sizeable temperature gap, between these coolest brown dwarfs and the
∼100 K giant planets of the Solar System. Besides their intrinsic interest, ultracool brown dwarfs provide analogs to these planets that are not encumbered by the glare of a bright star. This will greatly help guiding the design of direct planet detection exper-iment, which currently have to rely on unvalidated models.
(2) Brown dwarfs in the thick disc and spheroid. The LSR (Lepine-Shara-Rich) and 2MASS surveys have recently identified the first L subdwarfs (Burgasser et al. 2003; L´epine et al. 2003), i.e. low metallicity brown dwarfs from the galactic halo population, from samples of a few hundred L dwarfs. The MegaCam survey will reach further down the halo luminosity function and may find a few T-type subdwarfs.
(3) Statistics of brown dwarfs of intermediate temper-ature (1000 to 1500 K). Current estimates of the substellar Galactic mass function suggest that in the disk of the Galaxy brown dwarfs are about as numerous as stars (e.g Chabrier 2001; Cruz et al. 2007). That mass function however has significant statistical noise, which reduces its power as a constraint on star formation and galactic structure theories. At these low effective temperatures the final luminosity functions from the DENIS, 2MASS and SDSS surveys will all retain significant Poisson noise The samples from individual searches are not easily com-bined since they are affected by different selection biases, so only a fraction can be used to define a robust luminosity function (e.g. Cruz et al. 2007). By almost doubling the number of known brown dwarfs, from a single survey with a well understood se-lection function, we will provide significantly tighter constraints on the luminosity function.
The present paper describes the overall strategy of our brown dwarf search. Sec 2 discusses the observational proper-ties which we use to identify these extremely red objects, and presents the corresponding observational material, while Sec. 3 describes how we generate a candidate list with minimal con-tamination from both observational and astrophysical artefacts. Sec. 4 describes the characteristics of the resulting candidates and presents spectra for a few T dwarfs identified early-on. We conclude with a discussion of the expected results for the com-pleted survey.
1 http://www.cfht.hawaii.edu/Instruments/Imaging/MegaPrime/ 2 http://www.cfht.hawaii.edu/Science/CFHTLS/
2. Observations
2.1. Observational properties of brown dwarfs
Field brown dwarfs are extremely cool objects, with a temper-ature range which currently extends from ∼ 2500K (early L) to
∼625K (late T) (Delorme et al. 2008; Golimowski et al. 2004; Warren et al. 2007). Even cooler, yet to found, brown dwarfs should close the temperature gap between late type T dwarfs and solar system giant planets(∼ 100K). Brown dwarfs spectra very much differ from a black body, and have considerable structure from deep absorption lines and bands. Their spectral energy distribution (in νFν units) peaks in the near infrared (hereafter NIR), particularly in the J photometric band, and they are most easily detected in that wavelength range. Their pure NIR JHK colours however do not very effectively distinguish them from other classes at modest S/N ratio. Brown dwarfs are more easily recognised by including at least one photometric band below 1 µm, since their steep spectral slope at those wavelength produce very distinctively red i′ −z′ and z′ − J colours. As one recent example, the T8.5 ULAS 0034 has (i′−z)′
AB >3.0 (5 σ, Delorme et al. 2008), and at any S/N ratio
where it is safely detected it cannot be confused with anything, except a slightly earlier T dwarf or a z=6 quasar. The UKIDSS discovery observation however was less than 3σ away from the K dwarf locus. Since K dwarfs outnumber T dwarfs by orders of magnitude in any flux limited sample, that distance would have been woefully insufficient for a secure identification. The non-detection of ULAS 0034 at i′ and z′ in the deep SDSS stripe 82 played a major role in its identification by Warren et al. (2007)), and other near-IR searches for brown dwarfs similarly use some <1µm imaging to weed out their contamination.
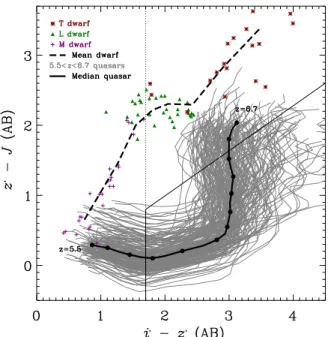
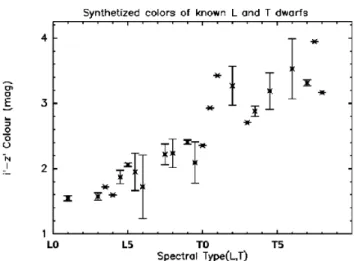
We take advantage of the wide field of view of the MegaCam camera (Boulade et al. 2003) on the CFHT telescope, and of the trove of observational material obtained with that instrument, to select brown dwarfs on their i′−z′colour. The i′−z′colour has excellent dynamics for brown dwarfs, varying from 1.7 to 4.0 be-tween mid-L and late-T (Fig. 3). It therefore provides (at least at high S/N ratio) a good spectral type estimator. At the high galac-tic latitude of our survey, the i′−z′colour distinguishes brown dwarfs from almost every astronomical source type, but it leaves one contaminant, quasars at z ≥ 5.8. Those are of considerable interest in their own right, but need to be distinguished from the brown dwarfs. As first shown by Fan et al. (2001), the i′−z′vs
z′−J colour/colour diagram very effectively separates the two
populations (Fig. 1 and Willott et al. (2005)). The very red i′−z′ of high redshift quasars is caused by deep Lyman α absorption on a relatively flat intrinsic spectrum), and they therefore have a more neutral z′−J. The spectral distribution of brown dwarfs, in contrast, keeps rising steeply into the J band. We therefore complement our MegaCam i′and z′photometry by pointed J-band imaging of the candidates selected on i′−z′. Besides pin-pointing the (few) quasars, the J-band photometry very effec-tively rejects any remaining observational artefact, as well as the (more numerous) moderately red stars scattered into the brown dwarf/quasar box by large noise excursions.
2.2. Synthetic colours
Each square-degree MegaCam image contains a few hundred thousand objects, of which at most a few are brown dwarfs. We thus need to strike a careful balance between sample complete-ness and contamination. To tune this compromise we need a
pre-Fig. 1. z′−J and i′−z′ colours of brown dwarfs and quasars. These synthetic colours were computed for the MegaCam i′and
z′ photometric system and the NTT SOFI J
short system. The
bold lines represents the average colours of dwarfs (dashed) and quasars (solid). Symbols marks the individual colours of known brown dwarfs. The thin grey lines mark the colour evolution of individual synthetic quasars (described in detail in Willott et al. (2005)) as their redshift ranges from 5.5 to 6.7. The quasar red-shift increases for redder colours. The vertical line at i′−z′=1.7
marks our i′−z′selection criterion. The quasar selection box is also marked (to the lower-right of the solid line).
cise knowledge of the colours of brown dwarfs and quasars for the exact instruments and filters used in our survey. As discussed in Willott et al. (2005), these colours are known for some pho-tometric systems, in particular SDSS and 2MASS, but the fil-ters and quantum efficiency curves of MegaCam are notably dif-ferent (Fig.2). This is particularly significant for brown dwarfs and quasars. Due to their highly structured spectra a modest change to a response curve can produce significantly different colours when it includes or excludes a major absorption band or emission line. We update the synthetic colours of Willott et al. (2005), using additional brown dwarfs spectra which have be-come available since 2005, and adding the many near-IR instru-ments and filters which we use for the J-band imaging. We use publically available spectra (from S. Leggett’s website3, Mart´ın
et al. (1999); Kirkpatrick et al. (2000); Geballe et al. (2001); Leggett et al. (2002); Burgasser et al. (2003); Knapp et al. (2004); Golimowski et al. (2004); Chiu et al. (2006)) of over 60 brown dwarfs with spectral types L1 to T8 (on the Burgasser et al. (2006) spectral type scale) and the synthetic quasar spectra of Willott et al. (2005). We compute their synthetic MegaCam i′ and z′ photometry in the AB system (Fukugita et al. 1996) us-ing detector quantum efficiency and transmission curves for the atmosphere, telescope, camera optics, and filters (cf figure2), ob-tained from the CFHT web page. Figure. 3 displays the resulting colours as a function of the spectral type.
We similarly synthesize J-band photometry for each of the instruments and J filters used in the J-band follow up. These instruments have significantly different response curves, which must be taken into account to obtain homogeneous selection
cri-teria. We found, in particular, that brown dwarfs colours which include J photometry obtained at the NTT with SOFI and its (default) wide J filter are not as red as we initially expected: contrary to most J filters, its wide bandpass includes water va-por bands which are strongly absorbed in L and (particularly) T dwarfs. As a result, the i′−J and z′−J colours which use this filter are bluer by ∼ 0.15 mag for early L and ∼ 0.5 mag for late T. After we realised this we switched our SOFI observations to the alternate Jshortfilter, which better separates T dwarfs from
quasars. We use the synthetic colours to shift our selection boxes according to the actual filter.
Fig. 2. Compared spectral response functions of the CFHT (thick lines) and SDSS (thin dashed lines) instruments for their i′(dark blue) and z′(red) filters. These factor in the average atmospheric transmission of the two observatory sites, the telescope reflectiv-ities, the transmissions of the camera optics and filters, and the quantum efficiencies of the CCDs. Contrary to the SDSS band-passes, the CFHT i′and z′filters overlap significantly, leading to less contrasted colours.
2.3. Optical data
Our survey for brown dwarfs, the Canada-France Brown Dwarf Survey (CFBDS), builds upon two major MegaCam surveys, the Canada-France-Hawaii Telescope Legacy Survey (hereafter CFHTLS) and the Red-sequence Cluster Survey 2 (hereafter RCS-2, Yee et al. 2007) and, where necessary, complements their filter coverage with the additional MegaCam observations needed to obtain pairs of i′and z′images. Figure 4 summarizes the currrent sky coverage of our optical survey data.
The CFHTLS survey has three components, named Deep, Wide, and Very Wide, ( described in detail on the CFHTLS web page, http://www.cfht.hawaii.edu/Science/CFHLS/), and we use all three.
CFHTLS Deep This deepest component of the CFHTLS covers four high galactic latitude and low extinction 1 square degree fields in the u∗g′r′i′z′ filters, and it is primarily moti-vated by the SNLS type Ia supernovae search (Pain & SNLS Collaboration 2003). The expected total exposures times per field of the completed survey will be 66h at z′ and 132h at i′ with 10 σ depths of z′
AB∼26.25 and i
′
AB∼27.65. This sensitivity
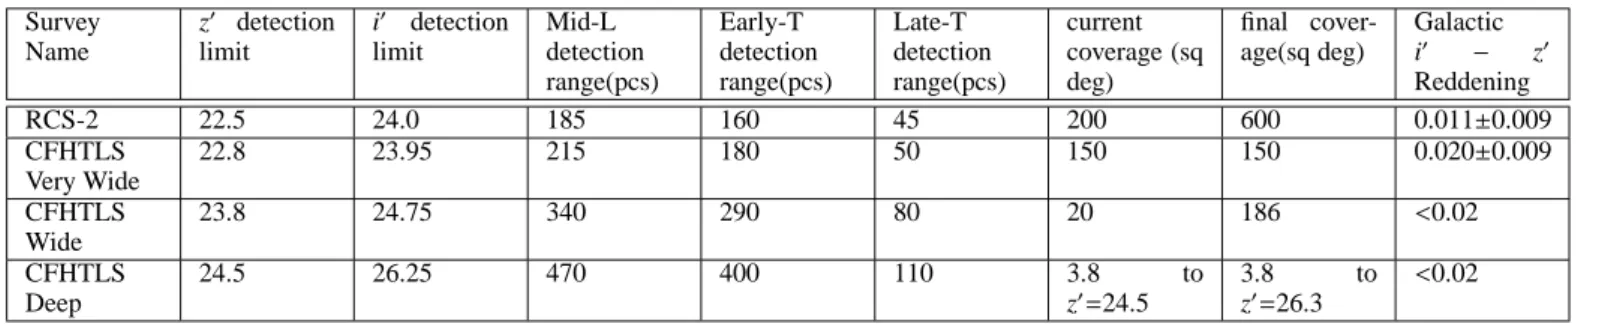
Table 1. Characteristics of the optical surveys used by CFBDS. Survey Name z′ detection limit i′ detection limit Mid-L detection range(pcs) Early-T detection range(pcs) Late-T detection range(pcs) current coverage (sq deg) final cover-age(sq deg) Galactic i′ − z′ Reddening RCS-2 22.5 24.0 185 160 45 200 600 0.011±0.009 CFHTLS Very Wide 22.8 23.95 215 180 50 150 150 0.020±0.009 CFHTLS Wide 23.8 24.75 340 290 80 20 186 <0.02 CFHTLS Deep 24.5 26.25 470 400 110 3.8 to z′ =24.5 3.8 to z′ =26.3 <0.02
The detection limits correspond to 10σ, as needed for 10% precision photometry.
Fig. 4. Sky chart of sky area covered by CFBDS so far. Black curve marks the galactic plane while dotted curves mark +30oand −30ogalactic latitude.
such distances, and at high galactic latitude, the thick disk becomes dominant and we therefore have good hopes to probe its brown dwarf population. The present analysis uses the T0003 release (T0004 was very recently released, but we have yet to analyse and follow-up the corresponding detections) which has 10 σ depths of z′
AB ∼24.7 and i
′
AB ∼26.25. Thanks to their
large number of contributing exposures and their extended time base, the T0003 images are extremely clean, with essentially no contamination by cosmic rays or bad pixels, or by variable or moving objects such as supernovae and asteroids.
CFHTLS Wide This component of the CFHTLS will cover 186 deg2 divided between four high galactic latitude low extinction fields, in u∗g′r′i′z′, and it is primarily motivated by cosmological weak lensing. We have analysed the 20 deg2 that
have both i′and z′ coverage in the T0003 CFHTLS release (i′ coverage is considerably more extensive, due to priorities set by the main drivers of the Wide survey). The average 10 σ depths are z′
AB∼23.8 (for total exposure times of 7200s) and i
′
AB∼24.75
(for total exposure times of 4300s), with small field to field
variations due to seeing and sky background fluctuations. Of the three components the Wide probes the largest volume. The Wide images have enough coadded subexposures (9 for z′ and 7 for i′) to reject all cosmic rays and bad pixels, and the overall exposure times are sufficiently long to eliminate all but the slowest moving objects. The i′ and z′images on the other hand are usually not contemporaneous, and variable sources (in practice mostly supernovae) which are serendipitously bright in the z′can erroneously pass our i′−z′colour filter. Those need to be eliminated at a later stage.
CFHTLS Very Wide (VW) This shallowest component of the CFHTLS is motivated by transneptunian objects and was initially set to cover 1000 deg2 in the ecliptic plane with g′r′i′images. It was later downsized to ∼250 deg2 when it was
realised that the three components could not all be completed within the allocated time. We use the ∼150 deg2 from the
Very Wide with absolute value of the galactic latitude above 30 degrees to ensure low absorption (see table 1). The average 10 σ depth of the 540s i′ VW exposures is i′AB ∼23.95, and
Fig. 3. i′ − z′ synthetic colour versus spectral type for the MegaCam photometric system. The colour for a spectral type is the average over the brown dwarf spectra from Chiu et al. (2006), Golimowski et al. (2004) and Knapp et al. (2004) with that spectral type, and the error bars represent the dispersion (set to 0 when only one template per spectral bin is available).
we complement them by 420s z′ exposures, with typical 10σ depths of z′
AB ∼22.8. Both sets of images are coadditions of 3
subexposures separated by at least one night. We therefore have enough information to reject the vast majority of bad pixels, cosmic ray hits, and moving solar system objects. The time span of the 3 z′exposures on the other hand is usually too short to reliably recognize supernovae, which vary on time scales of a few weeks. We therefore again need to reject these contaminants at a later stage.
Red-sequence Cluster Survey 2 (RCS-2) The RCS-2, designed to identify distant galaxy clusters through their galaxies on the red sequence, (Yee et al. 2007) is an ongoing
g′r′z′ survey of 800 deg2 at high galactic latitude to lower
the absorption (see table 1. We have to date used ∼600 deg2 kindly made available to us by the RCS-2 consortium, , and we complement their 360s z′ band images by 500s or 680 s i′ exposures, depending on the seeing. The resulting 10σ depths of (z′
AB ∼22.5 and i
′
AB ∼24.0 are similar to those of the
CFHTLS-VW. Both the RCS-2 images and our complementary
i′data are single exposures, which maximize the depth achieved for a given observing time. We use the RCS-2 g′ and r′ images, which are contemporaneous with the z′ones, to iden-tify and reject both supernovae and moving solar system objects. All images are pre-processed by the CFHT staff using the ELIXIR package (Magnier & Cuillandre 2004). The CFHTLS Deep and Wide images are aligned and coadded by the Terapix data center (Bertin et al. 2002). For the CFHTLS Very Wide and RCS-2 datasets, we carry out our own processing to check and refine the astrometry and (for fields which overlap the SDSS) photometry. For the CFHTLS Very Wide, each pointing has 3 subexposures per filter which are combined whilst rejecting bad pixels and cosmic ray impacts. The CFHTLS Very Wide and RCS-2 images in different filters are aligned (with distortion cor-rection) and trimmed to their common area.
To date most of our volume coverage originates in the CFHTLS Very Wide and RCS-2, due in part to the late start of the z′ part of CFHTLS-Wide. We have currently analysed
350 deg2of the 800 deg2expected for these two surveys. Their
relative shallowness has the advantage of producing targets for which spectroscopy can be obtained relatively easily on 8m-class telescopes.
Table 1 summarizes the properties of the four surveys, listing the limiting magnitude, the maximum distances at which mid-L and late-T dwarfs can be detected to these magnitudes, and the current and final areas covered by the survey. Our full sur-vey probes several times the SDSS volume for T dwarfs and we expect to detect ∼100 new T dwarfs (compared with the ∼150 currently known)
2.4. Near Infrared Imaging
As explained above, we use J-band photometry to distinguish between brown dwarfs and z> 5.8 quasars. For brown dwarfs (and very low mass stars) the z′−J colour also provide a good spectral type diagnostic, for which we obtain better S/N ratio than i′−z′. That is in particular very helpful in eliminating mid-M dwarfs scattered into our i′−z′ selection box by several σ noise excursions. Given the relative numbers of mid-M stars and brown dwarfs in a magnitude-limited sample, these noise excur-sions are sufficiently frequent to very significantly contaminate our i′−z′selection, but the better S/N ratio of the z′−J colour (and the low likelihood of large noise excursions at both i′−z′ and z′−J) makes them obvious once we obtain J-band images. The J-band follow up has been carried out at several obser-vatories: La Silla (NTT, 3.6m), McDonald (2.7m), Kitt Peak (2.1m), La Palma (NOT, 2.5m), see 2. We adjust our integration times to achieve either a clear detection or a limiting magnitude that excludes any dwarf and demonstrates that the candidate is a high redshift quasar (usually around JAB = 22). For the few
candidates which are not detected at i′ and where we cannot exclude that the object was a supernovae in the z′ image, we integrate deeper to detect the quasar at J. Any supernova has long faded, and cannot be detected at any reasonable depth.
At the NTT, which accounts for most of our J-band follow up, we usually need exposures times of 5 to 10 minutes, obtained as ∼ 40 seconds individual exposures which we jitter to measure and substract the sky background. The typical integration time on 2 meter-class telescope was 30 minutes.
3. Candidate Selection
Since brown dwarfs and high-redshift quasars are extremely red, and since our i′images are only moderately deeper than the z′ ones, some of the most interesting targets are only detected at
z′(i.e. are i′-dropouts). Any unrecognised artefact (cosmic ray impacts, unflagged hot pixel, optical ghost, etc...) in a z′image therefore translates into an invalid brown dwarf/quasar candi-date, since it associates a z′detection with (usually) an i′upper limit. Since brown dwarfs are very rare (∼ 1 per 1 deg2MegaCam
image, which contains from 50 000 to over 300 000 astronomi-cal sources), false detection rates of even 1 per 104real sources
would swamp true brown dwarfs in our candidate lists. We there-fore need to very effectively reject artefacts. Most of these are visually obvious, and we do examine every candidate before scheduling any follow-up observations, but the many hundred 340 Megapixel images which we analyse contain too many arte-facts for this to be a practical first line of defense.
Fortunately, high-redshift quasars (at the resolution of the MegaCam images) and brown dwarfs are point-like. We
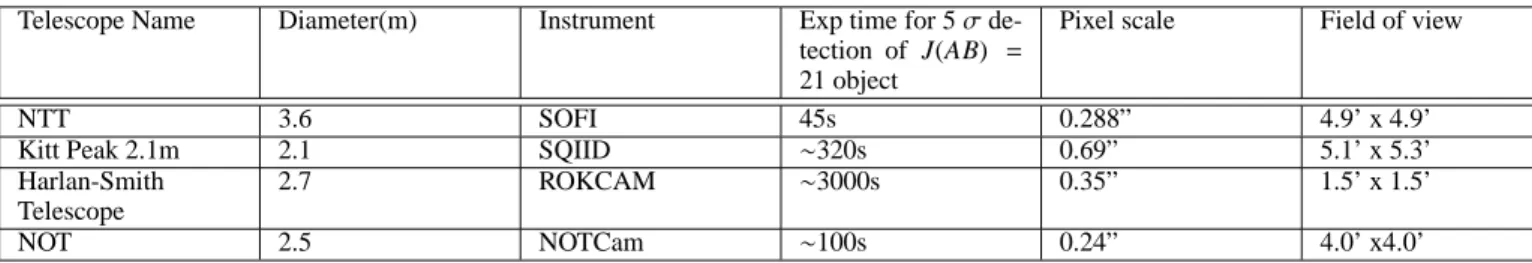
Table 2. Technical characteristics of the telescopes used for the J-band follow up.
Telescope Name Diameter(m) Instrument Exp time for 5 σ de-tection of J(AB) = 21 object
Pixel scale Field of view
NTT 3.6 SOFI 45s 0.288” 4.9’ x 4.9’
Kitt Peak 2.1m 2.1 SQIID ∼320s 0.69” 5.1’ x 5.3’ Harlan-Smith
Telescope
2.7 ROKCAM ∼3000s 0.35” 1.5’ x 1.5’ NOT 2.5 NOTCam ∼100s 0.24” 4.0’ x4.0’
therefore only need to distinguish point-like sources from both artefacts and extended objects, and don’t have to tackle the much more difficult task of separating general astronomical sources from artefacts. Point Spread Function (hereafter PSF) fitting provides an excellent stellarity diagnostic, as well as optimal photometry and astrometry for point sources. It therefore forms the basis of our selection procedure.
3.1. Image analysis
We use the well known SExtractor (Bertin & Arnouts 1996) photometry package, to which two of us (Bertin & Delorme, in preparation) recently added a PSF-fitting module. In keeping with the general SExtractor philosophy, this module implements a dual-image mode, where source positions in a ’detection im-age’ precisely determine where photometry will be extracted in a ’photometry image’. This dual image mode is particularly well matched to the extreme colours of our targets: given the relative depths of the i′and z′images, any object of interest is very ro-bustly detected at z′ but faintly, if at all, at i′. We therefore use the z′image as the detection image for both i′and z′, naturally producing matched catalogues of i′and z′photometry for every object that is well detected at z′, independently of its i′ signifi-cance. This eliminates the delicate task of handling unmatched sources in independent catalogues: those might be weakly de-tected in the i′ image, though with too low a significance for inclusion in any modestly reliable single image i′catalogue, and they therefore cannot validly be handled as pure upper limits.
SExtractor implements simultaneous fitting of multiple PSFs to blended objects, providing accurate parameters for close bi-naries and usable measurements for point-like sources blended with galaxies. The latter is particulary important for the quasar search, since it can recover some lensed quasars which would otherwise be lost to confusion with their lensing galaxy. In ad-dition to more accurate parameters for the affected objects, this better handling of blends produces more complete catalogues in crowded fields. Introducing multiple PSFs recovers ∼ 3% addi-tional sources in the relatively shallow CFHTLS-VW and RCS-2 images, and ∼ 10% in the deeper CFHTLS-Deep images. PSF-fitting also improves the photometric precision by ∼10% over optimum aperture photometry (Bertin & Delorme, in prepara-tion), and it therefore allows us to use slightly deeper catalogues, for another 15% gain in sample size. Since low significance i′ detections provide colours with complex error distributions, we replace them by the 5 σ detection limit on their image and com-pute a lower limit on i′−z′. We note that the resampling involved in the coaddition of images built from multiple exposures, and in the filter to filter alignment, generates noise correlations on scales of 1-2 pixels. Thanks to the generous sampling of our MegaCam images (0.186”/pixel and seeing mostly above 0.6”)
and the use of a Lanczos3 interpolation function, source profiles are negligibly affected (Bertin et al. 2002), but resampling has a measurable low-pass filtering effect on photon noise. As we decided for practical reasons to ignore noise covariances in our fitting, the net effect on photometry is that errors estimates must be multiplied by a factor ∼1.4. That factor is well determined for the CFHTLS-Deep and CFHTLS-Wide images, which are built from a large number of individual exposures, but for the CFHTLS-VW images it significantly varies from field to field according to the sub-pixel relative positions of the 3 coadded exposures.
3.2. Filtering and target selection
We start by requiring a > 10σ detection in the z′ filter and a
i′−z′ >1.7. These criteria without any additional filtering typ-ically yield over 10 000 candidates per RCS-2 1 square degree field. The single exposures per filter used for the RCS-2 sur-vey (and for our follow-up of its fields) are most affected by cosmic ray hits and bad pixels, and the stacked images used in the other components contain fewer such artefacts. Flagging of known bad-pixel positions and simple morphological rejection of cosmic ray hits lowers this number to under 1000, but not to a point where visual examination would be practical.
We then assess the stellarity of each candidate from its SExtractor output parameters to further decrease the number of false detections. After experimenting with several parameter combination, we have converged to the quality of the fit between the image and the PSF model, as summarised by the χ2 of the
residuals, as our main diagnostic. We found that Sextractor’s de-fault stellarity index, based on a specifically trained neural net-work, works well at high signal to noise ratios, but that it be-comes ineffective for the faint objects which dominate our cat-alogues. We similarly found that tests based on comparisons of fluxes through different apertures, or on peak surface brightness versus flux, are always less distinctive than χ2filtering. Since we
currently prefer to visually inspect all final candidates, we very conservatively set our filtering threshold to a level where ∼10% of the candidates are visually acceptable. These filtering criteria typically yield under 50 candidates per square degree. A lower threshold would not very significantly decrease the inspection workload, and might conceivably eliminate a few valid candi-dates. We will probably revisit this tuning as we gain experience with, and confidence in, our selection process.
With our current settings, χ2filtering reduces the number of
artefacts by a factor of 10−15 (figure. 5). Visual inspection of the more than 2000 sources with i′−z′ >1.7 in a 4 square degrees test region showed that χ2filtering rejected none of the 14 valid
point-like sources, and our resolution of the few initial discrep-ancies was always in favour of the χ2filtering diagnostic. Further
the highest χ2measured for valid candidates, and therefore very
conservative.
After this pruning of the initial catalogue to just bona fide point sources, we select candidates with an i′ −z′ criterion. Our synthetic photometry (figure 3) demonstrates that the L dwarf domain begins at i′−z′ >1.45. M dwarfs however, with
i′ −z′ just below 1.45, massively outnumber brown dwarfs in a magnitude-limited sample. Poissonian photometric errors consequently scatter a significant number of M dwarfs into this L dwarf box. We therefore set our colour filtering to
i′−z′ > 1.7, or nominally to later than L4. With M8 and M9 stars having i′−z′ ∼1.35, and assuming gaussian noise at our
z′ S/N limit, this colour threshold eliminates ∼ 95% of these very late M dwarfs. Mid-M dwarfs have i′−z′ ∼ 1.1 and we eliminate ∼ 99.9% of them. Since brown dwarfs are intrinsically much rarer, our candidate list nonetheless has some significant contamination by late-M dwarfs, but at a level which no longer overwhelms our follow-up capacity.
Fig. 5. Histogram of the χ2of the psf fitting residuals. The thick red histogram shows all i′−z′ > 1.7 candidates after basic fil-tering, the medium-thick blue histogram those that additionally survived χ2filtering, and the thin green one the final candidates
retained after visual inspection and supernovae rejection. These histograms show candidates from a 70 deg2test area.
Our final filtering step is to eliminate as many as we can of the candidates which actually are supernovae that were bright at the time of the z′image. All RCS-2 fields have contemporane-ous g′,r′and z′ images, and for supernovae the g’ and r’ im-ages are very significantly deeper than the z′one. We therefore very reliably reject their supernovae by inspecting these g′and r′ images. The CFHTLS-Deep images are stacks of exposures ob-tained over several years, and any supernova is eliminated by the sigma-clipping applied during stacking. The exposures which contribute to our CFHTLS-Wide and CFHTLS-VW z′images, on the other hand, were usually obtained over shorter time spans than the ∼6 weeks (Pain & SNLS Collaboration 2003) timescale of supernovae photometric evolution. We therefore mostly can-not recognize their supernovae based on their photometric vari-ation between the individual exposures, and the exposures in other filters are usually not sufficiently contemporaneous to re-ject them based on a blue instaneous colour. We must therefore handle some supernovae contamination at a later stage.
4. Results
4.1. Candidates
We have so far analysed images for 357 deg2, in which we have
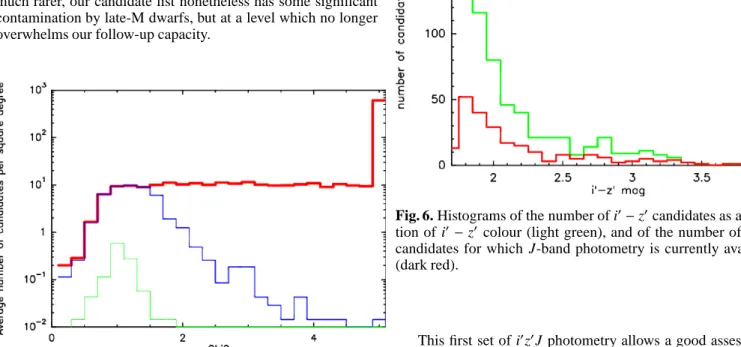
identified 770 brown dwarf and quasar candidates. We have so far extracted J-band photometry for 215 of those, prioritising the reddest candidates (figure 6).
Fig. 6. Histograms of the number of i′−z′candidates as a func-tion of i′−z′colour (light green), and of the number of these candidates for which J-band photometry is currently available (dark red).
This first set of i′z′J photometry allows a good assessment of the actual nature of these 215 candidates. As summarised in Table 3, they include 23 likely T dwarfs, 57 L dwarfs and very late M dwarfs candidates (M8 and M9 dwarfs have very similar
z′−J colours to L dwarfs), and at least 4 high redshift quasars
(published in Willott et al. 2007). 22 targets remain undetected in deep J-band images and are most likely artefacts which our filtering did not catch. 109 objects have z′−J < 1.6 and most of those are likely M dwarf contaminants. Some however have
J-band upper limits which are insufficiently deep to ascertain
whether they are artefacts, quasars or Mid-M dwarfs. Those will need additional follow-up to clarify their status.
Since we prioritised the analysis of the reddest candidates, this first i′z′J sample is strongly biased towards T dwarfs.
Appproximately correcting for this bias, we estimate that
∼40% of our i′ − z′ candidates are actual cool dwarfs, of which ∼ 15% are T dwarfs. The T dwarfs include several with extreme colours, which ongoing spectroscopic observations will characterize further. One, CFBDS J003402-005206, actually is an independent discovery of ULAS J003402.77-005206.7 which Warren et al. (2007) recently identified with the UKIDSS survey (Burningham et al. 2007) as a brown dwarf later than T8 (∼ 650K). Even more recently, we obtained spectroscopic observations of an even cooler brown dwarf (∼ 625K, Delorme et al. 2008) Figure 7 shows several other candidates that are at least as promising, and those are currently queued for near-IR spectroscopy.
Table 3. Preliminary classification of the candidates with J-band photometry
T dwarfs L dwarfs quasars M dwarfs artefacts Number of objects 23 57 4 109 22
Percentage 10.7% 26.5% 1.9% 50.7% 10.2% This classification is based on their position in the i′−
z′
versus z′−
J colour-colour diagram.
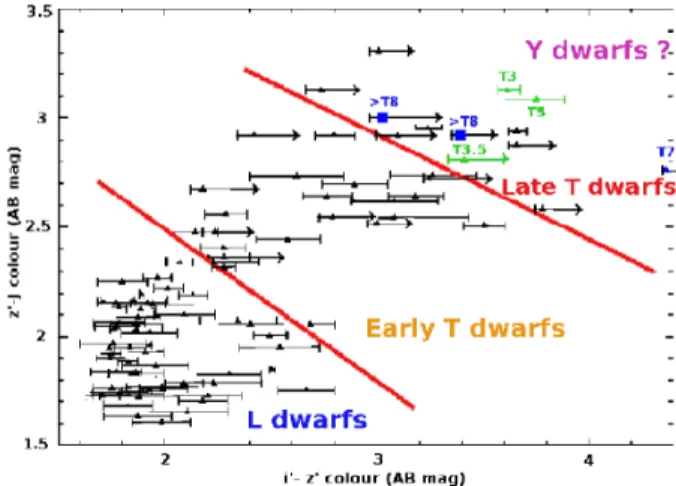
Fig. 7. i′−z′vs z′−J colour-colour diagram of our cool dwarf candidates (black). The error bars are 1 σ when we have i′ and z′ measurements. An arrow is used when i′−z′ is only a lower limit. For clarity, the z′ − J errors are not shown;
they are usually under 0.15 mag. The spectra of the high-lighted T3, T3.5 and T5 objects are presented in this article. The big blue squares represent the coolest brown dwarfs known, ULAS J003402.77-005206.7/CFBDS J003402-005206, recently published by Warren et al. (2007) and independently identified in our survey and CFBDS J005910.83-011401.3, presented in Delorme et al. (2008). The T7 object highlighted here was pub-lished by Chiu et al. (2006) while queued for our CFBDS spec-troscopy. The spectral type domains are based on our synthetic photometry.
4.2. Spectroscopy
We present here near-IR spectroscopic observations of our three first T dwarf candidates, as an illustration of the content of our candidates catalogue. Two, which we originally published in Willott et al. (2005), originate in the CFHTLS-Deep sur-vey and are thus fainter than most of our candidates. The last comes from the Very Wide component of the CFHTLS and is more representative. Cross dispersed spectra were obtained dur-ing semester 2006A with GNIRS (Elias et al. 2006) at Gemini South in Service mode. The slit width of 0.68 arcsec coupled with the short camera and the 31.7 l/mm grating yielded a resolv-ing power of 900, and the spectra have full wavelength coverage between 0.9 and 2.4 microns. A-B (not ABBA) sequences were used, with individual 5-minutes exposures for the brighter target and 10-minutes for the fainter CFHTLS-Deep targets. The total on-source integration time is 30 minutes for CF BDS 193430 − 214221 (JAB= 17.9), 180 minutes for CF BDS 100113 + 022622
(JAB = 19.7) and 200 minutes for CF BDS 095914 + 023655
(JAB = 20.3). The OH sky lines were used for wavelength
cal-ibration, and an A-type star was observed immediately before each sequence for relative flux calibration and telluric
absorp-tion correcabsorp-tion. The spectra were extracted and calibrated using our own IDL procedures.
The reduction proceeds as follows. The sequence of spectral images are flat-fielded using an internal flat taken immediately after the science frames. The five useful cross-dispersed orders are then extracted in five individual images that are corrected for distortion in the spectral dimension. For most objects, the trace is too faint over many wavelengths intervals to determine trace position, so its curvature is derived from the reference star spec-trum. These individual order frames are then pair-subtracted, ef-fectively removing most of the sky, dark current and hot pixels contributions. Each frame is then collapsed along the spectral di-mension to determine the positive and negative traces positions. We then extract the spectra using positive and negative extraction boxes that have identical but opposite integrals; this minimizes the contribution from residual sky line that would remain from the pair subtraction. The same operation is performed on the A0 telluric calibration star. Spectra derived from individual image pairs are then median-combined into final target and calibration star spectra. A telluric absorption spectrum is then derived using the calibration star spectra. A black body spectrum with a tem-perature of 10 000 K is assumed for the A0 stars and hydrogen-lines are interpolated over. The target spectrum is then divided by the derived telluric transmission spectrum. A first order wave-length calibration is obtained from an argon-lamp spectrum, and fine-tuned by registering the bright OH-lines obtained from a sum of the pair of images of interest. Table 4 summmarizes the properties of the 3 objects.
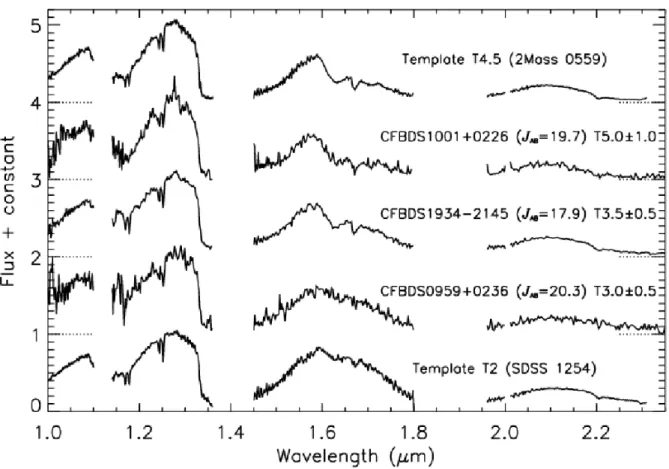
The spectra (figure. 8) confirm that all three candidates with spectroscopic observations are T-dwarfs. We determined their spectral types using the Burgasser et al. (2006) spectral indices. Table 5 lists thoses indices and the corresponding spectral type. We retain as our prefered determination the “weighted” spec-tral types, rounded to the closest half-integer. These “weighted” spectral types take into account the better sensitivity of those indices that vary most for a given subtype range. The reddest target, CFBDS100113+022622 (i′−z′ > 4.2), turn out to be a T5±1 dwarf, and its 45 to 110 parsecs photometric distance makes it one of the farthest mid/late-T dwarf currently known. The large uncertainty on its distance is dominated by the spec-tral type uncertainty and the >1 dimming between T4 and T6 dwarfs,(Vrba et al. 2004), with photometric uncertainties con-tributing less than 5%. However, the absolute magnitudes of mid-T dwarfs are themselves uncertain by as much as 1 mag-nitude (see for instance Liu et al. 2006). The faintest of the three dwarfs, CFBDS095914+023655 (i′−z′ > 3.6) turns out to have an earlier spectral type, T3, but lies even farther, be-tween 120 and 130 parsecs. The indices of the brighest one, CFBDS193430-214221 (i′−z′>3.4), indicate a T3.5±0.5 spec-tral type. The specspec-tral type uncertainties are derived from the scatter between the estimates from the various spectral indices.
5. Conclusion
Our survey has to date found 23 T dwarf candidates, 57 L or very-late M dwarf candidates, and 4 high redshift quasars, out of 215 candidates with i′, z′and J magnitudes. These were drawn from a larger sample of 770 candidates with i′ and z′ magni-tudes, found in 357 deg2 of i′and z′MegaCam images. Taking into account our prioritising of the reddest candidates for J-band observations, we expect that complete follow-up of these 770 candidates will yield ∼45 T dwarfs and 200 L dwarfs. Scaling to our final ∼ 800 deg2of shallow surveys, RCS-2+Very Wide,
then predicts ∼ 100 T dwarfs and over 450 L or very late-M dwarfs, approximately doubling the number of known brown dwarfs. Our analysis of the CFHTLS-Deep and CFHTLS-Wide surveys has, and will, yield additional candidates at large dis-tances, which will constrain the galactic scale height of brown dwarfs. We plan to obtain spectra for the most exciting of these many brown dwarfs, and expect that the large discovery volume will produce even cooler objects than our recent T9/Y0 discov-ery, described in Delorme et al. (2008).
Appendix A: Finding Charts
Acknowledgements. Thanks to the queue observers at CFHT and Gemini who
obtained data for this paper (Gemini program GS-2006A-Q-16). Thanks to JJ Kavelaars for advice on planning our MegaCam observations in the CFHTLS Very Wide and to Howard Yee and the RCS-2 team for making their proprietary data available. This research has made use of the VizieR catalogue access tool, of SIMBAD database and of Aladin, operated at CDS, Strasbourg.
References
Bertin, E. & Arnouts, S. 1996, A&AS, 117, 393
Bertin, E., Mellier, Y., Radovich, M., et al. 2002, in Astronomical Society of the Pacific Conference Series, Vol. 281, Astronomical Data Analysis Software and Systems XI, ed. D. A. Bohlender, D. Durand, & T. H. Handley, 228–+ Boulade, O., Charlot, X., Abbon, P., et al. 2003, in Presented at the Society
of Photo-Optical Instrumentation Engineers (SPIE) Conference, Vol. 4841, Instrument Design and Performance for Optical/Infrared Ground-based Telescopes. Edited by Iye, Masanori; Moorwood, Alan F. M. Proceedings of the SPIE, Volume 4841, pp. 72-81 (2003)., ed. M. Iye & A. F. M. Moorwood, 72–81
Burgasser, A. J., Geballe, T. R., Leggett, S. K., Kirkpatrick, J. D., & Golimowski, D. A. 2006, ApJ, 637, 1067
Burgasser, A. J., Kirkpatrick, J. D., Burrows, A., et al. 2003, ApJ, 592, 1186 Burgasser, A. J., Kirkpatrick, J. D., Lepine, S., et al. 2004, American
Astronomical Society Meeting Abstracts, 205,
Burgasser, A. J., Wilson, J. C., Kirkpatrick, J. D., et al. 2000, AJ, 120, 1100 Burningham, B., Pinfield, D., Leggett, S. K., et al. 2007, in American
Astronomical Society Meeting Abstracts, Vol. 210, American Astronomical Society Meeting Abstracts, 69.03–+
Chabrier, G. 2001, ApJ, 554, 1274
Chiu, K., Fan, X., Leggett, S. K., et al. 2006, AJ, 131, 2722 Cruz, K. L., Reid, I. N., Kirkpatrick, J. D., et al. 2007, AJ, 133, 439 Delfosse, X., Tinney, C. G., Forveille, T., et al. 1997, A&A, 327, L25 Delfosse, X., Tinney, C. G., Forveille, T., et al. 1999, A&AS, 135, 41 Delorme, P., Delfosse, X., Albert, L., et al. 2008, A&A(in press), 802 Elias, J. H., Joyce, R. R., Liang, M., et al. 2006, in Presented at the Society
of Photo-Optical Instrumentation Engineers (SPIE) Conference, Vol. 6269, Ground-based and Airborne Instrumentation for Astronomy. Edited by McLean, Ian S.; Iye, Masanori. Proceedings of the SPIE, Volume 6269, pp. 62694C (2006).
Epchtein, N., de Batz, B., Capoani, L., et al. 1997, The Messenger, 87, 27 Fan, X., Strauss, M. A., Richards, G. T., et al. 2001, AJ, 121, 31 Fukugita, M., Ichikawa, T., Gunn, J. E., et al. 1996, AJ, 111, 1748 Geballe, T. R., Saumon, D., Leggett, S. K., et al. 2001, ApJ, 556, 373 Golimowski, D. A., Leggett, S. K., Marley, M. S., et al. 2004, AJ, 127, 3516 Hawley, S. L., Covey, K. R., Knapp, G. R., et al. 2002, AJ, 123, 3409 Kendall, T. R., Delfosse, X., Mart´ın, E. L., & Forveille, T. 2004, A&A, 416, L17 Kirkpatrick, J. D., Reid, I. N., Liebert, J., et al. 1999, ApJ, 519, 802
Kirkpatrick, J. D., Reid, I. N., Liebert, J., et al. 2000, AJ, 120, 447 Knapp, G. R. et al. 2004, Astron. J., 127, 3553
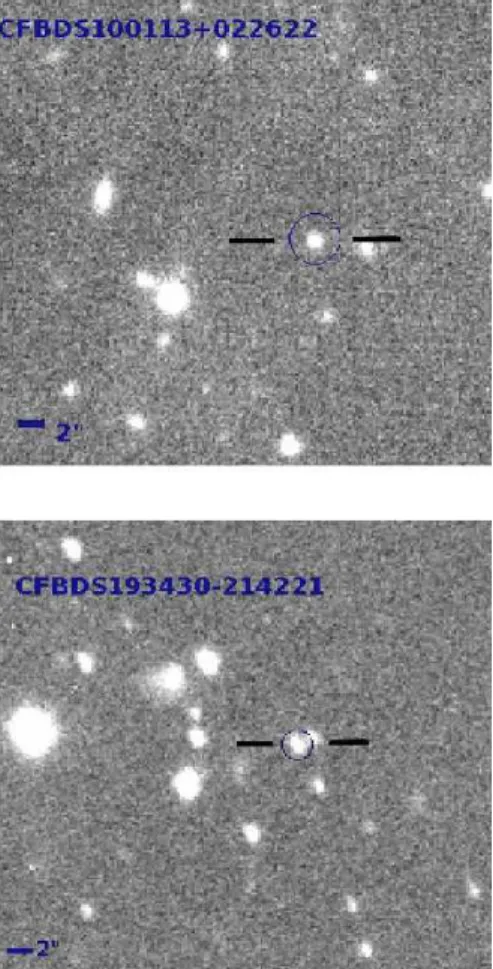
Fig. A.1. Finding charts from z′band images of the 3 T dwarfs whose spectra are presented in this article. The fields are 45” × 45”north is up, east is left
L´epine, S., Rich, R. M., & Shara, M. M. 2003, ApJ, 591, L49
Lawrence, A., Warren, S. J., Almaini, O., et al. 2007, MNRAS, 379, 1599 Leggett, S. K., Hauschildt, P. H., Allard, F., Geballe, T. R., & Baron, E. 2002,
MNRAS, 332, 78
Liu, M. C., Leggett, S. K., Golimowski, D. A., et al. 2006, ApJ, 647, 1393 Lodieu, N., Pinfield, D. J., Leggett, S. K., et al. 2007, ArXiv e-prints, 705 Magnier, E. A. & Cuillandre, J.-C. 2004, PASP, 116, 449
Mart´ın, E. L., Delfosse, X., Basri, G., et al. 1999, AJ, 118, 2466
McLean, I. S., McGovern, M. R., Burgasser, A. J., et al. 2003, ApJ, 596, 561 Nakajima, T., Oppenheimer, B. R., Kulkarni, S. R., et al. 1995, Nature, 378, 463 Pain, R. & SNLS Collaboration. 2003, in Bulletin of the American Astronomical
Society, Vol. 35, Bulletin of the American Astronomical Society, 1335–+ Rebolo, R., Zapatero-Osorio, M. R., & Martin, E. L. 1995, Nature, 377, 129
Scholz, R.-D., McCaughrean, M. J., Lodieu, N., & Kuhlbrodt, B. 2003, A&A, 398, L29
Skrutskie, M. F., Cutri, R. M., Stiening, R., et al. 2006, AJ, 131, 1163 Strauss, M. A., Fan, X., Gunn, J. E., et al. 1999, ApJ, 522, L61 Vrba, F. J., Henden, A. A., Luginbuhl, C. B., et al. 2004, AJ, 127, 2948 Warren, S. J., Mortlock, D. J., Leggett, S. K., et al. 2007, MNRAS, 381, 1400 Willott, C. J., Delfosse, X., Forveille, T., Delorme, P., & Gwyn, S. D. J. 2005,
ApJ, 633, 630
Willott, C. J., Delorme, P., Omont, A., et al. 2007, ArXiv e-prints, 706 Yee, H. K. C., Gladders, M. D., Gilbank, D. G., et al. 2007, ArXiv Astrophysics
e-prints
York, D. G., Adelman, J., Anderson, Jr., J. E., et al. 2000, AJ, 120, 1579
List of Objects ‘ULAS J003402.77-005206.7’ on page 1 ‘CFBDS J005910.83-011401.3’ on page 1 ‘ULAS 0034’ on page 2 ‘ULAS 0034’ on page 2 ‘CFBDS J003402-005206’ on page 7 ‘ULAS J003402.77-005206.7’ on page 7 ‘ULAS J003402.77-005206.7’ on page 8 ‘CFBDS J005910.83-011401.3’ on page 8 ‘CF BDS 193430 − 214221’ on page 8 ‘CF BDS 100113 + 022622’ on page 8 ‘CF BDS 095914 + 023655’ on page 8 ‘CFBDS100113+022622’ on page 8 ‘CFBDS095914+023655’ on page 8 ‘CFBDS193430-214221’ on page 8
Table 4. Observational properties of the three T dwarfs whose spectra are presented here.
Name RA DEC JAB z′AB−JAB i′AB−z
′
AB Spectral Type Distance Range(pcs)
CFBDS100113+022622 10:01:13.1 +02:26:22.3 19.7 3.1 3.75 T5±1 45-110 CFBDS193430-214221 19:34:30.4 -21:42:21.0 17.9 2.8 >3.4 T3.5±.5 38-48 CFBDS095914+023655 09:59:14.8 +02:36:55.2 20.3 3.1 3.7 T3.0±.5 120-130
Table 5. Spectral indices and the resulting spectral types
Spectral Index CFBDS100113+022622 CFBDS193430-214221 CFBDS095914+023655 CH4−J 0.43 - T5.2 0.59 - T2.9 0.57 - T3.2
H2O−H 0.46 - T3.0 0.48 - T2.7 0.45 - T3.1
CH4−H 0.40 - T5.7 0.63 - T3.9 0.79 - T3.0
CH4−K 0.27 - T4.7 0.34 - T4.1 0.54 - T3.0
Average Spectral Type T4.6±1.2 T3.4±0.7 T3.1±0.1 Weighted Spectral Type T5.0 T3.6 T3.1
Final Spectral Type T5.0±1 T3.5±0.5 T3.0±0.5 Spectral types are derived from Burgasser et al. (2006) spectral indices.
Fig. 8. GNIRS near-IR spectra of the three T Dwarfs observed on Gemini-South. The two fainter targets originate from the CFHTLS-Deep, while the brighter ones comes from the CFHTLS-VW. Templates of spectral types T2 and T4.5 from McLean et al. (2003) are shown for comparison. All spectra are normalised at 1.26 microns and displayed with integer offsets for clarity.