HAL Id: hal-01845624
https://hal.archives-ouvertes.fr/hal-01845624
Submitted on 26 Aug 2018
HAL is a multi-disciplinary open access
archive for the deposit and dissemination of
sci-entific research documents, whether they are
pub-lished or not. The documents may come from
teaching and research institutions in France or
abroad, or from public or private research centers.
L’archive ouverte pluridisciplinaire HAL, est
destinée au dépôt et à la diffusion de documents
scientifiques de niveau recherche, publiés ou non,
émanant des établissements d’enseignement et de
recherche français ou étrangers, des laboratoires
publics ou privés.
Origin of Pr 3+ luminescence in hafnium silicate films:
combined atom probe tomography and TEM
investigations
Rémi Demoulin, Georges Beainy, Celia Castro, Philippe Pareige, Larysa
Khomenkova, Christophe Labbé, Fabrice Gourbilleau, Etienne Talbot
To cite this version:
Rémi Demoulin, Georges Beainy, Celia Castro, Philippe Pareige, Larysa Khomenkova, et al.. Origin
of Pr 3+ luminescence in hafnium silicate films: combined atom probe tomography and TEM
inves-tigations. Nano Futures, IOPScience, 2018, 2 (3), pp.2. �10.1088/2399-1984/aad009�. �hal-01845624�
Origin of Pr
3+
luminescence in hafnium silicate
films: combined
atom probe tomography and TEM investigations
Rémi Demoulin1, Georges Beainy1, Célia Castro1, Philippe Pareige1, Larysa Khomenkova2,3 ,
Christophe Labbé2, Fabrice Gourbilleau2and Etienne Talbot1
1 Normandie Univ, UNIROUEN, INSA Rouen, CNRS, Groupe de Physique des Matériaux, 76000 Rouen, France 2 Normandie Univ, ENSICAEN, UNICAEN, CEA, CNRS, CIMAP, 14000 Caen, France
3 Present address: V. Lashkaryov Institute of Semiconductor Physics at the National Academy of Sciences of Ukraine, 45 Prospekt Naury,
Kyiv 03028, Ukraine.
E-mail:etienne.talbot@univ-rouen.fr
Keywords: hafnium silicates, rare-earth ions, atom probe tomography, photoluminescence, phase transformation
Abstract
Structural, chemical, and luminescence properties of Pr
3+-doped HfSiO
xlayers fabricated by
radio-frequency magnetron sputtering were examined as a function of annealing temperature. Phase
separation between SiO
2and HfO
2as well as the location of Pr
3+dopants were investigated using
atom probe tomography and transmission electron microscopy while optical properties of Pr
3+ions
were studied using photoluminescence measurements. As a result,
(i) we evidenced the location of the
Pr
3+dopants in the HfO
2phase while the SiO
2phase was discovered to be free of these dopants,
(ii) the
HfO
2phase was identified to crystallize in the cubic phase until 1050 °C annealing, (iii) no Pr clusters
were detected as function of annealing, and
(iv) luminescence properties were discussed in regard to
the location of Pr in the HfO
2cubic phase.
1. Introduction
Hafnium silicates(HfSiOx) are considered as one of the most promising highly dielectric materials to replace SiO2in complementary metal–oxide semiconductor technology [1]. This can be ascribed to their good thermal and chemical stabilities on Si wafer, their wide optical bandgap(5.7 eV), and their high refractive index [1–3].
Moreover, due to their lower phonon frequencies compared to SiO2, these HfSiOxmatrices are expected to be suitable hosts for efficient activation of rare-earth (RE) optical emission. Finally, because of the large bandgap of HfSiOx, which makes it transparent in the UV to IR range, this material is a promising host matrix for optical applications. RE ions are frequently used for light-emitting devices due to the variety of electronic levels allowing us to tune optical emission in the UV to IR range[4,5]. Nevertheless, only a few studies have been performed on
RE-doped HfSiOx, with particular attention on Er
3+-dopedfilms [6–11]. The structural properties of these materials at the nanoscale level were investigated by transmission electron microscopy(TEM) [7,9], which
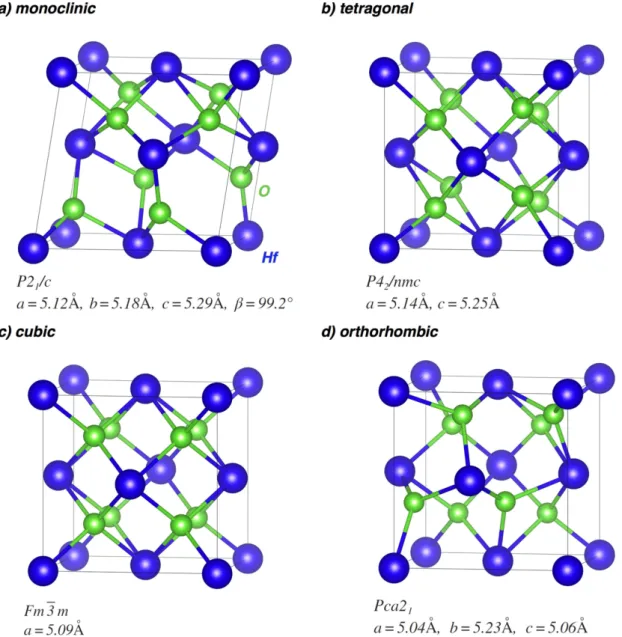
enabled us to reveal a phase separation between an amorphous SiO2and a tetragonal HfO2phase caused by high annealing temperature. Pure HfO2can exist in four crystalline phases, as presented infigure1, depending on the conditions(temperature, pressure, etc). The most stable phase formed at normal conditions (ambient pressure and temperature lower than 1700°C) is the monoclinic one (m-HfO2P21/c, figure1(a)), whereas the tetragonal (t-HfO2P42/nmc, figure1(b)) and cubic (c-HfO2F 3m m,figure1(c)) phases of pure HfO2appear at high temperatures[12,13]. However, the orthorhombic phase (o-HfO2Pca21,figure1(d)) has also been observed at room temperature in Si, Al, and Gd-doped HfO2[14]. As can be seen from figure1, similarity exists between the different phases. Moreover, metastable tetragonal or cubic phases can also be stabilized at room temperature by doping the HfO2matrix with RE atoms, as recently demonstrated for Ce-doped HfO2nanoparticles[10] and La-doped HfO2films [11]. The tetragonal HfO2phase was also confirmed by XRD in the Er3+-doped SiO2–HfO2 waveguide[8]. It was proposed that the introduction of RE3+ions both in HfO2and HfSiOxchanges the coordination number of Hf4+cations, which can be substituted by RE3+ions in the lattice with a formation of vacancies in the oxygen sublattice[10,15,16].
Recently, the luminescence of Pr3+ions in the visible spectral range was observed in the Pr-doped HfSiOx layer produced by magnetron sputtering[17]. A maximum of luminescence intensity was obtained for a 1000 °C
annealing, and the signal was attributed to an efficient excitation by oxygen vacancies located in the HfO2phase. The structural properties were investigated by FTIR, XRD, and TEM, showing the phase separation between the HfO2and SiO2phases after such a high annealing temperature as well as the crystalline nature of the HfO2phase similar to that in Er3+-doped HfSiOxfilms [6–9]. However, the knowledge of an accurate atomic structure of the hosting material, particularly the local environment of Pr3+ions, can be important to improve and optimize Pr-based photonic devices. In this paper, we investigate the effects at the atomic scale of annealing temperature on the structure of Pr-doped HfSiOxthinfilms produced by magnetron sputtering, using atom probe tomography (APT) and TEM.
2. Experimental section
2.1. Sample preparationPr3+-doped HfSiOxwas deposited on top of(100) 250 μm thick 2″ Si wafers by radio-frequency magnetron co-sputtering of a pure 4″ HfO2target(99.9% Testbourn Ltd.) topped by calibrated 1 cm2Si and Pr6O11chips. Prior to the deposition run, the deposition chamber was maintained at a vacuum of 10−7torr; during the run, the plasma pressure wasfixed at 1.5 mTorr. Note that due to the geometry of the chamber, the substrate holder was not rotating. Before deposition, the substrates were subjected to standard RCA cleaning, dipped in a diluted 10%
Figure 1. Polymorph structures of(a) monoclinic, (b) tetragonal, (c) cubic, and (d) orthorhombic HfO2phases. Hf atoms(big) are
HF solution, dried in N2, and then transferred to the deposition chamber. Thefilms were fabricated with a radio-frequency power density of 0.98 W cm−2in a pure Ar plasma, and a substrate temperature of 25°C. The
optimized deposition conditions were determined on the basis of previous works done on similar Er-doped systems[6,18]. Finally, an annealing treatment was performed under a N2flow at temperatures varying from 800°C up to 1050 °C for 1 h.
2.2. Structural and chemical characterization
Chemical and structural analyses of the samples annealed at 800°C, 950 °C, and 1050 °C were achieved by APT using a laser-assisted wide-angle tomographic atom probe(LAWATAP-Cameca). APT is a three-dimensional (3D) high-resolution analytic microscopy that allows the spatial mapping of atoms in a sample. The APT process is based on thefield evaporation of surface atoms from the tip-shaped sample with a curvature radius lower than 50 nm. Tips were prepared using a dual beam Zeiss NVision 40 FIB-SEM, by employing the lift-out and annular milling method[19]. APT experiments were conducted by applying UV femtosecond laser pulses (λ=343 nm)
with a pulse energy of 20nJ, in an analysis chamber under a vacuum of 10−10mbar. The APT data were reconstructed and analyzed using the Groupe de Physique des Matériaux’s data treatment code. Cross-section TEM samples were prepared by mechanical polishing and Ar ion milling procedures. High-resolution TEM (HRTEM), selected area electron diffraction (SAED), scanning TEM (STEM), high angle annular dark field (HAADF), and electron energy loss spectroscopy (EELS) were performed on a field emission probe Cs
aberration-corrected JEOL-ARM200F operating at 200 kV. EELS was performed on a GIF Quantum(Gatan) in a DUAL-EELS mode allowing us to simultaneously acquire the zero loss peak and the chosen signal. In this way any energy shift occurring during the acquisition could be corrected.
2.3. Photoluminescence(PL) measurements
PL experiments were carried out using a Jobin Yvonfluorolog spectrometer. The excitation source was a 450 W xenon arc lamp, and all spectra recorded at room temperature were corrected of the spectral response of the system.
3. Results and discussion
3.1. PL propertiesThe PL spectra in the UV to NIR spectral range registered for Pr-doped HfSiOxfilms as a function of annealing temperature are shown infigure2. A more detailed investigation of PL and PL excitation spectra has already been performed and can be found in[17]. PL signals of Pr3+ions were observed only after annealing atTA
950°C as sharp PL peaks associated with characteristic intra-4f transitions of Pr3+ions(see the inset of figure2).
ForTA 950°C, the spectra show a strong luminescence intensity at 487 nm corresponding to the
characteristic3P03H4transition of Pr3+ions. The highest Pr3+luminescence was detected for TA=1000 °C. The increase in intensity with the annealing temperature rising from 800°C to 1000 °C can be attributed to the decrease in the nonradiative recombination rates during the annealing process. At higher temperatures(TA > 1000 °C), in addition to the intensity decrease, it is interesting to observe some slight modifications in the PL
Figure 2. PL spectra of the Pr-doped HfSiOxfilms annealed at different temperatures (TA=800 °C to 1100 °C). The excitation
spectra. In fact, the position of the principal peak of emission redshifts from 487 nm at TA=1000 °C to 492 nm at TA=1100 °C. Moreover, the peak associated with the3P03H4transition at 503 nm splits into three different peaks, and the two peaks issued from the1D23H4transition at 612 and 623 nm become one peak centered at 617 nm at 1050°C. All of these changes in PL spectra can be caused by the structural evolution of the matrix during the annealing process and principally by a significant evolution of the environment of Pr3+ions. In fact, the formation of Pr clusters as it was observed for other RE elements in a silica matrix[20,21], or the
crystallization of the HfO2phase in the matrix involving the modification of the crystal field near Pr3+ions at high temperature, can affect the optical properties of the materials. To understand the origin of the
modifications observed in the PL spectra, a thorough study of the microstructure is required. 3.2. APT results
The atom probe mass spectrum obtained for the Pr-doped HfSiOxsample annealed at 1050°C is shown in figure3. All the mass peaks are well identified in term of species and charged states except the peak at 16 amu
(16O). In fact, the real origin of this peak in metal–oxide matrices is still unclear; it could be identified as the evaporation of O+or O22+ions, or a mix of both. For instance, in SiO2matrices it was shown that O atoms were mainly evaporated in the form ofO22+[22], whereas in Fe2O3metallic oxide these atoms were identified as O+ [23]. As a consequence, the real origin of this16O peak seems to be strongly dependent on the nature of the metal–oxide matrix. Therefore, in the case of a bi-phased system, here composed of SiO2and HfO2, the16O peak origin can be different depending on the phase. One case of the HfSiOxmatrix has already been studied by an atom probe[24]. It was shown that the use of theO22+form could give the compositions of the SiO2and HfO2 phases that are expected in these kinds of systems. The precise nature of this peak will be discussed after HfO2 phase identification by TEM. Concerning the other species, Si is detected as Si+, Si2+, and Si3+, and as molecular ions SiO+, SiO2+,SiO2+, andSiO22+. Besides, we can see that Hf elements are mainly detected as molecular ions HfO2+, HfO3+, andHfO22+. Finally, Pr ions are identified as Pr2+, Pr3+, and PrO2+. Moreover, we detected a peak at 53.5 amu, which can be attributed to the molecular ions ZrO2+. This observation, also detected in STEM-EDS analysis(not shown here), can be explained by the presence of Zr traces in the HfO2target, and appeared in all analyzed samples. No Ga ions were detected, indicating that there was no Ga implantation during the FIB milling process of the tip preparation, which could damage the microstructure. The mean chemical composition of samples was computed from mass spectra by considering the two possibilities for the16O peak, and is reported in table1.
As we can see, the chemical nature of this peak does not significantly impact the composition of the sample. This can be explained by the large number of O atoms that are evaporated in the form of molecular ions during the experiment(figure3). Finally, considering previous studies made on HfSiOxby APT[24,25], further
Figure 3. Mass spectrum collected by APT experiment on Pr-doped HfSiOxfilm annealed at 1050 °C.
Table 1. Atomic concentration of Si, O, Hf, and Pr atoms depending on the nature of the
16O peak.
HfSiOx:Pr @ 1050°C Si(at.%) O(at.%) Hf(at.%) Pr(at.%)
if16O=O+ 2
2 14.1±0.3 70.6±0.4 12.0±0.3 3.3±0.1
calculations will take into account this16O peak asO22+. No difference in the overall concentration has been observed as a function of the annealing temperature.
As predicted by the pseudo-binary phase diagram, and as it has been previously evidenced, a phase separation between SiO2and HfO2phases can occur in the HfSiOxlayer under annealing[25–28]. To deeply investigate this effect, the nature of phases formed, as well as the location of Pr3+ions in the sample, we used APT to study the influence of annealing temperature on the structure.
The 3D isoconcentration surfaces representing the spatial distribution of Si(corresponding to Si+, Si2+, and Si3+ions), HfO (corresponding to HfO2+and HfO3+ions),16O,O+2, and Pr(corresponding to Pr2+and Pr3+ ions) elements in the Pr-doped HfSiOxlayer annealed at 1050°C are shown in figures4(a) to (d). The
isoconcentration maps of Si and HfO(figure4(a)) highlight the phase separation between Si-rich and Hf-rich
phases forming two interconnected phases upon the annealing treatment. The distribution of Si and Pr (figure4(b)) reveals that Pr atoms are located outside of the Si-rich phase. Moreover, as we can observe by
investigating the isoconcentration maps of the two oxygen peaks(O+2 and16O) in regards to the spatial location of the Si-rich and HfO-rich phases infigures4(c) and (d),O+2 ions are mainly detected outside the Si-rich phase (figure4(c)) whereas16O are identified outside the Hf-rich phase. These results allow us to conclude that oxygen
atoms were evaporated in different ways from these two different phases. This highlights a difference in the environment of O atoms between the two phases present in the system as well as a difference in the evaporation field, with a lower evaporation field required to evaporate the Hf-rich phase. Otherwise, this result confirms that the nature of the16O peak can be different according to the phase. Figure4(e) represents the isoconcentration
maps performed on a slice in the previous 3D volume. It shows the distribution of Si, HfO, Pr,16O, andO+2 in the Pr-doped HfSiOxlayer annealed at 1050°C. All these elements are nonhomogeneously distributed in the
Figure 4. 3D isoconcentration surfaces for Pr-doped HfSiOxfilm annealed at 1050 °C. 3D isosurfaces of (a) Si (red) and HfO (blue),
(b) Si (red) and Pr (brown), (c) Si andO+
2(green), and (d) HfO and16O(green) concentrations are represented in a volume of
15×15×55 nm3. Thresholds are XSi=30 at.%, XHfO=20 at.%,X16O=33at.%,XO+2=27at.%, and XPr=2 at.%. (e)
Isoconcentration slices extracted from the selected region, for each map the volume is 15×15×0.65 nm3,α and β represent Si-rich
analyzed volume, as displayed infigures4(a)–(d). As shown in figure4(a), two regions can be clearly identified
corresponding to Si-rich and Hf-rich phases, respectively namedα and β in figure4(e). The presence of these
two phases is governed by the HfSiOxdecomposition upon annealing, which should befinalized by the formation of SiO2and HfO2as proved by several studies[25–29]. Besides, it has been evidenced that the decomposition of the HfSiOxlayers occurs in the form of a spinodal decomposition[28,30], which is consistent with the 3D isoconcentration surfaces observed infigure4(a). Moreover, regarding the distribution of Pr
elements in the volume(figure4(e)), these atoms clearly appear to be located in Hf-rich phases. A similar
behavior of RE dopant atoms has already been mentioned in the case of Er-doped SiO2–HfO2[7], which explained that Er atoms can diffuse into HfO2nanocrystals after heat treatment, leading to an improvement of the luminescence signal. The same maps were investigated on Pr-doped HfSiOxlayers annealed at 800°C and 950°C (not shown here), but these maps did not reveal a significant evolution of the phase decomposition or of a change in dopant location during the annealing process.
In order to confirm and quantify the nonhomogeneous distribution of atoms in the volume upon annealing, statistical tests of randomness described by Thuvander et al[31] were performed to observe the evolution of the
atomic distribution upon sample annealing. Results of these tests for the distribution of Si, HfO, and Pr ions in the layers annealed at 800°C, 950 °C, and 1050 °C are presented in figures5(a), (b), and (c), respectively. The
goal of the statistical test of randomness is to compare the standard error(s) of the frequency distribution of an element(Si, HfO, and Pr) extracted from APT reconstruction to the standard deviation (σ) of the binomial distribution(case of randomness distribution). In the case of a homogeneous (random) distribution of elements in the material, both s andσ curves must be superimposed. All graphs represented in figure5show that s andσ curves are not superimposed, and confirm that these three elements, Si, HfO, and Pr, are nonhomogeneously distributed in the analyzed volume; however, their evolution according to annealing seems to be different. In fact, for Si and HfO distributions, we can notice an up-shift of the s-curve while the temperature increases from 800°C to 1050 °C (figures5(a), (b)). As a result, the distribution of ions is more homogeneous at the lower
annealing temperature. This reveals an evolution of the matrix during the annealing treatment from 800°C to 1050°C, which should correspond to a progressive phase separation between SiO2and HfO2phases observed in HfSiOx. In the case of Pr atoms(figure5(c)), we can first observe an up-shift for the s-curve when the annealing temperature rises from 800°C to 950 °C, and then see a down-shift of the s-curve when the temperature increases from 950°C to 1050 °C. The first step can be explained by considering the demixing of Si-rich and HfO-rich zones and the formation of a Pr-rich area(located in Hf-rich phases, as evidenced previously in figure4). The second stage can be ascribed to a redistribution of Pr atoms located in the Hf-rich phases. This
result reveals a modification of Pr3+ions’ environment between the samples annealed at 950 °C and 1050 °C, which could induce a change in the optical activities of these ions as was observed in the PL spectra shown in figure2(a). Up to now, no Pr clusters have been evidenced in the matrix. Consequently, the change of Pr3+ion
Figure 5. Statistical tests of randomness of(a) Si ions, (b) HfO ions, and (c) Pr ions distributions in Pr-doped HfSiOxfilms annealed at
emission should be due to an evolution of the microstructure of the Hf-rich phase and the environment of Pr3+ ions.
In order to define the microstructure of these materials accurately, it can be helpful to focus on the composition of each phase. The composition profiles in the analyzed volumes were computed in the films annealed at 950°C and 1050 °C, and are presented in figures6(a), (b), (c), and (d) respectively. As mentioned
above, the composition of Si and Hf vary along the length according to the phase separation of Si-rich and HfO-rich phases. The concentration of Pr atoms reaches a maximum of 4 at.% in the Hf-HfO-rich phase, and is almost zero in the Si-rich phase. Moreover, the distance between the cores of each type of phase(wavelength of the
decomposition) varies from 8 to 10 nm for both samples. The mean chemical composition of Si-rich and Hf-rich zones was determined by placing small boxes of 2×2×2 nm3in the core of each zone in the entire volume. By counting the number of atoms of each species present in the boxes, a mean value of the composition of Si-rich and Hf-rich phases can be computed. The mean composition of Si-rich phase for the samples annealed at 950°C and 1050 °C are, respectively, XSi=31.3±3.2 at.% and XO=68.7±3.2 at.%, and
XSi=29.9±3.0 at.% and XO=70.1±3.0 at.%; this can be attributed unambiguously to the SiO2phase. Regarding the Hf-rich phase, we can observe infigures6(a) and (c) 7 to 11 at.% of Si is counted in these zones.
This suggests that the phase separation between SiO2and HfO2is still in progress. In fact, pseudo-binary phase diagrams of the SiO2–HfO2system[32,33] highlights the existence of a third compound, HfSiO4. Then, depending on the mole fraction of SiO2and HfO2, the phase separation from HfSiOxto x.SiO2+(1−x).HfO2 is realized, passing through an intermediate stage composed of SiO2and HfSiO4or HfO2and HfSiO4. However, at this temperature(T ∼ 1000 °C), the separation between the two phases should be in an advanced state. In this case, the presence of Si atoms is unexpected in the Hf-phase and could be considered as an artifact of the APT analysis. Since a difference in evaporationfield exists between silica and hafnia, the composition measurements of a such complex nanometric structure(figure4(a)) can be altered because of the well-known effect of local
magnification [34] that can occur in bi-phased systems. Otherwise, this effect was previously evidenced in
similar material[24,25]. The raw and corrected (from the local magnification effect) mean compositions of
Hf-rich phases was computed in the samples annealed at 950°C and 1050 °C. Results are reported in table2. There was no significant evolution of the composition of Hf-rich phases between these two samples. In each case, the nature of the Hf-rich phase could not directly be attributed to HfSiO4nor HfO2. Finally, none of these results allowed us to extract with accuracy the stoichiometry of the Hf-rich phase from APT analysis, but they confirmed the favored location of Pr atoms in this Hf-rich phase.
Figure 6. Composition profile computed on Pr-doped HfSiOxannealed at(a), (b) 950 °C, and (c), (d) 1050 °C. (a), (c) Matrix
composition(Si, Hf ,and O) and (b), (d) Pr composition. The sample volumes are, respectively, (a), (b) 2×2×20 nm3and(c), (d) 2×2×25 nm3.
3.3. SAED and HRTEM results
In order to elucidate the nature of the Hf-rich phase and to confirm the location of Pr3+ions, we performed TEM analysis on the HfSiOx–Pr samples annealed at 950 °C and 1050 °C. Figure7shows a cross sectional HRTEM image of the HfSiOx–Pr sample annealed at 1050 °C. The micrograph shows a nanocrystalline structure in thisfilm and the formation of two interfacial layers (ILs). The observed dark and bright regions can be explained by the phase separation between Si-rich and Hf-rich phases already evidenced in the APT
experiments(figure4). The Hf-rich phase is clearly crystallized. These observations are consistent with previous
investigations on phase separation of the HfSiOxmatrix, and were predicted by a phase diagram[24,26,32]. Based on the observed contrast, we can expect that thefirst IL (bright region, SiOx–IL), with a thickness of 4 nm, contains no or very little Hf, and deals with SiOxor SiO2. The second one seems more concentrated in Hf atoms (Hf-rich IL of about ∼3 nm). Similar IL formation has already been evidenced and identified by TEM and APT experiments on HfSiOxgrown by magnetron sputtering[24]. The sample annealed at 950 °C presents a similar micrograph(not shown here).
The nature of the crystalline phase present in samples annealed at 950°C and 1050 °C was examined from SAED patterns(figures8(a) and (b)). For both annealed samples, the four main diffraction rings of the SAED
pattern can be indexed with the cubicfluorite type structure of HfO2(space groupF 3m m). The dhklspacing extracted from these SAED are 2.89Å, 2.51 Å, 1.76 Å, and 1.49 Å for the 950 °C annealed sample, and 2.85 Å, 2.50Å, 1.75 Å, and 1.48 Å for the 1050 °C annealed sample. In both cases, the dhklspacings can be assigned to the(111), (200), (220), and (311) lattice planes of the cubic HfO2phase(PDF 00-053-0550). No significant crystallographic phase transition is observed with the annealing treatment between 950°C and 1050 °C. This result is also demonstrated by previous XRD experiments where HfO2phases were wrongly determined to be
Table 2. Mean atomic concentration of Si, O, Hf, and Pr atoms in Hf-rich phases.
HfSiOx:Pr Si(at.%) O(at.%) Hf(at.%) Pr(at.%)
950°C 9.0±1.1 71.5±1.7 15.6±1.3 3.9±0.7 1050°C 7.9±1.1 73.5±1.6 16.1±1.4 2.5±0.6
Correction of local magnification effect
950°C 0 73.2±1.9 21.4±1.8 5.4±1.0 1050°C 0 75.7±1.8 21.1±1.7 3.2±0.7
Figure 7. Cross sectional HRTEM micrograph of the HfSiOx–Pr sample annealed at 1050 °C oriented according the [011] zone axis of
the Si substrate. SiOxIL denotes the thin(∼4 nm) SiO2layer at the interface with the Si substrate. Hf-rich IL denotes the Hf-rich IL
tetragonal[17]. It should be noted that an ambiguity can exist in indexing the HfO2XRD pattern where tetragonal and cubic phases can present a very similar pattern. As mentioned previously, RE-doped HfO2can present a cubic crystallographic phase. Based on the results described above, we can assume that this mechanism is similar in Pr-doped HfSiOxfilms where (i) spinodal decomposition leads to the formation of HfO2-rich and SiO2-rich nanocrystalline phases and(ii) Pr3+ions stabilize the cubic phase of the HfO2for an annealing temperature between 950°C and 1050 °C. Previous XRD and SAED experiments on the 1100 °C sample have shown that an increase in annealing temperature can induce a phase transformation to the monoclinic phase[17].
SAED and HRTEM experiments allow us to conclude that the Hf-rich phase identified with APT deals with HfO2and that the Si atoms detected inside the Hf-rich phase(figure6) are only due to the local magnification artifact occurring during APT experiments. It should be noted that the observed phases after decomposition (SiO2and HfO2) do not deal with those predicted by the HfO2–SiO2phase diagram(HfO2+HfSiO4or
SiO2+HfSiO4) or with the thermodynamic computation of a ternary Hf–Si–O diagram [32]. Moreover, no sign of the formation of Pr silicates(mainly Pr2Si2O7) has been observed.
3.4. HAADF-STEM and EELS study
The phase separation in Hf-rich and Si-rich interconnected structures occurring with annealing was confirmed by a combined HAADF-STEM and EELS experiments. The HAADF image, sensitive to the Z-contrast, of the 950°C annealed sample is presented in figure9(a). The micrograph exhibits high-Z (bright) and low-Z (dark)
regions, which can be attributed to HfO2-rich(bright) and SiO2-rich(dark) phases. This result was confirmed by an EELS line scan profile performed over bright and dark areas from point A to point B (figure9(a)). Figures9(b)
and(d) present the EELS line scan and extracted EELS spectra in the SiO2-rich and HfO2-rich phases in the O–K edge region. Both contrasted zones contain oxygen with a characteristic signal of an O–K edge around 540 eV. Moreover, we note a low energy loss shift of the O–K edge in the bright region (for depths between 2–5 nm, 9–13 nm, and 17–22 nm (figure9(d)), which confirms the chemical difference between dark and bright regions.
Such a shift has already been evidenced between SiO2and HfO2phases[24,35]. The Pr–M4,5EELS spectrum is depicted infigure9(c), and a typical EELS spectrum (extracted from HfO2-rich regions infigure9(c)) is presented infigure9(e). The Pr EELS signal, characterized by the typical two M5and M4white lines, is only present in the bright region(i.e. the HfO2-rich region). Moreover, the M5and M4peaks are located at 932eV and 951 eV, which is in agreement with the EELS signal of Pr ions[36]. The intensity ratio between M5and M4lines, which is directly related to the number of electrons in the f shell, is measured to beIM5 IM4~1.4. This ratio is a direct signature of the presence of Pr3+ions as well as the damping of shoulders at the lower energy side of the M4 peak. In the case of Pr in the 4+ valence state, the intensity ratio should be close to unity and damping of the shoulder should occur at the higher energy side of the M5peak[36–38]. This result allows us to conclude unambiguously that Pr ions are preferentially located in the HfO2-rich region, as already evidenced in the APT results and in the form of Pr3+.
3.5. Discussion
Numerous studies on undoped HfSiOxsystems have shown that the structural evolution of HfSiOxthin layers under annealing is strongly dependent on the initial composition of the layer, but all of them agree that the phase decomposition occurring in these HfSiOxlayers should end on a bi-phased system composed of an amorphous SiO2phase and crystalline HfO2phase[24,26–29]. Moreover, it has been shown by APT experiments that Si nanocrystals can grow in Si-rich HfSiOxthinfilms [24,25]. Here, the Pr3+doping of the HfSiOxthin layers does not seem to affect the phase separation mechanism compared to the undoped HfSiOxsystem. APT analyses and TEM experiments have shown the phase separation, which began at 800°C (figure5), between Si-rich and
Hf-rich phases; these results are attributed to SiO2-rich and HfO2-rich phases, respectively. Contrary to the RE3+ doping of SiOxmatrices for which a precipitation of RE ions in the form of clusters was evidenced in the case of Er3+and Ce3+doping by the formation of RE silicates[20,39], the presence of Pr3+ions in the matrix does not lead to the formation of Pr oxides or Pr silicates during the annealing process at high temperature. We observed that Pr3+ions tend to diffuse into the HfO2-rich phase from the beginning of the phase decomposition, and are already present in the HfO2-rich phase at 800°C. At higher annealing temperatures (950 °C and 1050 °C), there is no significant evolution in the structure of the matrix in 3D mapping, and Pr3+ions remain located in the HfO2-rich phase(figures4and9). However, statistical testing (figure5) revealed a more homogeneous distribution of Pr3+in the host matrix after a 1050°C annealing treatment than after 950 °C annealing. This redistribution of Pr3+in the HfO2-rich phase can be explained by a local modification of the Pr3+environment provided by the crystallization of the HfO2-rich phase at high temperature. The presence of a crystalline form of HfO2in HfSiOx–Pr thin layers has been evidenced via SAED patterns and TEM experiments (figures7and8), and has been attributed to the cubicfluorite type structure of HfO2of space groupF 3m m. This crystalline phase appeared only for annealing temperatures higher than 950°C. The thin film of HfO2usually crystallizes in the monoclinic form, which is the most stable structure of the HfO2crystallized state at low temperatures(around 500°C) [40,41]. Several studies on RE-doped HfO2have made similar observations by highlighting the stabilization of the cubic HfO2phase[10,11,15,42,43]; this was observed here with SAED patterns (figure8). The incorporation of RE dopants that have an ionic radius larger than that of Hf4+cations tends to stabilize the cubic form of HfO2. According to the literature, the sevenfold coordination of Hf4+cations is favored in the monoclinic structure[41]. However, the incorporation of RE3+ions in the crystal lattice changes the coordination number of Hf4+cations from sevenfold to eightfold, and leads to the stabilization of the cubic HfO2form. Moreover, the Hf4+cations can be substituted by RE3+ions in the lattice; this substitution is followed by the formation of oxygen vacancies in order to maintain the electroneutrality of the crystal lattice and help stabilize the cubic crystalline phase[15]. The presence of these oxygen vacancies in the host matrix can
introduce some defect states in the bandgap of HfO2[44,45], which leads to the formation of recombination centers required for the excitation of electron–hole pairs. Pr3+ions do not present an absorption band around 285 nm, and consequently, the direct excitation of Pr3+ions is not allowed with the 285 nm wavelength used to
Figure 9.(a) HAADF-STEM image of cross-section lamellae on Pr-doped HfSiOxfilms annealed at 950 °C. EELS spectrum 2D image
from a line scan(indicated by an arrow in (a)) of (b) the O–K edge and (c) the Pr–M4and Pr–M5edges. EELS spectra extracted from
establish PL spectra(figure2). This confirms the presence of an efficient energy transfer between Pr3+ions and the host matrix. Considering that Pr3+ions are mainly located in the cubic HfO2phase, as proved by APT experiments(figure4(e)) and confirmed by the EELS spectrum (figure9(c)), and due to the overlapping of
created defect states and absorption levels of Pr3+ions, excitons can transfer their energy to Pr3+ions and improve the PL emission. In this way, the enhancement of PL intensity observed from TA=950 °C to
TA=1000 °C, can be explained by the growth and stabilization of the cubic HfO2phase providing more oxygen vacancies in that HfO2crystalline phase. At a higher temperature some new diffraction peaks appear on XRD spectra[17], revealing the development of a monoclinic HfO2phase. The cubic to monoclinic transformation could occur in an optically inactive configuration of Pr3+ions, thus leading to the quenching of PL emission.
4. Conclusion
The structure of HfSiOx–Pr thin layers elaborated by magnetron sputtering was investigated by APT and TEM experiments. The phase separation between SiO2and HfO2has been highlighted forTA 800°C. The
introduction of Pr3+in HfSiOxdoes not lead to the formation of Pr clusters in the host matrix even at high temperature. However, Pr3+ions tend to diffuse in the HfO2phase from the beginning of the phase separation. At high temperature, during the crystallization of the HfO2phase, the substitution of Hf4+by Pr3+leads to stabilization of the cubic crystalline form of HfO2and allows the formation of oxygen vacancies to ensure the electroneutrality of the crystal lattice. These oxygen vacancies, seen as defect states in the bandgap of HfO2, are efficient sensitizers for the excitation of Pr3+ions, and permit the energy transfer between Pr3+ions and the cubic HfO2phase.
Acknowledgments
G Beainy acknowledgesfinancial support from the Région Haute-Normandie.
ORCID iDs
Larysa Khomenkova https://orcid.org/0000-0002-5267-5945 Etienne Talbot https://orcid.org/0000-0001-6389-1670
References
[1] Choi J H, Mao Y and Chang J P 2011 Development of hafnium based high-κ materials–a review Mater. Sci. Eng., R72 97–136
[2] He G, Zhu L, Sun Z, Wan Q and Zhang L 2011 Integrations and challenges of novel high-κ gate stacks in advanced CMOS technology Prog. Mater. Sci.56 475–572
[3] Wilk G D, Wallace R M and Anthony J M 2001 High-κ gate dielectrics: current status and materials properties considerations J. Appl. Phys.89 5243
[4] Fujii M, Yoshida M, Kanzawa Y, Hayashi S and Yamamoto K 1997 1.54 μm photoluminescence of Er3+doped into SiO 2films
containing Si nanocrystals: evidence for energy transfer from Si nanocrystals Appl. Phys. Lett.71 1198–200
[5] Li J, Zalloum O H Y, Roschuk T, Heng C L, Wojcik J and Mascher P 2008 Light emission from rare-earth doped silicon nanostructures Adv. Opt. Technol.2008 295601
[6] Khomenkova L, An Y-T, Khomenkov D, Portier X, Labbé C and Gourbilleau F 2014 Spectroscopic and structural investigation of undoped and Er3+doped hafnium silicate layers Phys. B453 100–6
[7] Righini G C et al 2009 Er3+-doped silica-hafniafilms for optical waveguides and spherical resonators J. Non. Cryst. Solids355 1853–60
[8] Minati L, Speranza G, Micheli V, Ferrari M and Jestin Y 2009 X-ray photoelectron spectroscopy of Er3+-activated SiO
2-HfO2
glass-ceramic waveguides J. Phys. D: Appl. Phys.42 15408
[9] Jestin Y et al 2007 Erbium activated HfO2based glass-ceramics waveguides for photonics J. Non. Cryst. Solids353 494–7
[10] Gálvez-Barboza S, González L A, Puente-Urbina B A, Saucedo-Salazar E M and García-Cerda L A 2015 Preparation and characterization of Ce-doped HfO2nanoparticles J. Alloys Compd.643 S62–6
[11] Smirnova T P, Yakovkina L V and Borisov V O 2015 Impact of lanthanum on the modification of HfO2films structure J. Rare Earths33 857–62
[12] Wang J, Li H P and Stevens R 1992 Hafnia and hafnia-toughened ceramics J. Mater. Sci.27 5397–430
[13] Tang J, Zhang F, Zoogman P, Fabbri J, Chan S-W, Zhu Y, Brus L E and Steigerwald M L 2005 Martensitic phase transformation of isolated HfO2, ZrO2, and HfxZr1−xO2(0<x<1) nanocrystals Adv. Funct. Mater. 15 1595–602
[14] Park M H, Schenk T, Fancher C M, Grimley E D, Zhou C, Richter C, LeBeau J M, Jones J L, Mikolajick T and Schroeder U 2017 A comprehensive study on the structural evolution of HfO2thinfilms doped with various dopants J. Mater. Chem. C5 4677–90
[15] Matović B, Bučevac D, Prekajski M, Maksimović V, Gautam D, Yoshida K and Yano T 2012 Synthesis and characterization of nanometric yttrium-doped hafnia solid solutions J. Eur. Ceram. Soc.32 1971–6
[16] Yong-Qiang M, Zheng-Tang L, Li-Ping F and Shuai C 2014 Influence of rapid thermal annealing on the structure and electrical properties of Ce-doped HfO2gate dielectric Chin. Phys. Lett.31 77702
[17] An Y T, Labbé C, Khomenkova L, Morales M, Portier X and Gourbilleau F 2013 Microstructure and optical properties of Pr3+-doped
[18] Khomenkova L, An Y-T, Labbé C, Portier X and Gourbilleau F 2012 Hafnia-based luminescent insulator for phosphor applications ECS Trans.45 1119–128
[19] Thompson G B, Miller M K and Fraser H L 2004 Some aspects of atom probe specimen preparation and analysis of thin film materials Ultramicroscopy100 25–34
[20] Talbot E, Lardé R, Pareige P, Khomenkova L, Hijazi K and Gourbilleau F 2013 Nanoscale evidence of erbium clustering in Er-doped silicon-rich silica Nanoscale Res. Lett.8 39
[21] Debieu O, Bréard D, Podhorodecki A, Zatryb G, Misiewicz J, Labbé C, Cardin J and Gourbilleau F 2010 Effect of annealing and Nd concentration on the photoluminescence of Nd3+ions coupled with silicon nanoparticles J. Appl. Phys.108 113114
[22] Roussel M, Talbot E, Pareige P and Gourbilleau F 2013 Influence of the supersaturation on Si diffusion and growth of Si nanoparticles in silicon-rich silica J. Appl. Phys.113 063519
[23] Bachhav M, Danoix F, Hannoyer B, Bassat J M and Danoix R 2013 Investigation of O-18 enriched hematite (α-Fe2O3) by laser assisted
atom probe tomography Int. J. Mass Spectrom.335 57–60
[24] Talbot E, Roussel M, Genevois C, Pareige P, Khomenkova L, Portier X and Gourbilleau F 2012 Atomic scale observation of phase separation and formation of silicon clusters in Hf higk-κ silicates J. Appl. Phys.111 103519
[25] Talbot E, Roussel M, Khomenkova L, Gourbilleau F and Pareige P 2012 Atomic scale microstructures of high-κ HfSiO thin films fabricated by magnetron sputtering Mater. Sci. Eng. B177 717–20
[26] Khomenkova L, Dufour C, Coulon P-E, Bonafos C and Gourbilleau F 2010 High-κ Hf-based layers grown by RF magnetron sputtering Nanotechnology21 095704
[27] Stemmer S, Li Y, Foran B, Lysaght P S, Streiffer S K, Fuoss P and Seifert S 2003 Grazing-incidence small angle x-ray scattering studies of phase separation in hafnium silicatefilms Appl. Phys. Lett.83 3141–3
[28] Kim H and Mcintyre P C 2002 Spinodal decomposition in amorphous metal–silicate thin films: phase diagram analysis and interface effects on kinetics J. Appl. Phys.92 5094
[29] Lucovsky G, Rayner G B, Kang D, Hinkle C L and Hong J G 2004 A spectroscopic study distinguishing between chemical phase separation with different degrees of crystallinity in Zr(Hf) silicate alloys Surf. Sci.566-568 772–6
[30] Lysaght P, Foran B, Stemmer S, Bersuker G, Bennett J, Tichy R, Larson L and Huff H R 2003 Thermal response of MOCVD hafnium silicate Microelectron. Eng.69 182–9
[31] Thuvander M, Andrén H-O, Stiller K and Hu Q-H 1998 A statistical method to detect ordering and phase separation by APFIM Ultramicroscopy73 279–85
[32] Shin D, Arróyave R and Liu Z-K 2006 Thermodynamic modeling of the Hf-Si-O system Calphad30 375–86
[33] Maria J-P, Wickaksana D, Parrette J and Kingon A I 2002 Crystallization in SiO2–metal oxide alloys J. Mater. Res.17 1571–9
[34] Vurpillot F, Bostel A and Blavette D 2000 Trajectory overlaps and local magnification in three-dimensional atom probe Appl. Phys. Lett.
76 3127–9
[35] Agustin M P, Bersuker G, Foran B, Boatner L A and Stemmer S 2006 Scanning transmission electron microscopy investigations of interfacial layers in HfO2gate stacks J. Appl. Phys.100 024103
[36] Lopez-Cartes C, Bernal S, Calvino J J, Cauqui M A, Blanco G, Perez-Omil J A, Pintado J M, Helveg S and Hansen P L 2003 In situ transmission electron microscopy investigation of Ce(iv) and Pr(iv) reducibility in a Rh (1%)/Ce0.8Pr0.2O2−xcatalyst Chem. Commun. 0 644–5
[37] Manoubi T, Colliex C and Rez P 1990 Quantitative electron energy loss spectroscopy on M45 edges in rare earth oxides J. Electron Spectrosc. Relat. Phenom.50 1–18
[38] Thole B T, van der Laan G, Fuggle J C, Sawatzky G A, Karnatak R C and Esteva J-M 1985 3d x-ray-absorption lines and the 3d94fn+1
multiplets of the lanthanides Phys. Rev. B32 5107–18
[39] Beainy G, Weimmerskirch-Aubatin J, Stoffel M, Vergnat M, Rinnert H, Pareige P and Talbot E 2017 Correlation between the nanoscale structure and the optical properties of Ce-doped SiO1.5thinfilms J. Lumin.191 88–91
[40] Nishide T, Honda S, Matsuura M and Ide M 2000 Surface, structural and optical properties of sol-gel derived HfO2films Thin Solid
Films371 61–5
[41] Štefanić G and Musić S 2001 Thermal behavior of the amorphous precursors of the HfO2-Fe2O3system Thermochim. Acta373 59–67
[42] Mendoza-Mendoza E, Quintero-García J S, Puente-Urbina B A, Rodríguez-Fernández O S and García-Cerda L A 2017 Synthesis and characterization of Ce-doped HfO2nanoparticles in molten chlorides J. Alloys Compd.692 448–53
[43] Chen S, Liu Z, Feng L, Che X and Zhao X 2014 Effect of ytterbium inclusion in hafnium oxide on the structural and electrical properties of the high-κ gate dielectric J. Rare Earths32 580–4
[44] Xiong K, Du Y, Tse K and Robertson J 2007 Defect states in the high-dielectric-constant gate oxide HfSiO4J. Appl. Phys.101 024101
[45] Kumar S, Rai S B and Rath C 2018 Monoclinic to cubic phase transformation and photoluminescence properties in Hf1−xSmxO2


![Figure 7. Cross sectional HRTEM micrograph of the HfSiO x – Pr sample annealed at 1050 ° C oriented according the [ 011 ] zone axis of the Si substrate](https://thumb-eu.123doks.com/thumbv2/123doknet/12955933.376336/9.892.320.687.316.693/figure-cross-sectional-micrograph-annealed-oriented-according-substrate.webp)


