HAL Id: hal-00505002
https://hal.archives-ouvertes.fr/hal-00505002
Submitted on 4 Nov 2010HAL is a multi-disciplinary open access archive for the deposit and dissemination of sci-entific research documents, whether they are pub-lished or not. The documents may come from
L’archive ouverte pluridisciplinaire HAL, est destinée au dépôt et à la diffusion de documents scientifiques de niveau recherche, publiés ou non, émanant des établissements d’enseignement et de
Crack front pinning by design in planar heterogeneous
interfaces
D. Dalmas, E. Barthel, D. Vandembroucq
To cite this version:
D. Dalmas, E. Barthel, D. Vandembroucq. Crack front pinning by design in planar heterogeneous interfaces. Journal of the Mechanics and Physics of Solids, Elsevier, 2009, 57 (3), pp.446-457. �10.1016/j.jmps.2008.11.012�. �hal-00505002�
Crack front pinning by design in planar
heterogeneous interfaces
D. Dalmas
a,∗, E. Barthel
aand D. Vandembroucq
baUnit´e Mixte CNRS/Saint-Gobain ”Surface du Verre et Interfaces” UMR 125,
Saint-Gobain Recherche, BP 135, F-93303, Aubervilliers, Cedex, France.
bLaboratoire PMMH, UMR 7636 CNRS/ESPCI/Paris 6/Paris 7
10 rue Vauquelin, F-75231 Paris cedex 05, France
Abstract
The propagation of an interfacial crack front along the weak plane of a thin film stack is considered. A simple patterning technique is used to create a toughness con-trast within this perfectly two-dimensional weak interface. The transparency of the specimens allows us to directly observe the propagation of the purely planar crack obtained during a DCB (Double Cleavage Beam) test. The effect on the crack front morphology of macroscopic unidimensional patterns in the direction of propagation is studied. In these weak pinning conditions, the geometry of the front quantitatively agrees with the first order expansion proposed by Gao and Rice (H. Gao and J.R. Rice, J.Appl.Mech., 56:828-838, 1989) which accounts for the effect of the interfacial crack front geometry on the stress intensity factor.
Key words: Crack pinning, Interfacial fracture, Toughening, Heterogeneous brittle
interface, Thin films
PACS: 62.25Mm, 62.20.mt, 68.35.Gy
1 Introduction
Due to their brittleness, materials such as glass, ceramics or rock are very sensitive to the presence of bulk and surface defects (Lawn, 1993). When submitted to mechanical loading, those defects represent weak points from which a crack can be initiated. Hence, they can be responsible for the failure of the material.
∗ Corresponding author
In this context, the reinforcement of brittle materials has been a subject of interest for decades.
In brittle matrix composites, fibers can activate toughening processes such as crack-trapping or crack-bridging (Evans, 1990). Beyond the case of brittle bulk materials, the toughening of brittle interfaces has recently become of interest since in many industrial fields, new functions of the material (optical, thermal, self-cleaning etc.) are obtained via the deposition of a stack of thin layers of nanometric thickness.
The previous example and many others have reinforced the growing inter-est of physicists and mechanicians in fracture of heterogeneous materials and reinforcement mechanisms (Herrmann and Roux, 1990; Chakrabarti and Ben-guigui, 1997; Curtin, 1998; Alava et al., 2006)
The mechanisms of crack trapping and bridging by tough particles have re-ceived special interest in the recent years. In the case of two-phase materials with a well defined geometry, a complete theoretical analysis was proposed by Bower and Ortiz (Bower and Ortiz, 1991) and subsequently tested by Mower and Argon (Mower and Argon, 1995).
For the more general case of heterogeneous materials, the toughness varies from place to place which complicates the prediction and understanding of crack propagation. Following the observation of Mandelbrot et al (Mandelbrot et al., 1984), it appears that rough surfaces obtained by crack propagation in heterogeneous materials exhibit self affine properties (Bouchaud, 1997). The roughness of a crack surface can be viewed as the trace of the crack front during propagation. The apparent universality of roughness exponents characterizing
the crack surfaces (Bouchaud et al., 1990; M˚aløy et al., 1992) motivated
the development of statistical physics models exhibiting a critical transition. Among these models, the description of crack trapping (Gao and Rice, 1989; Perrin and Rice, 1994) as a depinning transition has received a special in-terest (Schmittbuhl et al., 1995; Ramanathan and Fisher, 1997; Ramanathan et al., 1997; Ramanathan, 1998). Such models based upon the competition between the destabilizing effect of toughness disorder on the front and the smoothing effect of the crack front elasticity could be developed thanks to previous mechanical studies dealing with the effect of the crack front geom-etry on the stress intensity factors along two-dimensional fronts (Rice, 1985) and three-dimensional fronts (Willis and Movchan, 1995; Movchan and Willis, 1995; Willis and Movchan, 1997). The latter expressions which are obtained
via first order perturbative calculations introduce in the expression of the local
stress intensity factor a non local kernel to account for the elasticity of the front line.
by Gao and Rice (Gao and Rice, 1989), the study of crack front propagation in heterogeneous media has received an increasing interest. Unfortunately, most of these works are theoretical; the lack of experimental studies to test the relevance of crack propagation models is due to the fact that in most cases the direct observation of a crack front during propagation is impossible. More-over, using indirect techniques to localize the front position such as acoustic emission is not relevant because the spatial resolution is not high enough. In 1995, Daguier et al (Daguier et al., 1995) have proposed a technique, which injects ink into the crack during propagation, hence allowing them to study crack propagation in a randomly heterogeneous media. In 1997, Schmittbuhl
and M˚aløy (Schmittbuhl and M˚aløy, 1997) studied the propagation of a quasi
in-plane crack through a transparent Plexiglas block. In their experiment, a random toughness pattern is obtained by sandblasting the surface of two Plexiglas plates before merging them in order to create a rough heterogeneous weak interface. Recently, Charles et al (Charles et al., 2004, 2006) applied crack pinning theory to study indentation crack arrest statistics in different brittle materials. In all previous experimental works, the randomness of the toughness field leads to a very rough crack front morphology which does not allow analyzing the individual contribution of each component of the tough-ness field and only a statistical analysis of the results is possible (scaling invariance, roughness exponent, crack arrest statistics...). In 1995, Mower and Argon (Mower and Argon, 1995) presented an experimental study of tough-ening by second-phase particle introduced in a brittle epoxy. They were able to test the individual influence of each particle on the crack front morphology. However, in their experiments the crack does not penetrate in the soft particles made of Nylon or polycarbonate leading to a process of crack trapping which can not be easily described in the framework of the crack pinning models. Re-cently, Tadepalli et al (Tadepalli et al., 2008) studied the effects of patterning on the interface toughness of Cu-Cu bonds. They show the influence of the orientation of the unidirectional patterns (lines) on the macroscopic tough-ness of their samples. However the opacity of their Cu films inhibits a detailed study of the local crack front morphology during propagation.
The research presented herein is an experimental study of purely interfacial crack propagation in the presence of very simple, macroscopic, and fully de-scribed heterogeneous toughness field. We will try to capture the individual contribution of each components of the toughness field by analyzing the crack front morphology in the framework of the crack pinning theory. For this pur-pose, a specific experimental device was developed. The main advantages of this set-up are: (1) a direct observation of the crack front morphology is pos-sible due to the transparent samples; (2) the crack is resstricted to a strictly planar geometry because propagation occurs at the weakest interface of a thin multilayer stacking. We will show that designing specific heterogeneous inter-face allows modifying and controlling the crack front morphology. To illustrate the capabilities of this experimental approach of crack pinning, we will present
and analyse the modification of front morphology induced by two very sim-ple macroscopic toughness fields with only two components. The first one is a single wide line and the second one is a network of parallel thin lines. In these two weak pinning configurations, we should observe constant front mor-phology during propagation of the crack in the pinning regions (Roux et al., 2003). We will show that it is possible to describe quantitatively the crack front morphology in the framework of the first order perturbative analysis initially proposed by Gao and Rice (Gao and Rice, 1989).
2 Crack pinning theory: The Gao and Rice approach
In homogeneous media, since the pioneering work of Griffith (1920) and Irwin (1957), it is very well known that crack propagation occurs if the stress
inten-sity factor (K) is at least equal to the toughness (Kc) of the material. Kcis an
intrinsic parameter of the material which describes the stress concentration at the crack tip. K depends on the geometry of the crack and on the external loading.
If a heterogeneous toughness field is introduced in the material, the front morphology is modified because it is pinned in the region of higher toughness. As a consequence, this roughness of the front modifies the value of the stress intensity factor all along the front. Thus, the fracture criterion can not keep its global expression but has to become local in order to be verified at each point of the front. To take into account the interaction between the local toughness disorder and the elasticity of the front, Rice and Gao performed a first order perturbative analysis (Rice, 1985; Gao and Rice, 1989). This analysis leads to the following relation between the local morphology of a crack front, h(x),
and the local value of the stress intensity factor Kel(x, h(x)):
Kel(x, h(x)) = K0 1 + 1 2π +∞Z −∞ h(x) − h(x0) (x − x0)2 dx 0 , (1)
where K0 is the macroscopic equivalent stress intensity factor defined with
the same loading and a straight crack having the same mean position. This expression thus allows us to write a local criterion of propagation:
Kel(x, h(x)) ≥ Kc(x, h(x)) . (2)
It is very important to note that this theory was developed to study the propagation of a purely plane crack in a semi-infinite media. Hence the crack has no roughness in the direction perpendicular to the propagation plane.
Depending on the heterogeneous toughness field morphology, two pinning regimes can be observed (Roux et al., 2003). The first one, called the weak pinning regime, is observed when the toughness variation in the crack prop-agation direction is very smooth. In this case, the crack front propprop-agation is regular and the entire toughness field in front of the tip is explored. The second regime, called the strong pinning, is observed when the toughness variation in the crack direction is rapid. In this case, the propagation is due to successive instabilities (stick-slip regime) and only the highest toughness value influences the propagation. In this paper, we will focus on the weak pinning regime by introducing toughness patterns characterizes by a constant toughness in the direction of propagation.
3 Experimental procedure
The specific set-up we have developed allows us to control and monitor planar crack propagation in optically transparent samples with a weak patterned interface by using a DCB cleavage test (Double Cleavage Beam).
3.1 Description of the multilayered coated samples
Samples are multi-layer thin films with a weak interface due to the presence of a silver layer in the stacking. Layers are deposited on a 2.3mm thick float glass substrate by magnetron sputtering using an in-line sputtering system. The sequence of layers is glass/sublayer/Zno/Ag/ZnO/overlayer giving a global thickness of about 80nm. All the layers within the multilayer are deposited in-line, without breaking the vacuum, with a pre-sputter time of 3 minutes. Further details on sample preparation can be found in Barthel et al. (Barthel et al., 2005).
3.2 Cleavage test principle
To perform the cleavage test, a glass backing with the same thickness as the substrate is glued on a coated sample (Fig. 1). The glue is a two-components
epoxy which was prepared as specified by the manufacturer and cured at 80◦C
for 45 min. After curing the glue, the sample is carefully re-cut and polished into its final rectangular shape so as to remove glue spill-outs.
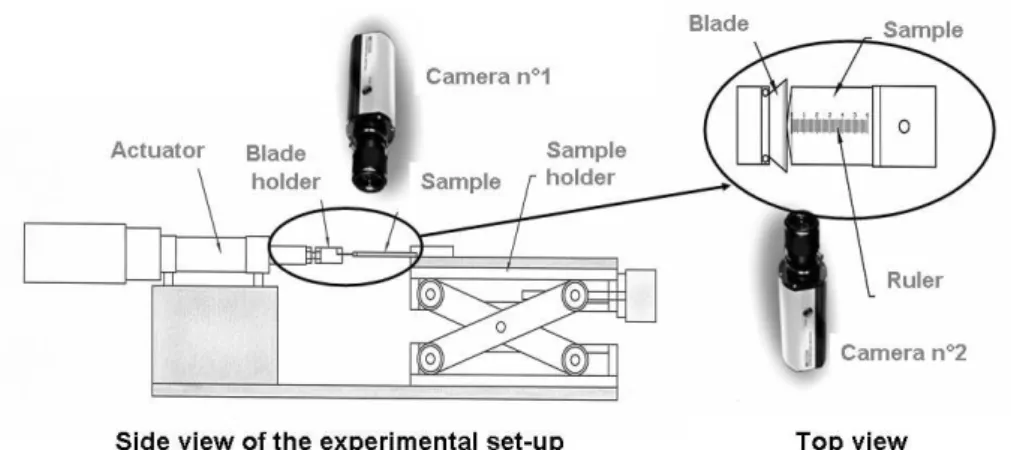
The cleavage fracture of the samples is performed in house ambient conditions on a DCB (Double Cleavage Beam) set-up developed in our laboratory (Fig. 2).
Fig. 1. Schematic principle of the cleavage test.
Fig. 2. Schematic view of the cleavage experimental set-up.
Two high magnification CCD cameras give us simultaneously a top view and a side view of the DCB sample. The cleavage of the sample is controlled by a step by step introduction of a razor blade of triangular shape. The blade is moved by an actuator (Fig. 2), allowing for precise positioning. Hence, we are able to finely control the opening displacement of the arms of the DCB sample (Fig. 1). The crack initiation is achieved by pressing the blade onto the glue joint at the tip edge. Wherever the crack starts, it is quickly moving to the weakest interface of the multilayer, which is energetically favorable. Actually, it has been shown that the interface below the silver layer has a very weak adhesion compared with all other interfaces of the sample (Barthel et al., 2005). Due to viscous relaxation in the glue, it takes a few minutes for the crack position to stabilize. A typical waiting time of about 15 min is allowed for between each opening increment. For each value of the opening, the crack morphology is recorded by using the top view camera. The in-situ visualization of the crack front is made possible by the transparency of the samples (glass substrate and backing with a very thin layer) and the light diffraction generated by the wedge shape opening of the crack.
Contrary to many classical cleavage test, we can perform experiments at con-trolled displacement (i.e. concon-trolled opening); and thus, the test is mechan-ically stable. Due to this stability, catastrophic rupture is avoided and the growth of the crack can be controlled. Once the crack stabilizes, an equality is achieved at each point of the crack front between the stress intensity factor
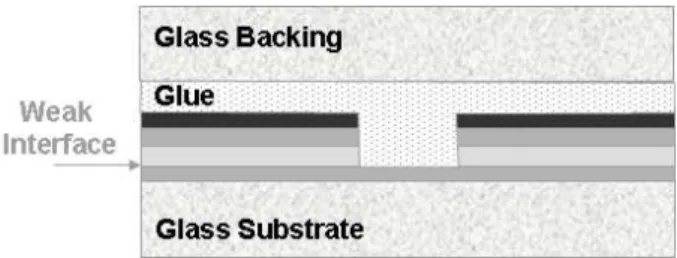
Fig. 3. Schematic lateral view of cleavage samples after the introduction of a pattern in the multilayer coating by performing a scratch
(K) and the local toughness (Kc) :
K(x, h(x)) = Kc(x, h(x)) , (3)
where h(x) is the position of the front along a x axis perpendicular to the crack front direction.
In a previous study on similar multilayer coated samples (Barthel et al., 2005), it has been shown that the crack propagation is purely interfacial. This result was achieved by XPS analysis of both cleavage surfaces after complete failure of the specimen. Perfectly interfacial ruptures at a well defined interface within the multilayer was always found, with negligible material transfer on the op-posite surface. For the present study, it means that we are able to generate experimentally a crack which is purely two-dimensional ( I;e. no roughness in the out of plane direction).
3.3 Interfacial patterning principle
A heterogeneous toughness on the weakest interface of our DCB sample is in-troduced by scratching the multilayer coating before gluing the glass backing. The objective here is to create pinning zones by introducing a toughness pat-tern (i.e. a local replacement of the weak interface by an interface of stronger adhesion).
Actually, it is possible to remove the coating down to the weak interface by scratching the surface via a ball on plane tribometer. The scratch, generated by the friction of a 10mm steel ball loaded at 20N, is about 500 µm wide and located in the middle of the contact zone. The scratch has straight edges and a perfectly flat groove as it is due to the complete delamination of the coating, which naturally occurs at the weakest interface of the sample. By performing multiple passes scratches, a rectangular pattern with controlled dimensions is possible. The lower limitation in size is the width of the scratch (i.e 500µm). There is no upper limitation.
(a) (b)
Fig. 4. Top view of the pinning zone for both samples: (a) the toughness pattern is a single wide line and (b) a network of nine parallel thin lines.
During the gluing of the glass backing, zones of strong adhesion are generated in the scratch traces (Fig. 3). In particular, the weak ZnO/Ag interface is replaced in the groove by a ZnO/glue interface of stronger adhesion. This high adhesion interface is excusively in the same plane as the weak interface of the coating. Hence, during cleavage, the crack remains in the weak interface plane even while propagation through the pinning zone.
In this study, two samples with different toughness patterns have been gener-ated. For the first one (see Fig. 4(a)), the objective was to study the influence of a single isolated pinning zone. So, the pattern was a single wide line, 16mm in length and 2.5mm wide. This dimension permitted an optimal observation with our CCD camera. For the second sample (see Fig. 4(b)), the objective was both to study the interaction between several pinning zones sufficiently close to each other and to show that manipulating the global morphology of the crack front is possible whith a judicious choice of the toughness pattern. The chosen pattern was a network of nine parallels lines. The lines are equally spaced (16mm between two consecutive lines) and have the following dimen-sions: 16mm in length and ∼ 250µm in width. For both samples, the direction of the lines is parallel to the direction of crack front propagation in order to conform to the weak pinning regime condition.
4 Results : Evolution of crack front morphologies
The evolution of the crack front morphologies during cleavage tests for both specimens is given in Fig. 5. Only the equilibrium positions, after the crack front has stopped, are shown. To extract these positions of the front from pictures taken with the top view camera, we took advantage of the contrast gradient between the cracked part and the rest of the sample. As mentioned earlier in this paper, this gradient is due to the interference pattern generated by a thin air wedge at the crack tip.
The evolution of the front morphologies can be divided in four successive stages :
1000 800 600 400 200 0 x (pix) 1300 1200 1100 1000 900 800 700 h(x) (pix)
Crack propagation direction
Pinning zone
Homogeneous phase Accomodation phase Weak pinning phase
(a) 1000 800 600 400 200 0 x (pix) 1100 1000 900 800 700 600 500 h(x) (pix)
Crack propagation direction
Pinning zone
Homogeneous phase Accomodation phase Weak pinning phase
(b)
Fig. 5. Evolution of crack front morphology during cleavage tests for both toughness patterns : (a) single wide line (1pixel = 40 × 40µm2) (b) network of parallel lines
(1pixel = 15 × 15µm2). The crack front is propagating from the bottom to the top
of the picture.
• Stage 1 : propagation of the front without any modification of the
mor-phology. At the beginning of the test, the front crosses an homogeneous zone of the sample. During this stage, the front has a parabolic shape, which is intrinsic to the DCB test and due to the finite width of our specimens. The side effects modify the front morphology leading to a parabolic shape which is not constant during crack propagation as it is function of the crack length. A flat front during cleavage of an homogeneous media is only obtained for a infinite sample in width. Note that this parabolic shape of the front will have to be taken into account in the analysis of the front morphology even in the pinning zone.
• Stage 2 : accommodation period of the front morphology. When the front
reaches the pinning zone, the front’s morphology is modified to accommo-date the presence of the zone of higher toughness. During this stage, the front does not penetrate in the pinning zone as the energetic cost of the elas-tic deformation of the front is lower than the energeelas-tic cost of the rupture of the high toughness zone (i.e the glue/underlayer interface). The defor-mation of the front is progressive and stops when it becomes energetically favorable to delaminate the high toughness interface.
• Stage 3 : weak pinning regime. During this stage, the front undergoes a
translation motion with a constant shape. This stage lasts until the front leaves the pinning zone. The specific shape of the front in the patterned region is due to the superposition of the intrinsic parabolic shape and of the elastic deformation due the presence of the high toughness zone, which leads to a deformation with a negative curvature as compared to the crack propagation direction. The propagation is delayed in the pinning region due to the higher toughness. In order to confirm that propagation occurs in
-60 -40 -20 0 h0 (x) (pix) 1000 800 600 400 200 0 x (pix) Homogeneous phase Accomodation phase Weak pinning phase
(a) -40 -20 0 20 h(x)-h mean (x) (pix) 1000 800 600 400 200 0 x (pix) Homogeneous phase Accomodation phase Weak pinning phase
(b)
Fig. 6. Normalized evolution of the crack front for both toughness patterns : (a) single wide line and (b) network of parallel lines. The constant shape of these front in the pinning zone illustrates that the front is in a weak pinning regime.
the weak regime, we have plotted (Fig. 6) the normalized position of the front. The fronts are normalized by subtracting the best parabolic curves using a mask in the central zone for the sample patterned with a single
line (h0(x) = h(x) − (αx2+ βx + γ) and by subtracting the mean value of
the front position (h(x) − h(x)) for the sample patterned with a network of parallel line. As seen in Fig. 6, during the third stage, all the curves are correctly superimposed which effectively confirms the existence of a weak pinning regime. Note that the progressive deformation of the front during stage 2 is also emphasized in this figure.
• Stage 4 : return of the front in the homogeneous zone of the sample. At
the very beginning of this stage when the front reaches the end of the pinning zone, the front recovers rapidly the intrinsic parabolic shape. This modification of the front morphology is unstable and thus, very hard to capture. The release of the elastic energy stored in the deformed front leads to a rapid propagation in the central zone of the sample until equilibrium is reached. Finally, the front recovers its parabolic shape.
In Fig. 5(b), the front morphology in the pinning region is nearly flat. In fact, it seems that the parabolic shape has disappeared due the presence of the network of parallel lines. This remarkable result will be discussed in more detail in the following section 5 of this paper.
5 Analysis and discussion
5.1 Front morphology (h(x)) variation in presence of an isolated toughness modification
First we would like to see if our experimental measurements of crack front morphologies h(x) (cf. Fig. 5) can be described in the framework of the first order perturbative analysis of Gao and Rice (Gao and Rice, 1989). We thus
have to find a direct expression of h(x) coming from Eq. (1). In this section, we will assume that the front morphology, h(x), is at equilibrium (see Eq. (3)).
Hence, we have an identity between the toughness, Kc, and the stress intensity
factor, K, at each point of the front. We propose the following methodology: To describe a pinning zone of constant toughness with width 2a, the toughness
distribution Kc(x) is defined as a function of a simple boxcar function (k(x))
and of the toughness contrast (∆K
Kref):
Kc(x) = Kref(1 +
∆K
Kref
k(x)) . (4)
The k(x) function is equal to zero outside the pinning zone (i.e. |x| > a) and
equal to 1 inside (i.e. |x| < a). Kref is the toughness of the original material
(i.e. outside the pinning region) and ∆K corresponds to the difference between
the toughness inside the pinning region and Kref.
The Fourier transform of Eq. (1) and (4) gives the two following expressions
for Ke K0 and e K Kref : f K K0 = 2π · δ(q) − 1 2|q|eh(q) ; (5) f Kc Kref = 2π · δ(q) + ∆K Kref e k(q) . (6)
The equality of stress intensity factor and local toughness along the crack front
leads to the following relation between eh(q) and k(q) for(q 6= 0):e
e h(q) = −2∆K K0 e k(q) |q| , (7)
where eh is the modulation of the crack front.
As Equation (7) is a product of two functions 1
|q| and k(q) in Fourier space,e it becomes the convolution product between a Green’s function and k(x) in direct space: hgreen(x) = 1 π2 ∆K K0 {log |x| ∗ k(x)} , (8)
880 860 840 820 800 780 760 h(x) (pix) 1000 800 600 400 200 0 x (pix) front_exp fit_green
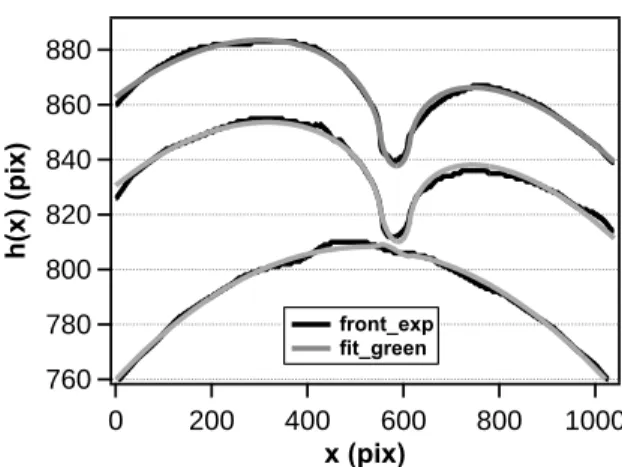
Fig. 7. Comparison of experimental measurements (Black line) and fits (gray lines) obtained by using a first order perturbative approach (see Eq. (8) for three repre-sentative crack front morphologies obtained during propagation in the single wide line pattern.
This last equation gives the morphology modulation h(x) along the x axis of a initially flat crack front in presence of a single 2a wide single pinning zone. This expression of h(x) can now be used to analyse our experimental measurement of front morphology. In appendix A, an alternative method to find a direct expression of h(x) from Eq. (7) is given.
5.2 Analysis of front morphologies based on pinning theory
As seen in section 4, before analyzing our experimental results, the finite DCB sample size effects has to be taken into account. So, a quadratic expression was subtracted from Eq. (8) in order to account for the parabolic shape of the
front. The following expression hf it was thus introduced in a routine developed
in Igor c° in order to fit the experimental data :
hf it(x, ∆K
K0
, a, α, β, γ) = hgreen(x) − (αx2+ βx + γ) . (9)
The five adjustment parameters are the toughness contrast (∆K
K0), the width
of the pinning zone (a) and the three coefficients (α, β and γ) of the quadratic function.
A comparison between the experimental front morphology and the fit is given in Fig. 7 for some representative front positions for the single pattern. In the homogeneous part of the sample, the fits correlate with the experimental curves. In the pinning region, the agreement between fits and experimental data demonstrates that it is possible to describe our front measurements in the framework of the pinning theory developed by Gao ad Rice. The use of
60 55 50 45 40 35 hgreen (x) (pix) 1000 800 600 400 200 0 x (pix) 4 3 2 1 0 k(x) hgreen(x) (pix) k(x)
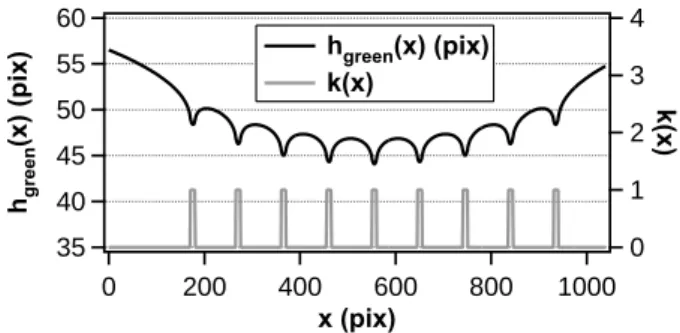
Fig. 8. Evolution of the theoretical front morphology for nine regularly spaced and centered pinning zones (see Eq. (8)). The toughness pattern is modeled by the function k(x).
Eq. (8) to fit our data allows us to describe both the parabolic shape of the front and the elastic deformation due to the pinning induced by the toughness pattern.
To analyse the crack front morphology evolution induced by a network of parallel thin pinning zones, we now assume that the function k(x), used in Eq. (4), is a series of nine boxcar functions k(x) as drawn in Fig. 8. Recall that k(x) is 1 in all the nine pinning zones and 0 everywhere else. To construct this function, a constant and unique toughness value is considered for all the isolated pinning zones.
The fits performed with Eq. (9) using the modified k(x) function are plotted in Fig. 9(a) for two representative experimental front morphologies. This figure shows again the correlation between the fits results and the experimental data. So, by making the right choice in the definition of the k(x) function which describes the toughness field in the sample, it is possible to describe the front deformation induced by various geometries of pinning zones.
Fig. 8 also presents the evolution of the hgreen(x) function (see Eq. (8))
associ-ated to this new periodic k(x) function. This curve represents the theoretical front morphology for a toughness contrast parameter equal to 1. In addition to the local elastic deformation of the front, the global shape of this curve shows a negative curvature due to the interaction between all the isolated sin-gle pinning zones. So, it is possible to take advantage of this global shape to try to manipulate the macroscopic morphology of an experimental front. As an example, in our experiments, the negative global curvature induced by the network of parallel pinning zones explains the flat front observed in Fig. 5(b) (see section 4). In fact, the toughness pattern was chosen to generate a global negative curvature which exactly compensates for the positive intrinsic curva-ture induced by the finite size of our DCB samples. This particular example illustrates that by choosing an appropriate toughness field, it is possible to compensate the finite size effects of the sample.
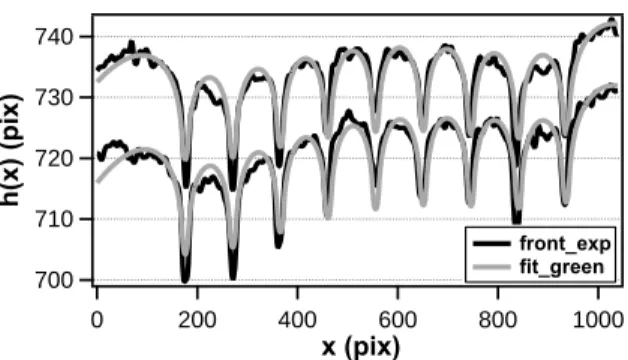
740 730 720 710 700 h(x) (pix) 1000 800 600 400 200 0 x (pix) front_exp fit_green
Fig. 9. Comparison of experimental measurements (Black line) and fits (gray lines) obtained by using a first order perturbative approach (see Eq. (8) for two repre-sentative crack front morphologies obtained during propagation in the network of parallel thin pinning zones).
5.3 Interaction effects
The crack front position during propagation in one specific point (h(x)) is not only related to the value of the local toughness at this particular point (K(x), h(x)) but depends on the toughness all along the front. The complete toughness field in the crack region gives rise to local deformation. The de-formation of the front, which is produced by a local toughness modification, has theoretically a logarithmic decrease as a function of distance. Hence, it is possible for several pinning zones to interact and the local position of the front results from the accumulation of all the modifications induced by each pinning zones. In a more practical point of view, the pinning zones have to be sufficiently close one to another to have a significant influence as the logarith-mic decrease leads rapidly to negligible value for the modification of the front position.
To illustrate and emphasize the effect of interaction between pinning zones, the local morphology of the front around the central line of the network of parallel pinning zones has been investigated. We chose to analyse a region of 16mm in width (i.e. a full period of the network) which is centered on the central line of the network.
This region is of particular interest to investigate the interaction between pinning zones because of its position in the middle of the network of pinning zones. Indeed, the presence of regularly spaced pinning zones outside of this region allows us to consider that they will influence the morphology of the crack front. To fit our experimental data, two different strategies were used. For both of them, no quadratic term was introduced in the fit function as, in this thin central region, the curvature is negligible.
The first fit (dark gray cuve in Fig. 10) was performed by introducing in Eq. (8) the modified k(x) function described in Fig. 8 and by focussing on the
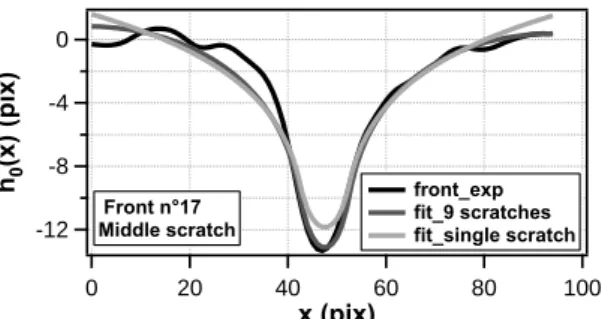
-12 -8 -4 0 h0 (x) (pix) 100 80 60 40 20 0 x (pix) Front n°17 Middle scratch front_exp fit_9 scratches fit_single scratch
Fig. 10. Comparison of experimental measurements (Black line) and fits of crack front morphology around the middle line of the network of thin parallel pinning zone. Two fitting strategies are used. The first one (gray line) takes into account the influence of all the nine thin pinning zones. The second one (light gray line) only takes into account the influence of the unique pinning zone inside the zone of interest.
central part of the result. This fit strategy allows us to take into account the contribution of all the pinning zones introduced in the sample even if they are not in the zone of interest (ZOI)(i.e in the region where the front is studied). As expected, the agreement with the experimental data is quite good.
The second fit (light gray cuve in Fig. 10) was performed by introducing in Eq. (8) the single boxcar function (k(x)) (see Eq. (4)) which is only defined in the ZOI. Contrary to the first one, this strategy only takes into account the influence of the single pinning zone which is in the ZOI. As that was fore-seeable, the correlation is not that good especially at the side of the ZOI and in the middle of the pinning zone. This correlation can be understood quite easily as it illustrates the interaction effects between pinning zone which are close. The studied central region has symmetric and nearly periodic boundary conditions due to the presence of regularly spaced pinning zones outside the ZOI. So, the front position we measured in this zone results from the interac-tion of several single pinning zones. By definiinterac-tion, the k(x) funcinterac-tion used to describe these measurements is only defined in the ZOI. Thus, it only allows to take into account the effect of the toughness contrast which are in the ZOI. This mismatch between the global experiment and the fit function we use, in term of interaction between defects, explains the lack of correlation which is observed. Especially at the side of this central region, the phenomena is more sensitive because the front propagation is delayed by the presence of the nearest pinning zones.
5.4 evolution of the width of the pinning zone
In Fig. 11, the evolution of the half width of the pinning zone (1
2a), resulting
from the fits performed on our experimental data, is plotted as a function of the position of the crack front for both pinning region geometries.
50 40 30 20 10 0 1/2 Width (pix) 04 05 06 07 08 09 10 11 12 13 14 15 16 17 18 19 20 21 22 23 24 25 Front n° fit_green fit_four (a) 7 6 5 4 3 1/2 Width (pix) 09 10 11 12 13 14 15 16 17 18 19 Front n° fit_green fit_four (b)
Fig. 11. Evolution of the width of the pinning zone as a function of the position of the crack front for (a) a single wide pinning zone (1pixel = 40µm) and (b) for the network of 9 parallels thin pinning zones ((1pixel = 15µm)). This evolution is evaluated for two fit methodologies respectively based on Eq. (8) (black triangle) and Eq. (A.2)(grey circle).
For the single pinning zone (Fig. 11(a)), as soon as the crack is in contact with
the high toughness zone (i.e from front n◦9), the fitted width a converges to
values between 60 and 70 pixels i.e. between 2.4 and 2.8 mm, which is very close to the optical measurements of the width of the initial scratch (2.5 mm). This result confirms that the whole zone in the scratch traces acts as a pinning
region for crack propagation. At the end of the test (i.e. from front n◦17), the
fitted width a converges to values slightly higher. After post-mortem observa-tion of the sample, this unexpected evoluobserva-tion was attributed to problems of cavitation or fibrillation in the glue layer. In fact, visual aspect modification of the glue layer (loss of transparency) was observed in the corresponding region of the pinning zone. Since the glue layer in the scratch trace is quite large in this specific geometry, large deformation is very likely to happen.
For the network of parallel pinning region (Fig. 11(b)), as soon as the crack
is in contact with the hight toughness zone (i.e from front n◦13), the fitted
width a converges to values between 10 and 12 pixels, i.e. between 150 and 180 µm, which is slightly lower than the estimated mean value of the width of the initial scratches (250 µm). This mismatch can be due to a lack of precision in the optical measurement of the width of the initial scratch which tend to overestimate its value. Or, it is also possible that, at the edge of such thin scratch, the adhesion of the glue is not perfect. This means that the pinning can be lower close to the side of the pinning zone leading to a underestimation of its global width. If such boundary effects exist, their impact increases as the width of the scratch decreases and also as the number of edges increases. This is why they have undetectable effects for the single wide pinning zone.
5.5 Evolution of the toughness contrast
In Fig. 12, the evolution of the relative toughness contrast (∆K/K0) is plotted
geome-3.0 2.0 1.0 0.0 DK/K 0 04 05 06 07 08 09 10 11 12 13 14 15 16 17 18 19 20 21 22 23 24 25 Front n° fit_green fit_four (a) 6 4 2 D K/K 0 01 02 03 04 05 06 07 08 09 10 11 12 13 14 15 16 17 18 19 Front n° fit_green fit_four (b)
Fig. 12. Evolution of the relative toughness contrast (∆K/K0) as a function of
the position of the crack front for a single wide pinning zone (left) and for the network of 9 parallels thin pinning zones (right). This evolution is evaluated for two fit methodologies respectively based on Eq. (8) (black triangle) and Eq. (A.2)(grey circle) .
tries. These values of the toughness contrast result from the fits performed on our experimental data. The obtained evolution of this parameter is for both samples in good correlation with the evolution of the front morphology which was described in section 4.
At the very beginning of the test when the crack is in the homogeneous zone of the sample, there is no deformation of the front and the toughness contrast is close to zero. During the accommodation stage, the toughness contrast pro-gressively increases which reflects the progressive deformation of the front as it touches the high toughness zone. When the crack propagates in the pinning zone, the toughness contrast keeps a quite stable value. The relative stability of this parameter is again a confirmation that the crack is in a weak pinning regime. When the crack leaves the pinning zone, the toughness contrast in-stantaneously returns to a null value. There is no progressive decrease because this stage is unstable.
The mean value of the toughness contrast during the pinning stage (i.e. during the plateau) is 2.8 (respectively 4) for the single wide pinning zone (respec-tively for the network of parallel pinning zones). These high values far from 1 tell that the adhesion in the pinning zones is much higher than in the rest of the sample. At first sight, this could be in contradiction with the Gao and Rice approach. Indeed their first order perturbation analysis is only possible for a toughness ratio close to 1. Nevertheless, even if it could seem contradictory, we have succeeded in describing our experimental results with their approach. An explanation of this paradoxical observation can be found in an energetic approach instead of just looking at the local toughness. During crack prop-agation, in an homogeneous media the released energy can be considered as proportional to the new surface creation. So the variation in terms of energetic cost between two zones of different toughness can be qualitatively considered as proportional to the length ratio between the defect and the homogeneous part. Indeed, in our experiment, the very small size of the pinning zones com-pared to the rest of the specimen can explain our success in describing the
front morphology with a first order perturbation analysis.
6 Conclusion
In this paper, the propagation of a crack front through a two-dimensional toughness patterned interface was studied experimentally. All the results show that the specific experimental set-up we developed allows to quantitatively analysing the deflection of a front by one-dimensional tough patterns within the framework of the first order expansion of the Stress Intensity Factor devel-oped by Rice and Gao (Rice, 1985; Gao and Rice, 1989). The major advantage of this set-up is that the characteristics of the generated crack are nearly in perfect adequation with the hypothesis of this theory. The crack is perfectly plane with no roughness in the out of plane direction. By using simple tough-ness patterns, with no variation along the direction of propagation, we have observed the expected weak pinning regime (Roux et al., 2003) and confirmed that Linear Elastic Fracture Mechanics (LEFM) associated with crack pinning theory can effectively predict crack front morphology in patterned interfaces. The quantitative agreement obtained in this series of experiments between the measurements of the front deflection by a tough region and the analytical predictions thus motivates us to apply the same strategy to more complex patterns. Firstly, in the case of high toughness gradients along the direction of propagation a regime of strong pinning is expected, leading to an intermittent propagation of the crack front. This strong pinning regime is not only charac-terized by a complex spatio-temporal behavior but also induces a significant reinforcement effect (Roux et al., 2003): in contrast to the weak pinning situ-ation, the effective toughness is larger than the simple average of microscopic properties and is in particular sensitive to the anisotropy of the patterning. The present series of experiments can thus be seen as a first step toward the reinforcement of weak interfaces by toughness patterning at the microscopic scale. Secondly, with successive exchanges between experiments and theory to validate each theoretical prediction, we hope to be able to design patterned in-terfaces in which the disorder is sufficient to simulate and understand fracture in real heterogeneous materials by taking advantages of the possible direct observation of the crack front morphologies.
Acknowledgement
References
Alava, M. J., Nukala, P., Zapperi, S., 2006. Statistical models of fracture. Adv. Phys. 55, 349–476.
Barthel, E., Kerjan, O., Nael, P., Nadaud, N., 2005. Asymmetric silver to oxide adhesion in multilayers deposited on glass by sputtering. Thin Sol. Films 473 (2), 272–277.
Bouchaud, E., 1997. Scaling properties of cracks. J. Phys. Cond. Mat. 9, 4319. Bouchaud, E., Lapasset, G., Plan`es, J., 1990. Fractal dimension of fractured
surfaces – a universal value. Eurphys. Lett. 13, 73–79.
Bower, A. F., Ortiz, M., 1991. A three-dimensional analysis of crack trapping and bridging by tough particles. J. Mech. Phys. Solids 39, 815.
Chakrabarti, B. K., Benguigui, L. G., 1997. Statistical Physics of Fracture and Breakdown in Disordered Systems. Oxford University Press.
Charles, Y., Hild, F., Roux, S., Vandembroucq, D., 2006. Material independent crack arrest statistics: Application to indentation experiments. Int. J. Fract. 142, 51–67.
Charles, Y., Vandembroucq, D., Hild, F., Roux, S., 2004. Material independent crack arrest statistics. J. Mech. Phys. Sol. 52, 1651–1669.
Curtin, W. A., 1998. Stochastic damage evolution and failure in fiber-reinforced composites. Adv. Appl. Mech. 36, 164.
Daguier, P., Bouchaud, E., Lapasset, G., 1995. Roughness of a crack front pinned by microstructural obstacles. Europhys. Lett. 31, 367–372.
Evans, A. G., 1990. Perspectives on the development of high-toughness ce-ramics. J. Am. Ceram. Soc. 73, 187–206.
Gao, H., Rice, J. R., 1989. First-order perturbation analysis of crack trapping by arrays of obstacles. J. Appl. Mech. 56, 828–836.
Herrmann, H., Roux, S., 1990. Statistical Models for the Fracture of Disor-dered Media. North-Holland.
Lawn, B., 1993. Fracture of Brittle Solids - Second Edition. Cambridge Uni-versity Press.
M˚aløy, K. J., Hansen, A., Hinrichsen, E. L., Roux, S., 1992. Experimental
measurements on the roughness of brittle cracks. Phys. Rev. Lett. 68, 213– 215.
Mandelbrot, B. B., Passoja, D. E., Paullay, A. J., 1984. Fractal character of fracture surfaces of metals. Nature 308, 721–722.
Movchan, A. B., Willis, J. R., 1995. Dynamic weight function for a moving crack. ii. shear loading. J. Phys. Mech. Sol. 43, 1369–1383.
Mower, T. M., Argon, A. S., 1995. Experimental investigations of crack trap-ping in britlle heterogeneous solids. Mech. Mater. 19, 343–364.
Perrin, G., Rice, J., 1994. Disordering of a dynamic planar crack front in a model elastic medium of randomly variable toughness. J. phys, Mech. Sol. 42, 1047–1064.
Ramanathan, S., 1998. Crack propagation through heterogeneous media. Ph.D. thesis, Harvard University.
Ramanathan, S., Erta¸s, D., Fisher, D. S., 1997. Quasistatic crack propagation in heterogeneous media. Phys. Rev. Lett. 79, 873–876.
Ramanathan, S., Fisher, D. S., 1997. Dynamics and instabilities of planar tensile cracks in heterogeneous media. Phys. Rev. Lett. 79, 877–880.
Rice, J. R., 1985. First-order perturbation in elastic fields due to variation in location of a planar crack front. J. Appl. Mech. 52, 571–579.
Roux, S., Vandembroucq, D., Hild, F., 2003. Effective toughness of heteroge-neous brittle materials. Eur. J. Mech. A 22, 743–749.
Schmittbuhl, J., M˚aløy, K. J., 1997. Direct observation of a self-affine crack
propagation. Phys. Rev. Lett. 78, 3888–3891.
Schmittbuhl, J., Roux, S., Vilotte, J. P., M˚aløy, K. J., 1995. Interfacial crack
pinning: effect of non local interactions. Phys. Rev. Lett. 74, 1787–1790. Tadepalli, R., Turner, K., Thompson, C., 2008. Effects of patterning on the
interface toughness of wafer-level cu-cu bonds. Acta Mater. 56, 438–447. Willis, J. R., Movchan, A. B., 1995. Dynamic weight function for a moving
crack. i. mode i loading. J. Phys. Mech. Sol. 43, 319–341.
Willis, J. R., Movchan, A. B., 1997. Three dimensional dynamic perturbation of a propagating crack. J. Phys. Mech. Sol. 45, 591–610.
A Alternative method to find a theoretical expression of font
mor-phology (h(x))
In order to find a direct expression of the front morphology (h(x)) in presence of a single high toughness region, an alternative method can be proposed. This method is based on the use of a numerical inversion of the fourier transform to obtain the h(x) expression in direct space from Eq. (7). First, we replace (ek(q)) by the following expression which is the fourier transform of a boxcar
function: e
k(q) = 2a
qasin qa (A.1)
Then, the obtained relation for eh(q) is simply transposed in direct space by
using a numerical fourier transform algorithm implemented on Igor c°:
hf our(x) = ∆K
K0
· F F T−1(−4 · sign(q)sin(qa)
q2 ) (A.2)
This new expression of h(x) can now be used to analyse our experimental measurement of front morphology, but some precautions must be taken into account. The use of this numerical Fourier transform introduces by definition a periodicity in the function. In fact, this h f our(x) function acts as if there
-15 -10 -5 0 5 h(x) (pix) 600 500 400 300 200 100 0 x (pix) front_exp fit_four fit_green (a) 880 860 840 820 800 780 760 h(x) (pix) 1000 800 600 400 200 0 x (pix) front_exp fit_four fit_green (b)
Fig. A.1. Comparison of experimental measurements (Black lines) and fits (Gray lines) of three representative crack front morphologies : for the single wide pinning zone (a) and for the network of parallel thin pinning zones (b). The fits are performed with two methodologies called fit green (black triangle) and fit four (grey circle) respectively based on Eq. (8) and Eq. (A.2).)
were an infinity of regularly spaced pinning zone outside the ZOI. These virtual pinning region have of course the same characteristics as the one in the ZOI and the period is equal to the size of the ZOI. For this function, the adjustment
parameter is again the contrast of toughness (∆K
K0 )and the width of the pinning
zone 2a.
The fits obtained with this new function, given in Fig. A.1, show the same good correlation with the experimental data as the one obtained for the fit based on Eq. (A.2). To perform this new analysis of our experimental data, a special care was given to the boundary conditions to account for the induced periodicity of the function. In Fig. 12, the evolution of both fit parameters is given for this new function (Gray circle). These evolutions are very similar for both fit methodologies.