HAL Id: hal-01206626
https://hal.sorbonne-universite.fr/hal-01206626
Submitted on 29 Sep 2015
HAL is a multi-disciplinary open access
archive for the deposit and dissemination of
sci-entific research documents, whether they are
pub-lished or not. The documents may come from
teaching and research institutions in France or
abroad, or from public or private research centers.
L’archive ouverte pluridisciplinaire HAL, est
destinée au dépôt et à la diffusion de documents
scientifiques de niveau recherche, publiés ou non,
émanant des établissements d’enseignement et de
recherche français ou étrangers, des laboratoires
publics ou privés.
the Euro-Mediterranean region
G. Rea, S. Turquety, L. Menut, R. Briant, S. Mailler, G. Siour
To cite this version:
G. Rea, S. Turquety, L. Menut, R. Briant, S. Mailler, et al.. Source contributions to 2012 summertime
aerosols in the Mediterranean region. Atmospheric Chemistry and Physics Discussions,
Euro-pean Geosciences Union, 2015, 15 (14), pp.8013-8036. �10.5194/acp-15-8013-2015�. �hal-01206626�
www.atmos-chem-phys.net/15/8013/2015/ doi:10.5194/acp-15-8013-2015
© Author(s) 2015. CC Attribution 3.0 License.
Source contributions to 2012 summertime aerosols in the
Euro-Mediterranean region
G. Rea1, S. Turquety1, L. Menut1, R. Briant1, S. Mailler1, and G. Siour2
1Laboratoire de Météorologie Dynamique, UMR CNRS 8539, Université Pierre et Marie Curie – Paris 6,
ENPC, Ecole Polytechnique, Palaiseau, France
2Laboratoire Inter-Universitaire des Systèmes Atmosphériques, UMR CNRS 7583, Université Paris Est
Créteil et Université Paris Diderot, Institut Pierre Simon Laplace, Créteil, France
Correspondence to: G. Rea (geraldine.rea@lmd.polytechnique.fr)
Received: 2 February 2015 – Published in Atmos. Chem. Phys. Discuss.: 18 March 2015 Revised: 11 June 2015 – Accepted: 3 July 2015 – Published: 21 July 2015
Abstract. In the Mediterranean area, aerosols may originate
from anthropogenic or natural emissions (biogenic, mineral dust, fire and sea salt) before undergoing complex chem-istry. In case of a huge pollution event, it is important to know whether European pollution limits are exceeded and, if so, whether the pollution is due to anthropogenic or nat-ural sources. In this study, the relative contribution of emis-sions to surface PM10, surface PM2.5and total aerosol
opti-cal depth (AOD) is quantified. For Europe and the Mediter-ranean regions and during the summer of 2012, the WRF and CHIMERE models are used to perform a sensitivity analysis on a 50 km resolution domain (from −10◦W to 40◦E and from 30◦N to 55◦N): one simulation with all sources (refer-ence) and all others with one source removed. The reference simulation is compared to data from the AirBase network and two ChArMEx stations, and from the AERONET network and the MODIS satellite instrument, to quantify the ability of the model to reproduce the observations. It is shown that the correlation ranges from 0.19 to 0.57 for surface partic-ulate matter and from 0.35 to 0.75 for AOD. For the sum-mer of 2012, the model shows that the region is mainly in-fluenced by aerosols due to mineral dust and anthropogenic emissions (62 and 19 %, respectively, of total surface PM10
and 17 and 52 % of total surface PM2.5). The western part
of the Mediterranean is strongly influenced by mineral dust emissions (86 % for surface PM10and 44 % for PM2.5), while
anthropogenic emissions dominate in the northern Mediter-ranean basin (up to 75 % for PM2.5). Fire emissions are more
sporadic but may represent 20 % of surface PM2.5, on
av-erage, during the period near local sources. Sea salt mainly
contributes for coastal sites (up to 29 %) and biogenic emis-sions mainly in central Europe (up to 20 %).
The same analysis was undertaken for the number of daily exceedances of the European Union limit of 50 µg m−3 for PM10 (over the stations), and for the number of
daily exceedances of the WHO recommendation for PM2.5
(25 µg m−3), over the western part of Europe and the cen-tral north. This number is generally overestimated by the model, particularly in the northern part of the domain, but exceedances are captured at the right time. Optimized contri-butions are computed with the observations, by subtracting the background bias at each station and the specific peak bi-ases from the considered sources. These optimized contribu-tions show that if natural sources such as mineral dust and fire events are particularly difficult to estimate, they were responsible exclusively for 35.9 and 0.7 %, respectively, of the exceedances for PM10 during the summer of 2012. The
PM25 recommendation of 25 µg m−3is exceeded in 21.1 %
of the cases because of anthropogenic sources exclusively and in 0.02 % because of fires. The other exceedances are in-duced by a mixed contribution between mainly mineral dust (49.5–67 % for PM10exceedance contributions, 4.4–13.8 %
for PM2.5), anthropogenic sources (14.9–24.2 % and 46.3–
80.6 %), biogenic sources (4.1–15.7 % and 12.6–30 %) and fires (2.2–7.2 % and 1.6–12.4 %).
1 Introduction
Numerous studies have shown the deleterious impact of ticulate matter (PM) air pollution on human health. In par-ticular, small particles, PM10 and PM2.5 (particulate matter
with an aerodynamic diameter lower than 10 and 2.5 µm, re-spectively), enhance cardiopulmonary mortality and morbid-ity (Katsouyanni et al., 1997; Boldo et al., 2006; Pope and Dockery, 2006) due to their deeper penetration into the res-piratory system.
Beyond these concerns, aerosol quantification is needed to evaluate its contribution to climate change. PM have a direct impact due to the absorption and scattering of solar radiation, the so-called “aerosol direct effect”, as well as an indirect im-pact due to their role as cloud condensation nuclei (Yu et al., 2006; Carslaw et al., 2010; Stocker et al., 2013). Absorbing aerosols have also a “semi-direct effect” on cloud evapora-tion and cloud cover (Hansen et al., 1997).
Monitoring particulate matter ambient concentrations is thus an important issue for regional air quality and climate, and has become a key concern for pollution regulations in the past decade. Therefore, a correct understanding and quantifi-cation of aerosol formation and evolution is required.
The Mediterranean region is heavily influenced by numer-ous anthropogenic and natural aerosol sources and is often exposed to air pollution (Monks et al., 2009). Those sources, combined with complex interactions between atmospheric dynamics, geographical features and land-sea temperature gradients (Lionello et al., 2006), lead to an European aerosol load maximum (Textor et al., 2006; Putaud et al., 2010). Me-teorological conditions hold a key role in the development of aerosol-related pollution events (Millán et al., 2002). Being in a transitional zone between the subtropical high-pressure belt and the mid-latitude westerlies and low pressure sys-tems, the Mediterranean region is characterized by hot, dry summers and mild, wet winters. These meteorological pat-terns govern the transport of aerosols released from various sources around the Mediterranean region and lead to a max-imum aerosol load during the summer (Monks et al., 2009; Nabat et al., 2013). Moreover, a mixture of different sources is usually observed due to the long-range transport of the as-sociated particles (Dall’Osto et al., 2010; Gerasopoulos et al., 2011; Boselli et al., 2012). Due to these complex character-istics, the specific impact of each aerosol source cannot be easily assessed.
The region is impacted by local emissions from anthro-pogenic activities and by biogenic emissions of precursors of aerosol formation. Most of PM2.5 exceedances are due
to primary pollution but these are enhanced by the pro-duction of secondary aerosols (Koçak et al., 2007). For instance, Sartelet et al. (2012) found that Secondary Or-ganic Aerosol (SOA) formation over Europe is strongly im-pacted by biogenic emissions (72–88 %) in addition to an-thropogenic emissions of precursors. Another study by Im and Kanakidou (2012) showed that regional anthropogenic
emissions contributes to 47 % of PM2.5in the eastern basin
(Greece, Turkey) in summer, with 4 % from Istanbul. Moreover, the long-range transport of mineral dust from North Africa significantly affects PM concentration through-out the region. Several studies of available observations show that the PM10 European Union air quality standard
(50 µg m−3, daily average) is exceeded at many locations around the basin because of a combination of mineral dust and anthropogenic pollutants from local sources (Gerasopou-los et al., 2006; Gobbi et al., 2007; Koçak et al., 2007; Ro-driguez et al., 2007; Kaskaoutis et al., 2008). Mineral dust outbreaks, although transported through the Mediterranean sea during all seasons, are more frequent in spring and sum-mer, where dust plumes are transported through the Atlantic and reach mainly and regularly the western part of the re-gion (Moulin et al., 1998; Israelevich et al., 2012; Salvador et al., 2014; Ripoll et al., 2015). In summer, mineral dust aerosols are also observed over central Europe (Israelevich et al., 2012; Salvador et al., 2014).
Another important source of PM in the Mediterranean basin is sea salt, which can account for instance in Erdemli (eastern Mediterranean coast) for up to 50 % of PM10
con-centration threshold exceedances (Koçak et al., 2007). Vegetation fires (recurrent in eastern and southern Europe during spring and summer) are also a significant additional source of PM (Turquety et al., 2014), with consequences on air quality throughout the basin (Pace et al., 2005; Hodzic et al., 2007; Barnaba et al., 2011).
The natural emissions from fires and mineral dust are par-ticularly difficult to quantify accurately due to their intense and sporadic nature resulting in large spatial and tempo-ral variability. Sevetempo-ral projects have been undertaken over the past years to improve the understanding and the quan-tification of particulate pollution over the Mediterranean region. Among those, the ChArMEx international pro-gram (Chemistry-Aerosol Mediterranean Experiment, http: //charmex.lsce.ipsl.fr), allowed the settlement of several ad-ditional observation sites as well as intensive measurement campaigns during the summers of 2012, 2013 and 2014. In 2012, the ChArMEx/TRAQUA (TRansport and Air QuAl-ity) experiment allowed the characterization of a very intense dust transport event measured at the end of June over the western Mediterranean (Nabat et al., 2015). In addition, sev-eral large fires were reported during the summer of 2012, more particularly in the Balkans (Anttila et al., 2015) and in Spain in July (Gómez-Amo et al., 2013).
The majority of the studies previously cited have been made at specific experimental sites and sometimes for spe-cific case studies or sources. The purpose of our analysis is to estimate the relative contributions of this diversity of sources, and thus to draw a regional context of aerosol pollution dur-ing the summer of 2012 in the framework of the ChArMEx program.
Aerosol optical properties are important to characterize aerosols for air pollution monitoring. They are needed to
es-timate the radiative effects, which have themselves an im-pact on photochemistry by modifying the photolysis rates (Mailler et al., 2015). Moreover, optical properties are di-rectly related to aerosol particle concentration, type and size. The observations of aerosol optical properties from re-mote sensing instruments thus provide an important com-plement to the surface PM databases. In particular, exten-sive measurements of the aerosol optical depth (AOD), char-acterizing the light extinction associated with the aerosols along the full vertical column, are provided by the surface AErosol RObotic NETwork (AERONET; http://aeronet.gsfc. nasa.gov) and by several satellite-based instruments, allow-ing a very good spatial and temporal coverage.
In addition to the analysis of surface and remote sens-ing observations, chemistry-transport models (CTMs) are re-quired for the simulation of atmospheric composition and the understanding of physico-chemical processes. Model valida-tion or inter-comparisons have shown that, although the mod-eling of ozone or other gases has been improved in the past years, the modeling of PM is still a concern, with a persis-tent underestimation of PM10 for the majority of the CTMs
(Roustan et al., 2010; Solazzo et al., 2012; Im et al., 2015). Moreover, PM2.5 is also overestimated when PM10 is
im-proved, although the biases on PM2.5 are lower than those
on PM10. Even though emissions probably constitute a
sig-nificant source of uncertainty, the uncertainty in modeled PM concentrations linked to the parameterization choices (verti-cal diffusion, number of levels, deposition, etc.) and to the meteorological fields can be for instance higher than the un-certainty linked to PM anthropogenic and biogenic emissions (Sartelet et al., 2012). The uncertainty in PM concentrations leads to uncertainties in the simulated aerosol optical prop-erties and AOD (Péré et al., 2010; Curci et al., 2014), in ad-dition to uncertainties in the calculation of optical properties (refractive indices, assumptions on aerosol mixing, density). This paper provides an analysis of the main contribu-tions of aerosol sources to both surface PM and AOD in the Mediterranean region using the CHIMERE state-of-the-art regional CTM (Menut et al., 2013). This paper aims at es-timating the contribution of each source in Europe and the Mediterranean basin, to provide a description of the zones of influence of given sources on regional air pollution.
After an evaluation of the model’s performance through comparisons to observations from surface networks and re-mote sensing, a sensitivity analysis is conducted on the case study of the summer of 2012 (June–July–August). This time period allows an analysis including all sources (fires and dust outbreaks notably occurred during this period). Estimations of the relative contributions of the main aerosol sources to the aerosol load in the Mediterranean area is provided. Sec-tion 2 describes particulate polluSec-tion during the summer of 2012 based on the available observations of surface PM and AOD. Section 3 presents the tools and methodology used in this paper. The model is evaluated against observations in Sect. 4, and sensitivity simulations are discussed in Sects. 5
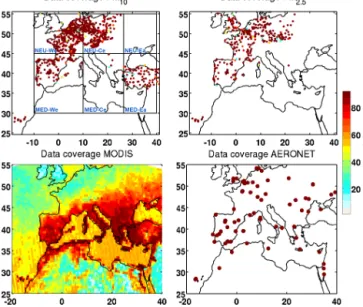
Figure 1. Data coverage during the summer of 2012 (1 June to 31 August, 92 days) for each observation data set, i.e., the number of days with measurements from AirBase stations with PM10 and
PM2.5values, AERONET stations and MODIS data with values for
the AOD at 500 and 550 nm, respectively.
and 6, where an estimation of contributions to surface PM and AOD and to air quality threshold exceedances is also as-sessed.
2 Presentation and analysis of observations
Aerosol quantification from 1 June to 31 August over the re-gion is analyzed in this section using observations of both surface PM concentrations and AOD, which provide an overview of the main polluted regions and the temporal vari-ability of aerosol concentrations.
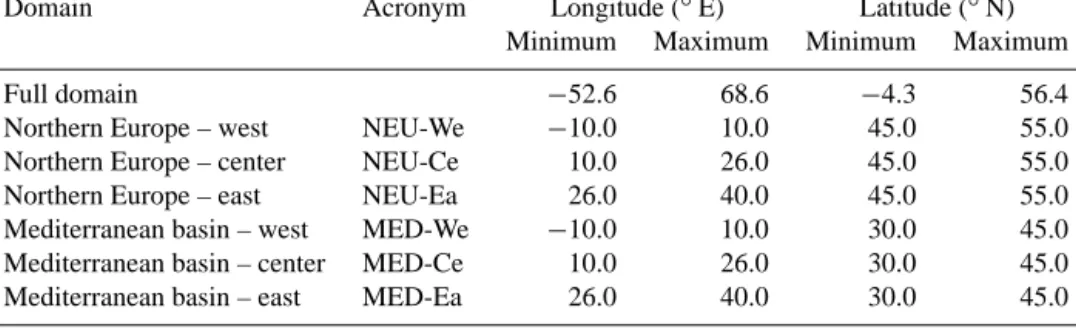
The domain was divided into six sub-regions, which present different characteristics in terms of sources, pop-ulation density as well as meteorological patterns, which are reflected in the observations. The acronyms MED and NEU represent, respectively, all the Mediterranean basin and the northern European part of the domain. MED and NEU regions are divided into western, central and eastern zones (MED-We, MED-Ce, MED-Ea and We, NEU-Ce, NEU-Ea). The delimitations of the regions are indicated in Table 1 and Fig. 1.
2.1 Surface PM
Surface PM concentrations from the model are evaluated through comparisons to PM2.5 and PM10observations from
the European Air quality database (AirBase) of the Eu-ropean Environment Agency (http://acm.eionet.europa.eu/ databases/airbase). This database provides air quality mon-itoring data and information from 38 countries around
Table 1. Coordinates of the simulation domain and sub-domains used for further analysis.
Domain Acronym Longitude (◦E) Latitude (◦N) Minimum Maximum Minimum Maximum
Full domain −52.6 68.6 −4.3 56.4
Northern Europe – west NEU-We −10.0 10.0 45.0 55.0 Northern Europe – center NEU-Ce 10.0 26.0 45.0 55.0 Northern Europe – east NEU-Ea 26.0 40.0 45.0 55.0 Mediterranean basin – west MED-We −10.0 10.0 30.0 45.0 Mediterranean basin – center MED-Ce 10.0 26.0 30.0 45.0 Mediterranean basin – east MED-Ea 26.0 40.0 30.0 45.0
Europe, and includes more than 6000 stations providing hourly and daily measurements. The diversity of instruments and sampling, associated with certain meteorological con-ditions (relative humidity) contribute to the uncertainty of the database. The standard error of the AirBase network PM measurements is better than 25 %. Only rural and back-ground stations are included in the present paper. Indeed, ur-ban sites being strongly influenced by local sources, they are not relevant for this analysis of the regional trends and bud-get of pollution. This reduces the number of stations to 927 for PM10 and 316 for PM2.5. Two additional rural stations
located in Corsica in the framework of the ChArMEx project are also taken in consideration (Venaco and Ersa).
The average concentration from 1 June to 31 August 2012 at the PM10 stations is shown in Fig. 2, with the number of
days with data shown in Fig. 1. Almost all stations present data every day of the studied time period. Most of the stations are concentrated in the central north of the domain, so that the analysis over the Mediterranean Sea itself and around most of its coasts is not possible.
The observations show that some regions are recur-rently affected by pollution. These correspond to most of the Mediterranean coastline (stations in Spain, south of France), with monthly averaged concentrations of PM10 up
to 40 µg m−3 and maxima around 200 µg m−3. The Po Val-ley and the Benelux are also affected by high levels (up to 200 µg m−3) as well as eastern Europe.
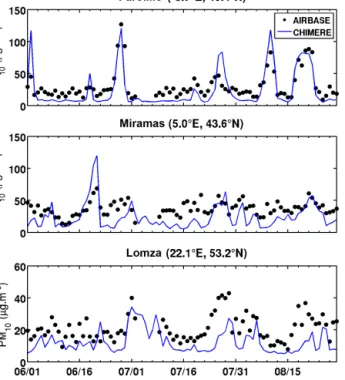
For example, high values of PM are detected in Farollilo near Salamanca, Spain (Fig. 3) at the end (27–28) of June (with a concentration up to 120 µg m−3), and end of July and above 80 µg m−3during August (around 10 and 18–19). The level of PM in this area remains high (around 40 µg m−3for daily mean) during the whole time period. Observations in the south of France show lower temporal variability with concentrations from 10 to around 50 µg m−3. Some spo-radic hourly values (not shown) reach more than 100 µg m−3 around 20–21 June, at the end of July and the end of August. For example, at the station located in Miramas in the south of France, hourly values reach more than 250 µg m−3(daily mean value of 80 µg m−3) around 20 June, during the end of July, and during the beginning of August.
Figure 2. Summer 2012 (1 June to 31 August) daily average for sur-face PM10concentrations from the AirBase network and Ersa and
Venaco stations (upper left) and aerosol optical depth at 550 and 500 nm, respectively, from MODIS instrument and AERONET sta-tions (bottom left). Daily maximum over the period is shown in the upper right panel for surface PM10concentrations and the bottom
right panel for aerosol optical depth.
Eastern Europe is also affected by high concentrations, as shown for example by the Lomza station in Poland, with peak values around 30 June (up to 90 µg m−3), at the end of July (above 300 µg m−3for Mragowo, Poland) and during the sec-ond half of August (up to 100 µg m−3).
2.2 Aerosol optical depth (AOD)
In addition to surface PM, remote sensing observations of AOD, which provides information on the column integrated aerosol load, are analyzed. Both surface remote sensing from AERONET and satellite observations from the Moderate Resolution Imaging Spectroradiometer (MODIS) are used.
AERONET is an optical ground-based aerosol-monitoring network, composed of spectral radiometers. It allows mea-surements of AOD every 15 min at 8 wavelengths (centred between 340 and 1020 nm). With more than one hundred
sta-Figure 3. Time series from 1 June to 31 August of daily mean sur-face PM10 concentrations from three stations of the AirBase net-work. The top station is located near Salamanca in Spain, mid-dle is in Miramas in the south of France, and bottom is in Lomza in Poland. The corresponding simulated CHIMERE concentrations (spatially co-localized) are also indicated (blue line).
tions in the world, the network is widely used for the vali-dation of model simulations and satellites observations. The main product examined here is the level 2.0, cloud-screened and quality assured, total AOD at 550 nm retrieved from the ground-based AERONET sun photometers.
The estimated precision of the direct AOD measurements is ∼ 0.01 (at 440 nm) for a recently calibrated instrument (Holben et al., 1998), and the uncertainties are well docu-mented (Dubovik et al., 2000). During the period of the sim-ulation, data from 53 stations of the network are available within the domain, with values each day of the summer of 2012 (Fig. 1).
Surface site measurements do not allow a full regional evaluation, particularly around the Mediterranean basin, which is poorly covered. Satellite observations therefore of-fer a good complement. MODIS is carried on board the Terra and Aqua satellites (NASA) and enables a daily near-global coverage of the Earth with its large swath of almost 2330 km. The satellites cross the equator at about 10:30 and 13:30 UTC (ascending node), respectively. The mea-surements over 36 spectral bands (from 0.41 to 15 µm) al-low the retrieval of many aerosols properties. For this study, the aerosol products MOD04 (for Terra) and MYD04 (for Aqua) from L2 5.2 collection data are used (Remer et al., 2006). It includes daily AOD at 550 nm, as well as the
Deep-Blue AOD (Sayer et al., 2013) that provides AOD over bright land areas (especially useful here for North Africa). They are available at 10 km × 10 km resolution. The ex-pected error for the AOD is ±0.05 ± 0.15 AOD over land and
±0.03 ± 0.05 AOD over ocean, with a good agreement with ground based measurements (Remer et al., 2005).
The data coverage over the studied time period is shown in Fig. 1. The Mediterranean basin presents AOD values al-most every day. For eastern Europe and the Balkans, fewer AERONET or AirBase stations are available. The north of Europe is under-represented during the period, due to recur-rent clouds in the area.
The AOD at 550 nm from the AERONET and MODIS data sets have been compared over the studied region and time pe-riod. Both data sets are coherent in variability and levels (not shown): correlation coefficients range from 0.71 in MED-Ea to 0.96 in NEU-We and there is a slight overestimation of MODIS compared to AERONET measurements (mean frac-tional bias of 7 % on average).
Spatial patterns of AOD over the region are similar to the ones observed in terms of surface PM concentrations (Fig. 2, bottom right panel), with high values at the south of the do-main (up to 2 for North Africa and all around the Mediter-ranean Sea on a seasonal average), the Po Valley and north-ern Europe (up to 1.2). MODIS allows a better coverage than surface measurements in some regions, like North Africa, the Mediterranean Sea, the Atlantic Ocean, the Balkans and the eastern part of the domain (eastern Europe, Middle East, etc.) For example, large values of AOD, from 1 to 2, are observed with MODIS in the Balkans.
Time series for three AERONET stations are shown in Fig. 4. Clear enhancements are detected above Granada at the end of June (19 and 25–26 June), and in August (2, 8–9 and 18 August). The Timisoara station shows values around 1 on 24 August for both MODIS and AERONET. Finally, ob-servations at Belsk in Poland show lower values but a notable peak around 1 July.
A comparison of these AOD observations for 2012 against the climatology from Nabat et al. (2013), which includes the AOD from 2003 to 2009 using both model and satellite-derived AOD products, indicates that this summer was in the average regarding the aerosol load. Exceptions appears in June when the AOD was higher than the climatology in North Africa and over the Atlantic Ocean near North African coasts (due to a strong dust event Nabat et al., 2015), and in Au-gust with high values over the Balkans and over the Mediter-ranean close to the Spanish coastline. There are also higher punctual values in Spain in July. This comparison shows that the period was affected by air pollution from different spo-radic events.
From this analysis, several regions and time periods with enhanced aerosol concentrations are identified during the summer of 2012. North Africa and the western Mediter-ranean basin were regularly affected by the highest aerosol loads, with extreme peaks around 26 June and three times
Figure 4. Time series from 1 June to 31 August of the daily AOD at 500 nm from three AERONET stations. Top station is Granada in Spain, middle is Timisoara in Romania, and bottom is Belsk in Poland. Values from MODIS at 550 nm are also indicated in red dots at these stations, as well as the simulated spatially co-localized 550 nm AOD from CHIMERE (blue line).
in August (daily mean of around 130 µg m−3 for PM10 and
AOD around 1). Eastern Europe appears to show other influ-ences with high concentrations of surface PM at the end of June, the end of July and the end of August (daily mean of 40 µg m−3for PM10, AOD up to 0.8). In the Balkans, MODIS
also observed relatively high AOD (around 1) at the end of August.
3 Modeling tools
The sensitivity of aerosol concentrations in the region to each source is evaluated using the CHIMERE regional CTM, driven by meteorological simulations performed using the mesoscale non-hydrostatic Weather Research and Forecast-ing (WRF) model.
The analysis is focused on the summer of 2012 (1 June to 31 August 2012), with a 10-day spin-up. The simulation do-main is chosen to include all contributing sources around the basin (including North Africa until the Sahel, a part of the Atlantic Ocean, and eastern and northern Europe). A Lam-bert conformal projection is used with a constant horizontal resolution of 50 km × 50 km. The domain is represented in Fig. 5.
This section introduces the models used, their configura-tion for this analysis, the emissions databases as well as the numerical approach used.
3.1 The WRF meteorological model
The meteorological fields are simulated using the WRF model version 3.5.1 (Skamarock et al., 2008), on a 50 km horizontal grid (same horizontal domain described above). The simulation has been performed with boundary condi-tions and nudging from the meteorological analysis data of NCEP (Kalnay et al., 1996), provided on a regular 1.125◦×1.125◦grid.
The model is used in its non-hydrostatic configuration. The vertical grid covers 30 levels from the surface to 50 hPa. The WRF Single-Moment 6-class (Hong and Lim, 2006) is used for microphysics, and RRTMG (Iacono et al., 2008) and the Dudhia schemes (Dudhia, 1989) are used for long and short wave radiation, respectively. The surface layer scheme is based on the Monin-Obukhov scheme (Janjic, 1996). Sur-face planetary boundary layer physics use the Noah Land Surface Model (Chen and Dudhia, 2001) and Yonsei Uni-versity scheme (Hong et al., 2006), and the cumulus parame-terization is based on the Kain–Fritsch scheme (Kain, 1993). The WRF simulation outputs are then linearly interpolated on the vertical resolution of CHIMERE and used to diagnose additional parameters (e.g., boundary layer height, friction velocity). Both meteorology and chemical concentration out-put fields are provided at 1 h time intervals.
3.2 The CHIMERE chemistry-transport model
CHIMERE is an off-line regional CTM forced by emis-sions (see Sect. 3.3), meteorological fields (see Sect. 3.1) and boundary conditions. The model version chimere2014 (Menut et al., 2013) is used here on the 50 km horizontal resolution grid described above. The vertical discretization consists in 18 uneven levels in hybrid sigma-pressure coordi-nates, from the surface up to 200 hPa and with 8 levels under 800 hPa.
The reduced chemical mechanism called MELCHIOR2 is used here and includes 44 species involved in almost 120 re-actions. The list of species and reactions is provided in Menut et al. (2013). The aerosol module developed by Bessagnet et al. (2004) allows the simulation of primary particulate matter and secondary species: nitrates, sulfates, ammonium, primary organic matter (POM), secondary organic aerosol (SOA), elemental carbon (EC), marine aerosols and mineral dust. Their life cycle is represented with a complete scheme of nucleation, absorption, adsorption, desorption, coagula-tion, as well as wet and dry deposition and scavenging. The size distribution is simulated using a sectional representation, i.e., using five diameter bins: 40–150 nm, 150–630 nm, 630– 2500 nm, 2.5–10 µm, and 10–40 µm.
Figure 5. Total fluxes of different aerosol precursors or primary aerosol from each source averaged during the summer of 2012: anthropogenic emissions of nitrogen oxides (NOx), biogenic emissions of volatile organic compounds (VOCs), fire emissions of primary organic matter
(POM), mineral dust and sea salt emissions.
Initial and boundary conditions are provided by 5-year monthly averaged simulations by the LMDZ-INCA global model for aerosols and trace gases (Folberth et al., 2006), and GOCART for mineral dust (Ginoux et al., 2001).
The photolysis rates are calculated online using the Fast-JX module, version 7.0b (Wild et al., 2000; Bian and Prather, 2002) as described in Menut et al. (2013). The module com-putes the actinic fluxes by resolving the radiative transfer in the modeled atmospheric column. The treatment of op-tical properties is made by taking into account absorption by tropospheric and stratospheric ozone, Rayleigh scattering, absorption by aerosols, and Mie diffusion by aerosols and by liquid- and ice-water clouds. The total AOD is also ob-tained from these calculations, with an internal mixing state assumption for aerosols, at five different wavelengths: 200, 300, 400, 600 and 1000 nm (Mailler et al., 2015). As the cal-culation of the photolysis rates is performed at each physical time step taking into account the actualized concentrations of ozone and aerosols, this methodology allows radiative feed-back of aerosol and ozone concentrations on photolysis rates. In this study, the simulated AOD from CHIMERE at 500 and 550 nm are used and extracted using the Angström coeffi-cient from the output wavelengths.
3.3 Emissions
This section briefly describes the databases used for both primary particulate matter emissions and the emission of gaseous precursors.
Anthropogenic emissions are the only emissions that can be controlled; their inventories are updated constantly to take
into account precise emissions in scenario studies. In this paper, the EDGAR-HTAP_V2 inventory for the reference year 2010 is used. It uses HTAP (Hemispheric Transport of Air Pollution) annual total masses that include nationally re-ported emissions combined with regional scientific invento-ries, complemented with EDGARv4.3 data (http://edgar.jrc. ec.europa.eu/htap_v2/index.php?SECURE=123). The inven-tory provides global annual emissions for CH4, NMVOC,
CO, SO2, NOx, NH3, PM10, PM2.5, BC and OC, with a
res-olution of 0.1◦×0.1◦. The annual emitted masses are disag-gregated into model species and mapped onto the specified grid. Hourly emissions are estimated by applying seasonal, daily and weekly factors depending on the SNAP (Selected Nomenclature for Air Pollution) sectors (Menut et al., 2012). Anthropogenic emissions represent 90 to 100 % (among all other sources) of the regional emissions of NOx, NH3 and
SO2, which are important precursors of inorganic aerosol
for-mation. For example, the total fluxes of NOx in the region
for the summer of 2012 are shown in Fig. 5. Anthropogenic emissions (excluding forest fires) also amount to 53 % of pri-mary organic matter emissions, 81 % of black carbon sions, and 74 % of other primary particulate matter emis-sions.
Biogenic emissions fluxes are calculated using the global Model of Emissions of Gases and Aerosols from Nature (MEGAN; Guenther et al., 2006) and affect six CHIMERE species (isoprene, α-pinene, β-pinene, limonene, ocimene and NO). MEGAN is based on canopy-scale emission factors depending on the species. In their analysis of isoprene emis-sions over Europe, Curci et al. (2010) compared CHIMERE
simulation to satellite observations and found that MEGAN isoprene emissions might be 40 % higher over the Balkans, 20 % too high over southern Germany, and 20 % too low over Iberian Peninsula, Greece and Italy. In Fig. 5, showing the calculated total biogenic fluxes of VOCs in Europe and the Mediterranean basin during the summer of 2012, we can see that the majority of the emissions fluxes are located in the Balkans and eastern Europe, and in general in the northern European part of the domain.
Mineral dust emissions use fluxes calculation with the Marticorena and Bergametti (1995) parametrization for salta-tion and the optimized dust producsalta-tion model (Alfaro and Gomes, 2001; Menut et al., 2005) for sandblasting. The dust production model uses the model presented in Menut et al. (2013), which has been extended to be applicable to any re-gion and not just North Africa (Briant et al., 2014). It uses new global soil and surface input data sets along with the global ASCAT/PARASOL aeolian roughness length data set (Prigent et al., 2012). Parameterizations for humidity (Fé-can et al., 1999) and seasonal vegetation variation were in-cluded. Since long-range transport from North Africa affects strongly the Mediterranean basin and Europe, the simulation domain was chosen in order to include western Africa and the Sahel, known to be active mineral dust sources (Israelevich et al., 2002; Prospero et al., 2002). In Fig. 5, representing the mineral dust emissions computed for the study, the majority of them are located in this region. Transport from the Sa-hel band where the most active sources are found is mainly towards the Atlantic. Mineral dust particles are chemically inert in CHIMERE, but their size distribution is affected by wet and dry deposition. Dust emissions and deposition are strongly affected by meteorological fields, leading to large uncertainties (Menut et al., 2007, 2009).
Fire emissions are calculated using the APIFLAME v1.0 emissions model, described in Turquety et al. (2014), with a classical approach of multiplying the burned area by the fuel load consumed and the emission factors specific to the veg-etation burned. Fire emissions are injected homogeneously onto the boundary layer for this study. This parametrization can lead to uncertainties on the results as it impacts the trans-port of polluted plumes. The uncertainties concerning fire emissions are high, due to the accumulation of uncertainties on the emission factors, the area burned, the type of vege-tation, etc. The uncertainty in the daily carbon emission is estimated at 100 % (Turquety et al., 2014), and using differ-ent invdiffer-entories can lead to differences from −70 to 450 % for outputs concentrations of CO (Daskalakis et al., 2015). The injection height can also be a source of uncertainty, as it can impact the transport pathway of a fire plume. Fires are the dominant source of primary organic matter, black car-bon and other primary particulate matter in the MED-We (76, 34, and 58.6 %, respectively) and MED-Ce (89.2, 46.4, and 69.9 %, respectively) regions during the summer of 2012, where they occurred mainly in the Balkans and in the Iberian Peninsula (Fig. 5). A smaller fraction of gaseous precursors
is also emitted by fires (between 9 and 15 % for NOx and
NH3in MED-Ce). The distribution of primary organic
mat-ter fire emissions is shown in Fig. 5. Regions affected by fires during this period are mostly located in the Balkans and in Spain.
The calculation of sea salt emissions is based on the Mona-han (1986) scheme. Marine aerosols are produced from bub-ble bursting of whitecaps, generated by surface winds. The largest emissions occur over the Atlantic Ocean.
3.4 Sensitivity analysis
The CHIMERE CTM has been used to perform a number of sensitivity simulations, each with one source eliminated. The aim is to provide the approximate impact from the main different regional source types. A complete budget would re-quire the consideration of transport from boundary condi-tions as an additional source as well as the different sinks (wet and dry deposition, outflow). However, our main ob-jective is to quantify the relative contribution from natural sources (dust, sea salts, fires, biogenic emissions of precur-sors) inside the regional domain, since these emissions cnot be controlled by regulations. Only these sources and an-thropogenic sources are thus considered.
All the results will be presented in terms of the difference between the reference simulation (all sources included) and the simulation in which the specific source is removed. For instance, to obtain the contribution of fire emissions to the concentration of a pollutant [X], called [X]fire, we computed
[X]fire= [X]ref− [X]without_fire_emissions
The acronyms associated with the sensitivity simulations undertaken for the study are ANTH, BIOG, FIRE, DUST, and SALT for the baseline simulation minus the simulation without anthropogenic, biogenic, fire, mineral dust and sea salt emissions, respectively.
Note that the sum of all individual sources may not amount to the reference concentrations of PM due to non-linearities in chemical processes. However, PM sensitivity studies show that the main conclusions do not change with other methods such as source apportionment or direct decoupled sensitivity, if the formation of secondary species is not significant (Koo et al., 2007, 2009; Burr and Zhang, 2011).
In our study, the amount of PM2.5 and PM10 formed by
non-linear processes can be evaluated in the reference simu-lation. Therefore, the relative contribution from SOA and ni-trates, which will be most impacted by non-linearities, to the total PM concentrations is calculated. On average over the domain and for the reference simulation during the summer of 2012, 2.5 % of total PM2.5is composed of SOA, and 1.3 %
of nitrates. Contributions to total PM2.5 from the sensitivity
simulations have been evaluated to 1.3 and 1.1 % of SOA and nitrates, respectively, from anthropogenic sources, and 1.5 % and maximum 0.01 % of SOA and nitrates from
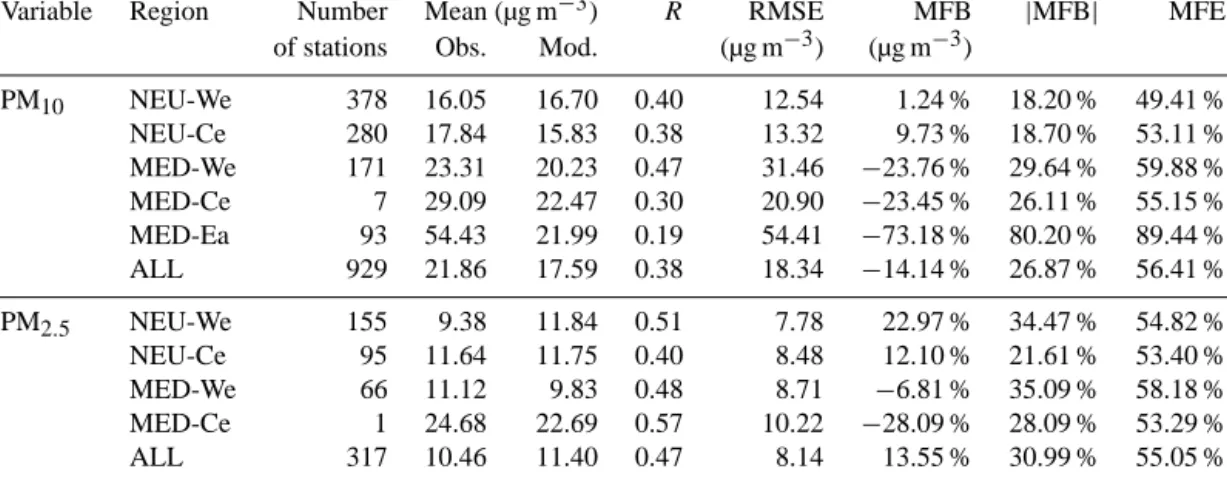
bio-Table 2. Performance statistics for the simulation of hourly PM with CHIMERE (Mod.) compared to coincident surface station measurements (Obs.) during the summer of 2012.
Variable Region Number Mean (µg m−3) R RMSE MFB |MFB| MFE of stations Obs. Mod. (µg m−3) (µg m−3)
PM10 NEU-We 378 16.05 16.70 0.40 12.54 1.24 % 18.20 % 49.41 % NEU-Ce 280 17.84 15.83 0.38 13.32 9.73 % 18.70 % 53.11 % MED-We 171 23.31 20.23 0.47 31.46 −23.76 % 29.64 % 59.88 % MED-Ce 7 29.09 22.47 0.30 20.90 −23.45 % 26.11 % 55.15 % MED-Ea 93 54.43 21.99 0.19 54.41 −73.18 % 80.20 % 89.44 % ALL 929 21.86 17.59 0.38 18.34 −14.14 % 26.87 % 56.41 % PM2.5 NEU-We 155 9.38 11.84 0.51 7.78 22.97 % 34.47 % 54.82 % NEU-Ce 95 11.64 11.75 0.40 8.48 12.10 % 21.61 % 53.40 % MED-We 66 11.12 9.83 0.48 8.71 −6.81 % 35.09 % 58.18 % MED-Ce 1 24.68 22.69 0.57 10.22 −28.09 % 28.09 % 53.29 % ALL 317 10.46 11.40 0.47 8.14 13.55 % 30.99 % 55.05 %
genic emissions. Contributions are 0.04 and 0.02 % of SOA and nitrates, respectively, from fire sources.
4 Evaluation of model results
This section presents the results of the reference simulation (all emissions included), evaluated against the observations presented in Sect. 2, to quantify the model performance for aerosol modeling.
4.1 Comparison with in situ PM surface concentrations
Surface PM simulation is evaluated using the correlation, the mean fractional error (MFE) and the mean fractional bias (MFB) between observations and collocated modeled surface concentrations: MFB = 1 N N X i=1 (Cmod−Cobs) (Cmod+Cobs)/2 ; (1) MFE = 1 N N X i=1 |Cmod−Cobs| (Cmod+Cobs)/2 . (2)
These statistical indicators are widely used in PM perfor-mance evaluation studies. Proposed by Boylan and Russell (2006) for PM, both the MFE and MFB must be lower than or equal to 50 and ±30 %, respectively, to achieve the perfor-mance goals (level of accuracy considered to be close to the best a model can be expected to achieve), and must be lower than or equal to 75 and ±60 % to meet the performance cri-teria (level of accuracy acceptable for standard modeling ap-plications). The MFB and MFE are computed at each station, and averaged. Additionally, the absolute MFB for each sta-tion is averaged, and the correlasta-tion coefficient (R) and the
root mean square error (RMSE) are computed:
RMSE =
s PN
i=1(Cmod−Cobs)2
N (3)
Tables 2 and 3 summarize the hourly and daily statis-tical results averaged over the regions NEU-We (378 sta-tions for PM10 and 155 for PM2.5), NEU-Ce (280 and
95), MED-We (171 and 66), and MED-Ea (93 stations for PM10). MED-Ce do not contain enough AirBase
sta-tions to allow statistically significant comparison (7 for PM10 and 1 for PM2.5). For the time period and the
en-tire domain of this study, the MFE and MFB on daily mean values are 46.25 and 29.28 %, respectively, for PM10,
and 43.74 and 31.18 % for PM2.5. CHIMERE PM10 daily
mean values thus meet the performance goal and PM2.5
the performance criteria defined above. For hourly com-parisons, the performance goal is not met on average over the region (MFE = 56.41 % and MFB = 26.87 % for PM10,
MFE = 55.05 % and MFB = 30.99 % for PM2.5), but the
model performance criteria are met. Indeed, the performance criteria are met for more than 90 % of all the stations, and the performance goal is met for more than 40 % of them.
In the regional comparisons, the highest differences are obtained in the MED-Ea region (26.9 % of the stations meet the performance criteria and only 3.2 % the performance goal for PM10). A strong underestimation is noticed in this region
with a MFB = −73.18 %.
In the MED-We region, 82.5 % of the stations meet the performance criteria and 25.7 % the performance goal for PM10. Peak concentrations are often overestimated by the
model for both PM10 and PM2.5, whereas levels are
under-estimated otherwise (MF = −23.8 and −6.8 %, respectively, for PM10and PM2.5).
The MFB is relatively good for other regions (in general under 20 % except for NEU-We), indicating that PM concen-trations do not have an excessive bias. The correlation
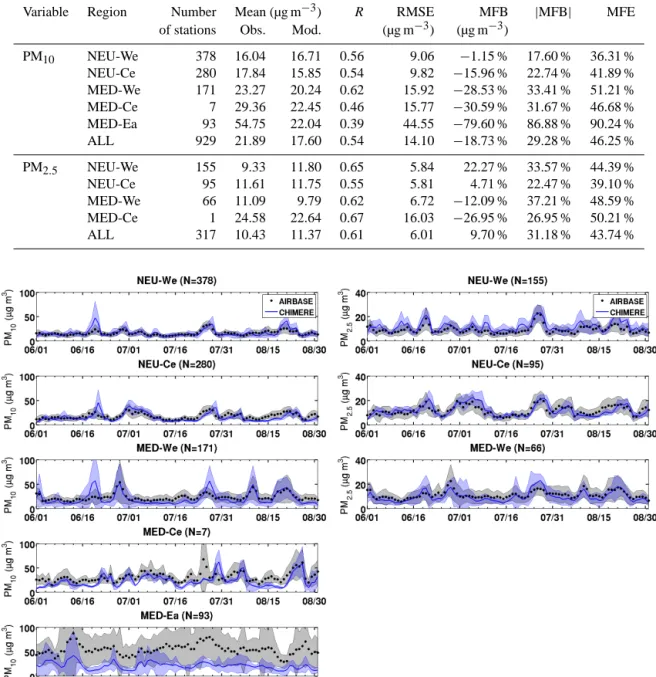
coef-Table 3. Performance statistics for the simulation of daily PM with CHIMERE (Mod.) compared to coincident station measurements (Obs.) during the summer of 2012.
Variable Region Number Mean (µg m−3) R RMSE MFB |MFB| MFE of stations Obs. Mod. (µg m−3) (µg m−3)
PM10 NEU-We 378 16.04 16.71 0.56 9.06 −1.15 % 17.60 % 36.31 % NEU-Ce 280 17.84 15.85 0.54 9.82 −15.96 % 22.74 % 41.89 % MED-We 171 23.27 20.24 0.62 15.92 −28.53 % 33.41 % 51.21 % MED-Ce 7 29.36 22.45 0.46 15.77 −30.59 % 31.67 % 46.68 % MED-Ea 93 54.75 22.04 0.39 44.55 −79.60 % 86.88 % 90.24 % ALL 929 21.89 17.60 0.54 14.10 −18.73 % 29.28 % 46.25 % PM2.5 NEU-We 155 9.33 11.80 0.65 5.84 22.27 % 33.57 % 44.39 % NEU-Ce 95 11.61 11.75 0.55 5.81 4.71 % 22.47 % 39.10 % MED-We 66 11.09 9.79 0.62 6.72 −12.09 % 37.21 % 48.59 % MED-Ce 1 24.58 22.64 0.67 16.03 −26.95 % 26.95 % 50.21 % ALL 317 10.43 11.37 0.61 6.01 9.70 % 31.18 % 43.74 %
Figure 6. Temporal evolution during the summer of 2012 of observed daily mean surface PM10 (left column) and surface PM2.5 (right
column) concentrations at AirBase and the two ChArMEx rural stations in Corsica (number in each region indicated by the value of N ), in addition to corresponding and collocated simulated daily mean surface concentration from CHIMERE (blue line). The corresponding standard deviation is indicated by a shaded area.
ficient is lower in the NEU-Ce region than in other regions except MED-Ea (0.38 for PM10 on 280 stations) for hourly
comparisons, but not for daily averages with a correlation co-efficient of 0.54. This suggests an influence of local sources for which the diurnal profiles used for the simulations may not be appropriate for the region.
Figure 6 shows the temporal evolution of surface PM, av-eraged daily over the NEU-We, NEU-Ce and MED-We
sub-regions, as well as MED-Ce and MED-Ea for PM10. The
levels of surface PM are consistent between observations and model, and the different peaks are well captured, es-pecially in the northern part of the domain. In the Mediter-ranean basin, model levels are underestimated between 4 and 24 July, when no peak is detected either by observations or by the model. Peaks of pollution during the end of July and August are slightly overestimated. For PM10, in
MED-We, NEU-We and NEU-Ce, a peak is overestimated by the model on 20 June by a factor of up to 4 (80 µg m−3instead
of 20 µg m−3in MED-We). High values are also observed for
this date at some of the Mediterranean stations such as Mira-mas (Fig. 3) but not at other stations where the model over-estimates strongly the peak value, particularly in the south of France. These peaks are attributed to a dust transport event as discussed in Sect. 5.1. However, there is no associated overestimation of AOD values by the model compared to the observations (MODIS or AERONET). This suggests that the overestimation in surface PM may be due to an overestimated transport at low altitudes, i.e., a wrong vertical distribution of the dust plumes. However, it may also be explained by an excess in total mass and a shift in the aerosol size distribu-tion towards finer particles, as highlighted by Menut et al. (2015) through comparisons of CHIMERE simulations with AERONET retrievals of the size distribution. An excess in PM concentration would then result in a correct AOD due to the variation of the extinction efficiency with the size of the aerosol.
4.2 Comparison with aerosol optical depth (AOD) measurements
To evaluate modeled AOD, we compare it to two data sets: MODIS satellite data and AERONET data at specific sta-tions. For each statistic, we collocate in time and space the simulated AOD with the corresponding data set.
Figure 7 illustrates the time series of observed AOD and corresponding simulated values for each sub-region, and Ta-ble 4, the associated statistics. The modeled AOD is close to the observations in all regions except for NEU-We, with a correlation coefficient ranging from 0.56 (NEU-Ea) to 0.77 (MED-Ce) and a MFE of 34.3 % for comparisons to AERONET and 27.6 % for comparisons to MODIS. The sim-ulated AOD is underestimated in the eastern and southern parts of the domain, with a MFB of −10 % in MED-Ea for AERONET, −31.4 % for MODIS. In MED-Ea, the evalua-tion with MODIS data is more robust as there is more in-formation than AERONET data in this sub-region (Fig. 1). This underestimation is also seen in the time series of Fig. 7 and coherent with the underestimation of PM10noticed in the
previous section. The variability of observations is greater than in the model, and than in other regions. The fine fraction of AOD from MODIS (not shown) is low, indicating that the total AOD in this region is due to coarse particles. The model is thus missing some coarse particle sources in this area.
Highest values are seen in MED-We, and the model man-ages to reproduce these values at the right timing (highest correlation coefficient) even if it moderately underestimates them (MFB of −27.4 % with respect to MODIS). Particu-larly, the peak at the beginning of July is underestimated by CHIMERE. The region with the lowest error and bias is MED-Ce, where the frequency and the intensity of peaks are lower.
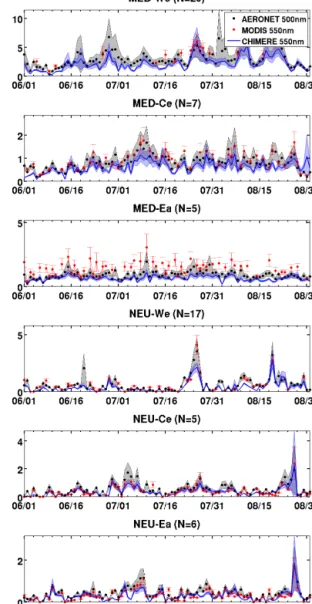
Figure 7. Temporal evolution of the daily mean AOD observed at 500 nm at the AERONET stations (black dots) and at 550 nm from MODIS Aerosol Products (red dots), in addition to simulated AOD at 550 nm by the CHIMERE model (blue line) during the summer of 2012. The standard deviation among the stations is indicated in grey and blue shaded area for AERONET and CHIMERE, respectively, and with red bars for MODIS. Number of stations in each region is indicated by the value of N .
5 Regional sensitivity to emission sources
In this section, the sensitivity of surface PM concentrations and total AOD to the different sources is analyzed based on the series of sensitivity simulations described in Sect. 3.4.
5.1 Surface particulate matter
Average relative contributions during the summer of 2012 to surface PM2.5 and PM10 over the domain are presented
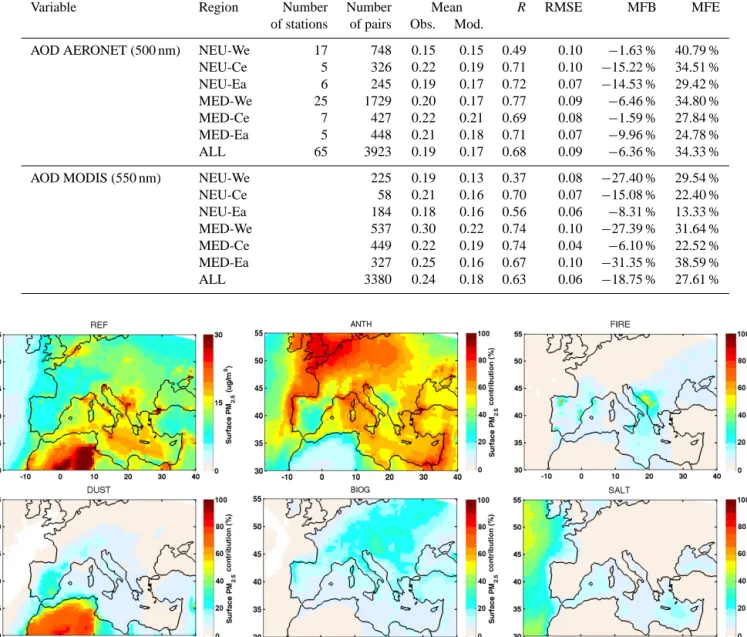
Table 4. Performance statistics of hourly AOD simulated by CHIMERE (Mod.) during the summer of 2012, compared to the coincidently observed AOD from AERONET at 500 nm and MODIS at 550 nm (Obs.).
Variable Region Number Number Mean R RMSE MFB MFE of stations of pairs Obs. Mod.
AOD AERONET (500 nm) NEU-We 17 748 0.15 0.15 0.49 0.10 −1.63 % 40.79 % NEU-Ce 5 326 0.22 0.19 0.71 0.10 −15.22 % 34.51 % NEU-Ea 6 245 0.19 0.17 0.72 0.07 −14.53 % 29.42 % MED-We 25 1729 0.20 0.17 0.77 0.09 −6.46 % 34.80 % MED-Ce 7 427 0.22 0.21 0.69 0.08 −1.59 % 27.84 % MED-Ea 5 448 0.21 0.18 0.71 0.07 −9.96 % 24.78 % ALL 65 3923 0.19 0.17 0.68 0.09 −6.36 % 34.33 % AOD MODIS (550 nm) NEU-We 225 0.19 0.13 0.37 0.08 −27.40 % 29.54 % NEU-Ce 58 0.21 0.16 0.70 0.07 −15.08 % 22.40 % NEU-Ea 184 0.18 0.16 0.56 0.06 −8.31 % 13.33 % MED-We 537 0.30 0.22 0.74 0.10 −27.39 % 31.64 % MED-Ce 449 0.22 0.19 0.74 0.04 −6.10 % 22.52 % MED-Ea 327 0.25 0.16 0.67 0.10 −31.35 % 38.59 % ALL 3380 0.24 0.18 0.63 0.06 −18.75 % 27.61 %
Figure 8. Relative contribution of each source type (i.e., the baseline simulation minus the sensitivity simulation where the respective source has been eliminated) to the simulated surface PM2.5, averaged over the period (1 June to 31 August 2012). The top left represents the
reference surface concentration over the same period.
the different source types in each sub-region of Table 1. As already highlighted in the general evaluation of the simula-tions, surface concentrations and total AOD are the largest over North Africa and the Mediterranean area, especially the western Mediterranean area.
Table 5 shows that concentrations of PM10are about three
time higher than those of PM2.5 (38.3 vs. 13 µg m−3 on
av-erage over the total period and domains). Surface PM10also
presents a stronger spatial variability (concentrations of sur-face PM10ranges on average from 13.2 µg m−3in NEU-Ea to
88.2 µg m−3in MED-We, whereas concentrations of surface
PM2.5ranges from 9.5 µg m−3in NEU-We to 15.7 µg m−3in
MED-Ce).
The two most important contributors in the domain are anthropogenic and mineral dust emissions, which account, on average, respectively, for 52 and 17 % of surface PM2.5,
and 19 and 62 % of surface PM10. Anthropogenic emissions
clearly dominate both surface PM2.5and PM10in the
north-ern part of the domain (up to 90 and 75 % on average) but are also the main contribution to surface PM2.5 above the
Mediterranean basin (∼ 50 %) and most particularly, as ex-pected, around populated coastal areas.
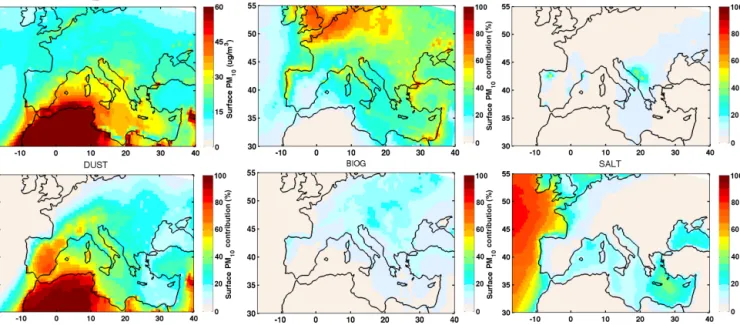
Figure 9. Relative contribution of each source type (i.e., the baseline simulation minus the sensitivity simulation where the respective source has been eliminated) to the simulated surface PM10, averaged over the period (1 June to 31 August 2012). The top left represents the reference surface concentration over the same period.
Since the main dust emissions are located in North Africa, dust dominate the aerosol budget in this region. They also represent the main contribution to surface PM10
concentra-tions in the western Mediterranean area (Spain, south of France and Italy). The average contribution of mineral dust in the MED-We region is estimated to 86 % for surface PM10
and 44 % for PM2.5. In this region, the mean
concentra-tion of surface PM10over the period is exceeding the
Euro-pean threshold of 50 µg m−3 (88.17 µg m−3). The contribu-tion of mineral dust alone in this region exceeds this thresh-old (75.63 µg m−3). Long-range transport also results in sig-nificant contributions in northern Europe (22 % of surface PM10on average in region NEU-Ce).
Fire emissions are more sporadic and thus represent a lower contribution to the average surface concentrations. However, significant increase during the summer of 2012 is obtained in Spain and the Balkans, close to the main fire events (Fig. 5). The maps show an impact reaching up to 20 % locally on average during the summer (Figs. 8 and 9). The largest regional contribution is obtained for the MED-Ce region, with 12 % of PM2.5associated with fires.
As expected, sea salt emissions are the main contribution to PM above the Atlantic Ocean. However, their relative con-tribution above continents is low, except in the coastal areas and over northwestern Europe, where it reaches 29 % of sur-face PM10. Over coastal cities, the impact of sea salts at the
surface can be as large as that of anthropogenic emissions. Biogenic emissions have an important contribution to PM in central Europe, where they are mainly located (Fig. 5). They account for almost 20 % of surface PM2.5in the
NEU-Ce region.
Figure 11 shows the temporal evolution of surface PM2.5
and PM10, and their associated source contributions,
inte-grated over the different sub-regions depicted in Table 1: NEU-We, NEU-Ce and NEU-Ea, MED-We, MED-Ce and MED-Ea. It shows that the daily variability above the chosen regions is large, especially for surface PM10, with diverse
contributions. The variability in the northern part of the do-main is do-mainly controlled by anthropogenic emissions. How-ever, surface PM10concentrations in the NEU-We region are
also frequently affected by mineral dust (20–21 June, 1 July, end of August) and by sea salts. In the Ce and NEU-Ea regions, most of the high peaks in PM10are attributed to
mineral dust transport events.
Extreme concentrations are simulated in the western and central Mediterranean areas (MED-We and Ce), here again mainly due to large contributions from mineral dust emis-sions. These impact mainly surface PM10, while PM2.5 are
often dominated by a more constant contribution from an-thropogenic emissions. Fires are another significant contribu-tion in these regions at the end of July and August for surface PM2.5.
Comparisons to surface observations highlighted an over-estimate of the largest PM10 peaks in the simulations in the
NEU-We, NEU-Ce and MED-We regions (Fig. 11). This suggests that mineral dust transport at low altitudes is too large in the model.
5.2 Vertical distributions and AOD
Figure 12 presents the vertical distributions of PM in the simulations, averaged over each of the sub-regions. As
al-Table 5. Contributions of each emission source type to surface PM2.5and PM10concentrations and AOD for the full domain and the different sub-regions indicated in Table 1 over the period (1 June to 31 August 2012).
Region Source Surface PM2.5 Surface PM10 AOD µg m−3 % µg m−3 % ad. % All domain All sources 13.00 38.28 0.19
Anthropogenic 6.76 52.01 % 7.10 18.56 % 0.07 33.95 % Fires 0.82 6.27 % 0.92 2.39 % 0.01 5.46 % Dust 2.17 16.67 % 23.87 62.35 % 0.05 23.26 % Biogenic 1.41 10.83 % 1.43 3.75 % 0.03 14.04 % Sea salt 0.59 4.53 % 2.73 7.12 % 0.0012 0.59 % NEU-We All sources 9.46 15.10 0.18
Anthropogenic 7.11 75.13 % 7.44 49.28 % 0.10 54.87 % Fires 0.12 1.22 % 0.13 0.86 % 0.00 2.20 % Dust 0.15 1.62 % 1.18 7.84 % 0.01 4.83 % Biogenic 0.68 7.24 % 0.69 4.57 % 0.01 5.01 % Sea salt 0.68 7.19 % 4.33 28.70 % 0.00 1.14 %
NEU-Ce All sources 11.36 15.86 0.20
Anthropogenic 7.16 62.98 % 7.56 47.67 % 0.09 42.65 % Fires 0.42 3.66 % 0.45 2.82 % 0.01 4.62 % Dust 0.52 4.58 % 3.45 21.78 % 0.02 9.97 % Biogenic 2.48 21.83 % 2.51 15.82 % 0.04 21.51 % Sea salt 0.16 1.42 % 0.58 3.68 % 0.00 0.43 %
NEU-Ea All sources 9.78 13.24 0.19
Anthropogenic 4.91 50.14 % 5.30 40.00 % 0.06 33.99 % Fires 0.72 7.31 % 0.75 5.64 % 0.01 7.26 % Dust 0.35 3.57 % 2.28 17.19 % 0.02 7.95 % Biogenic 1.51 15.45 % 1.53 11.57 % 0.04 22.01 % Sea salt 0.12 1.27 % 0.43 3.27 % 0.00 0.26 % MED-We All sources 15.15 88.17 0.23
Anthropogenic 4.92 32.50 % 5.17 5.86 % 0.04 18.72 % Fires 0.83 5.45 % 0.95 1.08 % 0.01 4.51 % Dust 6.54 43.19 % 75.63 85.78 % 0.11 49.20 % Biogenic 0.82 5.38 % 0.84 0.95 % 0.02 7.12 % Sea salt 0.62 4.12 % 2.96 3.36 % 0.00 0.58 % MED-Ce All sources 15.66 33.22 0.20
Anthropogenic 8.54 54.55 % 8.89 26.77 % 0.06 31.50 % Fires 1.91 12.22 % 2.16 6.51 % 0.02 9.82 % Dust 1.36 8.66 % 14.39 43.31 % 0.04 22.64 % Biogenic 1.84 11.77 % 1.90 5.70 % 0.03 16.75 % Sea salt 0.90 5.75 % 3.60 10.83 % 0.00 0.57 %
MED-Ea All sources 12.90 22.90 0.17
Anthropogenic 7.83 60.67 % 8.24 35.98 % 0.07 41.01 % Fires 0.45 3.48 % 0.50 2.20 % 0.01 3.81 % Dust 0.78 6.06 % 7.09 30.98 % 0.02 10.88 % Biogenic 1.42 11.02 % 1.45 6.34 % 0.03 18.64 % Sea salt 0.67 5.17 % 2.84 12.40 % 0.00 0.46 %
ready highlighted in the discussion above, surface concentra-tions are strongly affected by anthropogenic emissions, ex-cept in the western and central Mediterranean basins, which are dominantly affected by mineral dust transport. The ver-tical structures of the simulated dust layers have been
eval-uated in Vuolo et al. (2009) with CALIOP LIDAR profiles during June to September 2006 and January to March 2007. It has been shown that the model has a vertical overspread of 50 % in summer compared to the observations, but fewer multilayer dust situations. However, in We and
MED-Figure 10. Relative contribution of each source type (i.e., the baseline simulation minus the sensitivity simulation where the respective source has been eliminated) to the simulated AOD at 550 nm, averaged over the period (1 June to 31 August 2012). The top left represents the reference simulation of AOD over the same period.
Ce, the vertical contribution from dust ranges from the sur-face to about 4–5 km (Fig. 12), which is a usual pattern com-pared to the climatology of Nabat et al. (2013). Dust affects mainly the free troposphere over the northern regions.
Fires and biogenic emissions are also important contribu-tions, particularly for PM2.5. They often have maximum
con-tributions in the lower troposphere. Sea salts contribute to PM10 in western Europe and the Mediterranean region, as
well as in the central Mediterranean region, but are confined to the lower-most troposphere.
Contributions to the total AOD, which includes the sig-nature of aerosols over the full vertical column, follow the same general patterns as the contributions to surface PM10
discussed above (average relative contributions in Fig. 10 and Table 5). However, the contribution of sea salts remains very low (< 1 %).
Temporal variability over the selected sub-regions (Fig. 11, third column) shows that, similarly to what was ob-tained for surface PM, anthropogenic emissions control the variability in the NEU-We region, while mineral dust emis-sions are the main contribution in the MED-We region. The fire episodes of the end of August also contribute signifi-cantly to the total AOD in the NEU-Ea and MED-Ce regions. Compared to the total column (vertically integrated) concen-trations of PM (not shown), source contributions to AOD follow contributions to PM2.5concentrations. At the
consid-ered wavelength (500 nm), fine particles from anthropogenic or local fire emissions, even concentrated in the first layers, contribute more significantly (34 % for mean anthropogenic contribution) than larger mineral dust particles (23 %) at the considered wavelength (500 nm) to the calculated AOD.
6 Contributions to air quality threshold exceedances
The European Union has developed legislations to establish health-based standards for a number of atmospheric pollu-tants. For PM10, the air quality limit value is set, for
health-based considerations, to a daily mean of 50 µg m−3and an annual mean of 40 µg m−3. For PM2.5, there is no
regula-tion in Europe except for a quality aim of 25 µg m−3in an-nual mean. In this section, the exceedances of the daily mean limit for PM10 concentrations are analyzed. We also
ana-lyze PM2.5 exceedances of a limit of 25 µg m−3 per 24 h
(World Health Organisation recommendation, Krzyzanowski and Cohen, 2008). The number of stations in daily ex-ceedances are calculated for both observations and co-located CHIMERE simulations. The simulations were under-taken at a regional scale, so that only exceedances at rural and background sites are considered.
6.1 Raw estimates
In total, 96.2 % of the PM10daily means are under the
thresh-old of 50 µg m−3 in both observations and co-located sim-ulation. The analysis will focus on the 3.8 % other cases. Figure 13 presents the number of stations where the daily mean concentrations of PM10 and PM2.5 are above 50 and
25 µg m−3, respectively, in the observations or the model simulations within each sub-region (only the sub-regions where there are stations to compare with).
It clearly shows that the model detects more exceedances than the observations in MED-We, NEU-We and NEU-Ce (in total 1964 vs. 881 in the observations for PM10,
some-Figure 11. Temporal evolution during the summer of 2012 (1 June to 31 August 2012) of the total daily simulated surface PM10 concen-trations (left column), surface PM2.5 concentrations (central column), and AOD (right column), with the contributions from each source
type (i.e., the baseline simulation minus the sensitivity simulation where the respective source has been eliminated), averaged within each sub-region indicated in Table 1.
times not at the same time (correlation coefficient of, re-spectively, 0.68, 0.42 and 0.43). In the MED-Ea region, sev-eral exceedances, particularly in the observations, are not re-produced in the model (MFB = −73.18 %). The model only sees exceedances from anthropogenic emissions (80 % of the cases). The global underestimation of PM10certainly due to
missing coarse particle sources described in Sect. 4.2 does not allow the analysis of exceedances in this region.
For PM10, 52.7 % of the 881 observed exceedances are
correctly captured by the model, the majority of them located in MED-We. More particularly, the event of 27–28 June is well simulated (Fig. 3) and is correctly detected in terms of number of stations in daily exceedances (29 exceedances for observations, 35 for the model, among the 92 stations). This is also the case for the two peaks in August (around 20– 30 exceedances). For PM2.5, only 23.5 % of exceedances are
correctly simulated, with the majority in NEU-We.
Figure 14 shows the contribution of each source when an exceedance is detected only by CHIMERE, and not in the observations. The peak of 20–21 June is present in the model simulations at almost every stations so that the number of simulated exceedances is a lot larger than in the observa-tional data set. The model-only exceedances associated with
this peak are attributed to mineral dust in the three regions (mixed with anthropogenic and biogenic contributions). The model also overestimates the number of stations in daily ex-ceedances at the end of July (37 vs. 6 for observations in MED-We, 82 vs. 14 for NEU-We for PM10), with
contri-butions from mineral dust, anthropogenic sources, and fires (stronger in MED-We and NEU-Ce).
Among the 464 PM10 exceedances detected by both the
model and the observations, 76.7 % are due exclusively to dust (i.e., the dust source contributes to the PM10
sur-face concentration, when the exceedance is detected, for at least the value of the threshold, independently of the other sources), and 1.7 % to fires. The other 100 exceedances are due to a mix contribution of dust (from 78.1 % in MED-We to 85 % in NEU-We), anthropogenic sources (about 15 % in the three regions), biogenic sources (from 5.5 % in MED-We to 11.2 % in NEU-Ce) and fires (from 1.7 % in NEU-Ce to 10.2 % in MED-We). For PM2.5, 176 on 1063 detections
are coherent between the model and the observations, and 33.5 and 7.3 % are due exclusively to anthropogenic and fires sources, respectively. The other 104 exceedances are due to a mix between anthropogenic sources (from 64.2 % in MED-We to 92.1 % in NEU-MED-We), biogenic sources (from 14.4 %
Figure 12. Mean vertical profiles of PM10(left column) and PM2.5 (right column) for each sub-region indicated in Table 1 and for each
source type. The standard deviation is represented only for the reference simulation by the horizontal bars.
in We to 39.3 % in Ce), fires (from 1 % in NEU-We to 15.6 % in MED-NEU-We) and dust (1.7 % in NEU-NEU-We to 17.5 % in MED-We).
6.2 Optimized estimates
These source contributions to daily exceedances might be un-certain due to the high overestimation of the model. An op-timization is proposed to estimate more robust contributions of observed exceedances.
First, the bias on background levels is evaluated at each measurement station. The background is defined as the base-line concentration, on days when no significant peak is mea-sured. It is generally associated with anthropogenic and bio-genic sources, which have relatively low variability during the summer compared to dust and fire emissions.
The average “background bias” is estimated to
−6.3 µg m−3 for PM10 and −1.9 µg m−3 for PM2.5 in
MED-We, −0.93 and 1.3 µg m−3in NEU-We, and −3.2 and
−0.2 µg m−3in NEU-Ce, on average over all stations.
Then, for sporadic sources, i.e., for the dust and fires, the resulting bias at each point of a peak is subtracted only for contribution concentrations of the corresponding source. This processing is applied only when the model overesti-mates the concentrations with respect to observations, but not when a peak is detected only by the observations.
The corresponding new number of exceedances with this calculation is shown in Fig. 13 in a dashed blue line. The to-tal number of exceedances is then 549 and 256, respectively, for PM10 and PM2.5 (instead of 1964 and 1063 initially) in
total for the three regions, all of them detected also in the observations.
For these “optimized” concentrations, Fig. 15 shows the contribution of each source to the simulated exceedances. For the peaks at the end of June, the contribution of mineral dust to the exceedances is predominant particularly for PM10,
mixed with anthropogenic pollution and fires from 28 June to 3 July (fires alone contribute to three exceedances at that time), as well as biogenic emissions from 18 to 23 August. In total, the only sources that result exclusively (i.e., when their contribution alone to PM concentration is more than the
Figure 13. Number of stations in daily exceedances of the European Union air quality threshold of 50 µg m−3for daily mean PM10
con-centrations (left panel), and in daily exceedances of the WHO recommendation of 25 µg m−3for PM2.5concentrations (right panel). This
time series is computed during the summer of 2012 (1 June to 31 August 2012), as observed at the rural and background stations (black line) and simulated by the CHIMERE model at the same locations (red line). The dashed blue line is the number of exceedances when the bias is removed for each point, as described in Sect. 6.
threshold of 50 µg m−3) in an exceedance are dust (in 35.9 % of the cases, i.e., 197 exceedances on the 549 observed and simulated) and fires (in 0.7 % of the cases, i.e., 4 ex-ceedances). The other 348 exceedances are due to a mixed contribution of several sources: anthropogenic sources con-tribute from 14.9 % (NEU-We) to 24.2 % (NEU-Ce) of the concentrations, biogenic from 4.1 % (MED-We) to 15.7 % (NEU-Ce), fires from 2.2 % (NEU-Ce) to 7.2 % (MED-We), and dust from 49.5 % (MED-We) to 67 % (NEU-We).
For PM2.5exceedances, the only sources that result
exclu-sively in concentrations above 25 µg m−3are anthropogenic sources (54 exceedances on the 256 observed and simulated at the same time, i.e., 21.1 %) and fires (5 exceedances). The 197 other exceedances are a mix between anthropogenic sources (from 46.3 % in MED-We to 80.6 % in NEU-We), biogenic sources (12.6 % in MED-We to 30 % in NEU-Ce), fires (1.6 % in NEU-We to 12.4 % in MED-We) and min-eral dust (4.4 % in NEU-We to 13.8 % in MED-We). The WHO 25 µg m−3 limit recommendation is more often ex-ceeded because of high anthropogenic contributions than nat-ural sources.
Compared to the results without optimization, the main differences are for PM10, with fewer exceedances due
ex-clusively to dust (197 vs. 356) and with a lower proportion
to the 50 µg m−3limit (49.5–67 % vs. 78.1–85 %). Contribu-tions from the other sources (anthropogenic, biogenic, fires) are then lower than in the optimized results. This comparison means that the raw model simulation results are not robust enough to estimate contributions for an air quality purpose for PM10, but can be used as a valuable complement to
ob-servations to qualitatively attribute source types.
For PM2.5however, the differences between the
contribu-tions deduced from the model only and from the model op-timized with the observations are lower (for instance, 64.2– 92.1 % vs. 46.3–80.6 % for anthropogenic contribution to the WHO 25 µg m−3limit, 1.7–17.5 % vs. 4.4–13.8 % for
min-eral dust contribution), in coherence with the better perfor-mance of the model in the simulation of PM2.5
concentra-tions.
7 Conclusions
A sensitivity analysis was undertaken to estimate the contri-bution of anthropogenic, mineral dust, fire, biogenic and sea salt emissions on surface PM10, surface PM2.5and total AOD
during the summer of 2012 over Europe and the Mediter-ranean region. For this, simulations were performed using
Figure 14. Simulated relative contribution of each source type to surface PM10and PM2.5concentrations during the summer of 2012 (1 June
to 31 August 2012), on average when exceedances of the daily air quality threshold are detected only by the model at the stations (N is the number of stations in each region).
Figure 15. Same as Fig. 14 but when exceedances of the daily air quality threshold are detected by both observations and model after optimization of the background concentration baseline at the considered stations.
the CHIMERE regional CTM, including all sources (refer-ence simulation) and removing one of these source at a time (sensitivity study).
The reference simulation has been evaluated against ob-servations of surface PM from the AirBase network and two more stations in Corsica, and of AOD from the AERONET
network and the MODIS space-based instrument. Although the density of the AirBase network is relatively high in parts of Europe, there are fewer observations around the Mediter-ranean basin, which makes the evaluation of surface PM con-centration in those regions difficult.