HAL Id: hal-00830577
https://hal.archives-ouvertes.fr/hal-00830577
Submitted on 29 Nov 2019
HAL is a multi-disciplinary open access archive for the deposit and dissemination of sci-entific research documents, whether they are pub-lished or not. The documents may come from
L’archive ouverte pluridisciplinaire HAL, est destinée au dépôt et à la diffusion de documents scientifiques de niveau recherche, publiés ou non, émanant des établissements d’enseignement et de
Tunable functionality and toxicity studies of titanium
dioxide nanotube layers
E. Feschet-Chassot, V. Raspal, Y. Sibaud, Ok Awitor, Frédérique Bonnemoy,
Jl Bonnet, Jacques Bohatier
To cite this version:
E. Feschet-Chassot, V. Raspal, Y. Sibaud, Ok Awitor, Frédérique Bonnemoy, et al.. Tunable func-tionality and toxicity studies of titanium dioxide nanotube layers. Thin Solid Films, Elsevier, 2011, 519 (8), pp.2564-2568. �10.1016/j.tsf.2010.12.184�. �hal-00830577�
Tunable Functionality and Toxicity Studies of Titanium
Dioxide Nanotube Layers
E. Feschet-Chassota, V. Raspala, Y. Sibauda, O. K. Awitora,∗,
F. Bonnemoyb, J.L.Bonnetb,c, J. Bohatierb,c
aClermont Universit´e, Universit´e d’Auvergne, C-BIOSENSS, BP 10448, F-63000
Clermont Ferrand
bClermont Universit´e, Universit´e Blaise Pascal, UMR CNRS 6023, LMGE, BP 10448,
F-63000 Clermont Ferrand
cClermont Universit´e, Universit´e d’Auvergne, Laboratoire de Biologie cellulaire, BP
10448, F-63000 Clermont Ferrand
Abstract
In this study, we have developed a simple process to fabricate scal-able titanium dioxide nanotube layers which show a tunscal-able functionality. The titanium dioxide nanotube layers were prepared by electrochemical an-odization of Ti foil in 0.4 wt% hydrofluoric acid solution. The nanotube layers structure and morphology were characterized using x-ray diffraction and scanning electron microscopy. The surface topography and wetta-bility were studied according to the anodization time. The sam-ple synthesized displayed a higher contact angle while the current density reached a local minimum. Beyond this point, the contact an-gles decreased with anodization time. Photo-degradation of acid orange 7 in aqueous solution was used as a probe to assess the photocatalytic activity of titanium dioxide nanotube layers under UV irradiation. We obtained better photocatalytic activity for the sample fabricated at higher current density. Finally we used the Ciliated Protozoan T. pyriformis, an alternative cell model used for in vitro toxicity studies, to predict the toxicity of titanium dioxide nanotube layers in a biological system. We did not observe any char-acteristic effect in the presence of the titanium dioxide nanotube layers on two physiological parameters related to this organism, non-specific esterases
∗Corresponding author
activity and population growth rate.
Keywords:
Anodization, Titanium Dioxide Nanotubes, Contact Angle, Photodegradation, Toxicity.
1. Introduction
1
Research into developing nanotubes with interesting properties by
con-2
trolling the nanostructure topography has attracted great interest because of
3
their variety of applications. In 2001, Gong and co-workers [1] reported the
4
fabrication of vertically oriented highly ordered TiO2 nanotube arrays up to 5
approximately 500 nm length by anodization of titanium foil in an aqueous
6
HF electrolyte. Since then, substantial efforts have been devoted to the self
7
organisation and growth of TiO2 [2, 3, 4]. Titanium dioxide nanotube layers 8
are used as photo-catalysts in water and environmental purification, as well
9
as biological and biomedical applications [5, 2, 6]. In particular, Titanium
10
dioxide nanotubes are used as a biomaterial for implants, drug delivery
plat-11
forms, tissue engineering and bacteria killing [7, 8, 9, 10, 11, 12, 13]. Another
12
interesting propriety of TiO2 is its tunable wettability effect [14, 15]. The 13
ability to modify surface topography and to control wetting behavior is useful
14
for biomedical applications. Surface roughness, contact angle, surface energy
15
are the main factors in understanding the biology media and material
inter-16
action. In this work, we present recent results on TiO2 nanotubes fabricated 17
by anodization of Ti foil in 0.4 wt% hydrofluoric acid solution to produce a
18
self-organized porous film structure versus the anodization time. Such TiO2 19
nanotube surfaces are of interest in order to change the wettability
proper-20
ties of titanium oxide films. The nanotube layers were characterized using
21
x-ray diffraction and scanning electron microscopy. We have investigated the
22
surface wettability of as-anodized samples obtained at different anodization
23
times. The as-grown sample synthesized while the current density reached
24
a local minimum displayed higher contact angle. The surface of the oxide
25
was covered at this point with a high density of fine pits. We report on
26
the photo-degradation of acid orange 7 (AO7) in aqueous solutions
27
which was used as a probe to assess the photocatalytic activity of
28
titanium dioxide nanotube layers under UV irradiation. We obtained
29
better photocatalytic activity for the sample fabricated at higher current
30
density. Finally we used the Ciliated Protozoan T. pyriformis to predict the
toxicity of titanium dioxide nanotube layers towards biological systems. 32 2. Experimental Details 33 2.1. Sample preparation 34
To fabricate anodic TiO2 nanotube layers, we used Ti foil (Goodfellow 35
99.6% purity) with a thickness of 0.1 mm. The Ti foils were degreased by
36
successive sonication in trichloroethylene, acetone and methanol, followed by
37
rinsing with deionized water, dried in the oven at 100◦C and finally cooled
38
in the desiccator. Anodization was carried out at room temperature (20◦C)
39
in 0.4 wt% HF aqueous solution with the anodizing voltage maintained at
40
20 V.
41
2.2. Surface characterization
42
The surface topography characterization was performed using a Zeiss
43
Supra 55 VP scanning electron microscope (SEM) with secondary
emis-44
sion and in lens detector. The accelerating voltage and the
work-45
ing distance are respectively 3kV and 5mm. The crystalline
struc-46
ture and phase of the TiO2 nanotube layers were determined by X-47
ray diffraction (XRD) using a Scintag XRD X‘TRA diffractometer
48
with CuKα (λ = 1.54 ˚A) radiation. The CuKβ radiation is filtered
49
through a nickel filter. The diffraction pattern was achieved
be-50
tween 20 and 80◦ with a step angle of 0.05◦ and a scanning speed
51
of 0.01◦ per second.
52
2.3. Contact angles
53
Surface wettability was investigated using a drop shape analysis system
54
(EasyDrop, Kruss, Hambourg, Germany). The contact angle of 3 µL
ses-55
sile droplet of deionized water was measured on the surface under ambient
56
conditions.
57
2.4. Photo-degradation
58
Photocatalytic experiments were conducted in 3 mL of AO7 solution
59
(from Acros Organics) with a concentration of 5.0 10−5 mol/L, placed in a
60
cylindrical Pyrex glass reactor. The surface area of the anodized samples was
61
approximately 3.5 cm2. The glass reactor was irradiated with polychromatic 62
fluorescent UV lamps (Philips TDL 8 Watt (total optical power 1.3 Watt),
63
300 mm long, wavelength range 315-400 nm) in a configuration providing
about 0.9 mW/cm2 at the sample surface. The photocatalytic decomposi-65
tion of AO7 was monitored by the decrease in the solution’s absorbance at a
66
wavelength of 485 nm using a UV-Vis spectrometer (Perkin Elmer Lambda
67
35).
68
2.5. Toxicity assessment
69
The potential toxicity of TiO2 nanotube surfaces was evaluated with 70
Tetrahymena pyriformis using two tests previously validated : inhibition of
71
an enzymatic activity and effect on population growth rate. For non-specific
72
esterases activities quantification, a T. pyriformis culture in an exponential
73
growth phase (in PPYS medium) was centrifuged at 300 rpm, and the
su-74
pernatant was discarded. The T. pyriformis pellet was suspended in Volvic
75
mineral water. After counting cells under a microscope, dilution was done to
76
obtain about 4000 cells/mL. 1 mL of this dilution was incubated for 1h with
77
the different Ti layers at 28 ◦C under UV or without UV irradation. After
78
incubation, Ti layers samples were removed and 1 mL of Fluorescein
diac-79
etate (FDA) at 4.8 µM was added (2000 cells/mL in final). Each toxicity
80
test included two controls : FDA in Volvic water to measure self degradation
81
of this substrate and FDA with Tetrahymena pyriformis (untreated cells).
82
After 30 min, the fluorescence was measured by a spectrofluorimeter
(Kon-83
tron SFM 25, Kontron, Milan, Italy) with a 485 nm excitation filter and
84
a 510 nm emission filter. Experiments were repeated three times for each
85
sample. To test the inhibition of development of populations in an
exponen-86
tial growth phase, we prepared 8 erlenmeyer flasks (40 mL): 2 for control
87
cultures and 6 for the samples to be tested (Ti foil, unannealed TiO2 and 88
TiO2 annealed at 500 ◦C). The samples were deposited at the bottom of the 89
erlenmeyer flasks and 3 mL were removed at 0h, 3h, 6h and 9h to measure
90
the optical density (OD) at 535 nm.
91
3. Results and discussion
92
3.1. T iO2 Nanotube growth process and Layer Characteristics 93
The anodization growth was governed by a competition between anodic
94
oxide formation and chemical dissolution [16] of the oxide as soluble fluoride
95
complexes according respectively to reactions (1) and (2) :
96
T i + 2 H2O → T iO2 + 4 H+ + 4 e− (1)
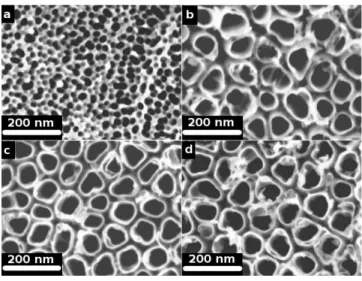
Figure 1 shows a characteristic density current time curve for Ti
anodiza-97
tion in our operating conditions and figure 2 shows SEM images of the TiO2 98
grown at different stages of growth corresponding to the points a, b, c and d.
99
We can notice that after an initial exponential decay of the current density
100
to a local minimum around 10 mA.cm−2 about 70 s. The structure of the
101
film at this point led to the formation of randomly generated pits on the
102
oxide which were shown in figure 2a. The pits were approximately 30 nm in
103
diameter.
104
Figure 1: Typical density current time curve for Ti foil anodization. Anodization was carried out at room temperature (20◦C) in a 0.4 wt% HF aqueous solution with the
anodizing voltage maintained at 20V. Inset in upper right hand conner shows a blow up of the time behavior from 0 to 250 s.
Figure 2: SEM top-view images of samples taken while density current was at local mini-mum (a), local maximini-mum (b) and at the anodization time of 20 min and 40 min respectively (c, d).
After the current density increased to a local maximum of 12,7 mA.cm−2
in 1000 s, we observed ordered nanotube arrays with approximately 85 nm
106
in diameter as evidenced by figure 2b. After 20 min and 40 min of growth,
107
we observed in figure 2c and 2d ordered nanotube arrays with approximately
108
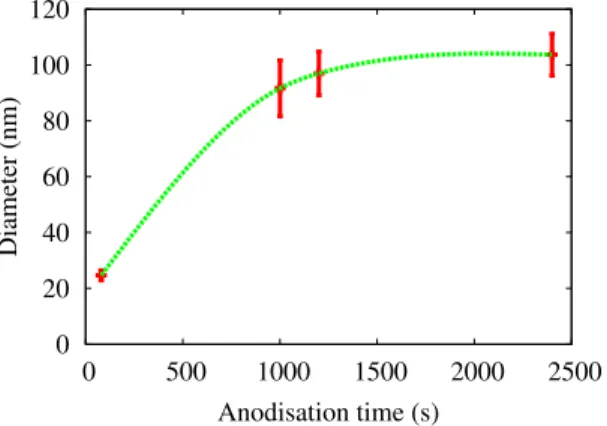
100 nm and 105 nm in diameter respectively. We summarize in figure 3, the
109
evolution of the diameter of the pores. Between 70 and 1000 s, we observed
110
a linear evolution of the diameter versus time with a high slope. Similarly,
111
the trend is weak between 1000 and 2400 s. At 2400 s, we reach the maximum
112
diameter. This shows that the dissolution rate of oxide is predominant over
113
the oxide growth velocity. So in a steady state, the pore diameters do not
114
depend on the anodization time despite enlargement of the pore diameters
115
due to the dissolution of the mouth of the nanotubes as reported elsewhere
116 [17]. 117 0 20 40 60 80 100 120 0 500 1000 1500 2000 2500 Diameter (nm) Anodisation time (s)
Figure 3: The evolution of the diameter of the pores of samples (a), (b), (c) and (d).
We summarize in figure 4 the X-ray diffraction patterns of Ti foil and
118
TiO2 nanotube layers anodized for 40 min before and after annealing at 119
500◦C in oxygen for 2 h according to the paper published elsewhere [2]. The
120
unannealed TiO2nanotube layer exhibits only the peaks from titanium metal 121
foil under the nanotube layer, while the annealed sample exhibits the main
122
lattice phases of anatase and rutile (figure 4).
123
3.2. Contact angles
124
The influence of TiO2 nanotubes on Ti on bone cell-materials interac-125
tion has been reported [18]. In this study, we have evaluated the contact
126
angle behavior on TiO2 nanotube layers which have pronounced topologi-127
cal features and increased surface areas. Contact angles were measured for
20 30 40 50 60 70 80 Relative intensity 2 Θ (degrees) A(101)R(110) a b c TiTi Ti Ti Ti Ti Ti Ti Ti Ti
Figure 4: X-ray diffraction patterns of Ti foil (a), as grown during 40 min (b) and annealed TiO2nanotube layers at 500◦C in oxygen for 2 h (c). Lattice planes indicate anatase (A),
rutile (R) and titanium (Ti).
each as-anodized sample. Each sample was dried in the oven for 30 min and
129
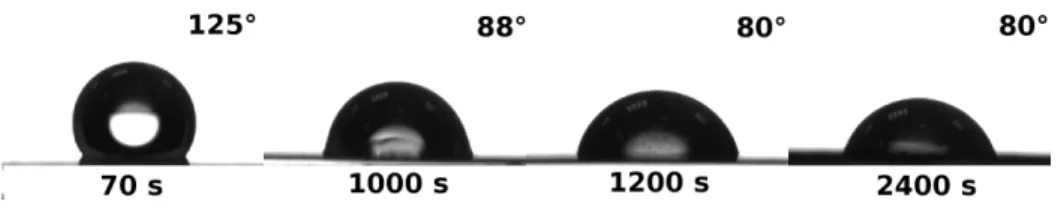
cooled 15 min in the desiccator before measurements. We observe in figure 5,
130
optical images of water droplets on as-grown TiO2 nanotube layers. Results 131
indicated a higher contact angle for the sample covered with pits obtained
132
at local minimum density current (70 s). Beyond this particular point, the
133
contact angles value decreases with anodization time. So we have performed
134
a scalable surface functionality without any chemical treatment.
135
Figure 5: Optical images of water droplets on as-grown TiO2 nanotube layers. Surface at
local minimum density current (70 s); surface at local maximum density current (1000 s); surface after 20 min of growth (1200 s) and surface after 40 min of growth (2400 s).
3.3. Photo-catalytic activity measurement
136
The photo-degradation of AO7 in the presence of TiO2 nanotubes under 137
different conditions is summarized in figure 6. This shows the AO7
concen-138
tration versus time as determined by the solution’s absorbance at 485 nm.
139
The initial concentration of the AO7 was 5.0 10−5 mol/L. C(0) is the initial
concentration of AO7 while C(t) is the concentration after time, t, of
con-141
stant UV irradiation in 315-450 nm wavelength range. The variation of the
142
concentration of AO7 in the presence of the TiO2 layer without irradiation 143
after 5 h is less than 1%. Thus the effect of adsorption of the dye on the TiO2 144
surface is negligible. Curve 6(e) shows the variation in the concentration of
145
AO7 in the presence of unannealed TiO2 nanotubes under UV irradiation. 146
This result indicates that AO7 is not substantially degraded in the presence
147
of amorphous TiO2 nanotube layers. Curves 6(a), 6(b), 6(c) and 6(d) corre-148
sponding to the TiO2 nanotube layers grown during 70 s, 1000 s, 1200 s, 2400 149
s respectively and annealed at 500◦C illustrate photo-degradation of AO7.
150
These results show the decay of organic molecules with UV irradiation in
151
the presence of the annealed nanotubes. We observed the strongest
photo-152
catalytic activity for the sample grown during 1200 s. We cannot draw any
153
correlation between surface wettability and photocatalytic activity.
154 0 20 40 60 80 100 0 5 10 15 20 25 30 Dye concentration C(t)/C(0) in % Irradiation time (h) a: 70 s b: 1000 s c: 1200 s d: 2400 s e: unannealed
Figure 6: Photo-degradation of acid orange 7 (AO7) dye under UV-lamp irradiation at wavelengths of 315-400 nm in the presence of a TiO2 nanotube layer, as measured by
the absorbance of the irradiated dye at 485 nm. C(0) is the initial concentration of AO7 (5 10−5 M) and C(t) is the concentration after time, t, of irradiation. (e) unannealed
TiO2 nanotube layer; (a), (b), (c), (d) TiO2 nanotube layers grown during 70 s, 1000 s,
1200 s, 2400 s respectively and annealed at 500◦C.
The effect of irradiation of the sample grown for 1000 s with
polychro-155
matic light (315-400 nm) on the UV-Vis spectrum is shown in figure 7.
156
Absorbance for increasing irradiation time decreases from the upper curve
157
toward the lower curve.
0 20 40 60 80 100 120 300 350 400 450 500 550 600 650 700 Absorbance Wavelength (nm) Times (h) 0 2 4 6 12 18 24 34 44 54
Figure 7: Effect of irradiation with polychromatic light (315-400 nm) of AO7 in the pres-ence of TiO2 nanotube layers grown during 1000 s and annealed at 500◦C on the UV-Vis
spectrum in the 300-700 nm range.
3.4. Toxicity tests
159
The cellular toxicity of TiO2 based nanofilaments [19], nanoparticles [20] 160
was studied. The authors concluded that these nanofilaments and
nanopar-161
ticles are cytotoxic. However, in other studies, no toxic effects were observed
162
with TiO2 nanoparticles [21, 22]. Similarly the effects of radical reactivity 163
generated by TiO2on cells under UV irradiation is still controversial [23, 24]. 164
As far as we know, no study has been conducted on the toxicity of TiO2 165
nanotube layers. In this work two different tests of toxicity have been made
166
with the Ciliated protozoan T. pyriformis as described in detail elsewhere
167
[25]. This organism is an alternative eukaryotic cell model including the
es-168
tablished fibroblastic cell lines used in vitro toxicity studies. All the tests
169
were carried out with titanium foil, amorphous and crystalline TiO2 nan-170
otube layers. The cristalline samples showed photocatalytic activities. We
171
studied their influence under UV radiation on the toxicity tests. The test
172
of inhibition of non-specific intracellular esterase activity was based on the
173
hydrolysis of fluorescein diacetate (FDA) by T. pyriformis and
quantifica-174
tion of fluorescein released for 30 min. Esterases are ubiquitous enzymes
175
present in all living organisms and are considered as good biomarkers of
cel-176
lular activities. The aim of this test was to determine the evolution of the
177
percentage of the T. pyriformis activity over the control in the presence of
178
Ti foils, amorphous and crystalline TiO2 nanotube layers without UV irra-179
diation without UV) and with constant UV irradiation (With UV) at a
180
wavelength of 315-400 nm. We can observe an effect of titanium foil but
no significant effect of the amorphous and crystalline TiO2 nanotube layers. 182
The UV light radiation did not disturb the results (Figure 8) despite the
183
photocatalytic activities of cristalline samples. Furthermore, T. pyriformis
184
population growth rate test allows us to include different physiological
distur-185
bances which could have been caused by the three types of layers. Growth
186
was followed photometrically with a measure of optical density (λ = 535
187
nm) every 3 hours. Reduction in growth compared to a control culture is
188 indicative of toxicity. 189 No UV With UV 0 10 20 30 40 50 60 70 80 Ti foil As grown TiO2 TiO2 annealed at 500°C T e tr a h ym e n a a ct iv ity (% )
Figure 8: T. pyriformis activity over the control in the presence of Ti foil, amorphous and crystalline TiO2nanotube layers without UV irradiation (No UV) and with constant UV
light (With UV) at wavelength range 315-400 nm.
The purpose of this test was to determine a 50% inhibition of growth rate
190
in treated cultures (increase in 50% of the generation time compared to a
191
control culture). We did not observe any characteristic effect related to the
192
inhibition of protozoa growth for Ti foils, amorphous and crystalline TiO2 193
nanotube layers (Figure 9). We can conclude through these two tests that
194
the TiO2 nanotube layers are not toxic. 195
4. Conclusions
196
We have demonstrated the fabrication of controllable as-grown surfaces
197
of titanium dioxide nanotube layers. The contact angles measurements show
198
clearly the correlation between surface topography and surface wettability.
199
We have shown the ability of the titanium dioxide nanotube layers to degrade
0 0.5 1 1.5 2 2.5 3 3.5 0 2 4 6 8 10
Optical Density(xh)/Optical Density(0h)
Time (h) Control
Ti foil As-grown TiO2 TiO2 annealed at 500 ˚C
Figure 9: Growing populations of T. pyriformis in the presence of titanium foil, amorphous and crystalline titanium dioxide nanotube layers.
AO7. Such surfaces do not show any characteristic in vitro toxicity effect in
201
a biological system. In conclusion, we have developed a simple process to
202
fabricate active surfaces of titanium dioxide with scalable nanotube layers
203
and tunable functionalities.
204
References
205
[1] D. Gong, C. Grimes, O. Varghese, W. Hu, R. Singh, Z. Chen, W. Hu,
206
R. Singh, Z. Chen, J. Mater. Res. 16 (2001) 3331.
207
[2] J. M. Macak, M. Zlamal, J. Krysa, P. Schmuki, Small 3 (2007) 300.
208
[3] O. K. Varghese, D. Gong, M. Paulose, C. A. Grimes, E. C. Dickey, J.
209
Mater. Res. 18 (2003) 156.
210
[4] V. Zwilling, M. Aucouturier, E. Darque-Ceretti, Electrochim. Acta 456
211
(1999) 921.
212
[5] K. Awitor, S. Rafqah, G. G´eranton, Y. Sibaud, P. Larson,
213
R. Bokalawela, J. Jernigen, M. Johnson, J. Photochem. Photobiol., A
214
199 (2008) 250.
215
[6] K. Sasaki, K. Asanuma, K. Johkura, T. Kasuga, Y. Okouchi, N.
Ogi-216
wara, S. Kubota, R. Teng, L. Cui, X. Zhao., Ann. Anat. 188 (2006)
217
137.
[7] K. Vasilev, Z. Poh, K. Kant, J. Chan, A. Michelmore, D. Losic,
Bioma-219
terials 31 (2010) 532.
220
[8] S. D. Puckett, E. Taylor, T. Raimondo, T. J. Webster, Biomaterials 31
221
(2010) 706.
222
[9] S. C. Roy, M. Paulose, , C. A. Grimes, Biomaterials 28 (2007) 4667.
223
[10] G. E. Aninwene, C. Yao, T. J. Webster, Int. J. Nanomed. 3 (2008) 257.
224
[11] I. Romana, C. Fratila, E. Vasile, A. Petre, M.-L. Soare, Mater. Sci. Eng.,
225
B 165 (2009) 207.
226
[12] K. C. Popat, L. Leoni, C. A. Grimes, T. A. Desai, Biomaterials 28 (2007)
227
3188.
228
[13] C. Yao, T. J. Webster, J. Biomed. Mater. Res. B Appl. Biomater. 91B
229
(2009) 587.
230
[14] Y.-Y. Song, F. Schmidt-Stein, S. Bauer, P. Schmuki, J. Am. Chem. Soc.
231
131 (2009) 4230.
232
[15] E. Balaur, J. Macak, H. Tsuchiya, P. Schmuki, J. Mater. Chem. 15
233
(2005) 4488.
234
[16] J. Macak, H. Tsuchiya, A. Ghicov, K. Yasuda, R. Hahn, S. Bauer,
235
P. Schmuki, Curr. Opin. Solid State Mater. Sci. 11 (2007) 3.
236
[17] Z. Su, W. Zhou, J. Mater. Chem. 19 (2009) 2301.
237
[18] K. Das, S. Bose, A. Bandyopadhyay, J. Biomed. Mater. Res. 90A (2009)
238
225.
239
[19] A. Magrez, L. Horv´ath, R. Smajda, V. Salicio, N. Pasquier, L. Forr´o,
240
B. Schwaller, ACS Nano 3 (2009) 2274.
241
[20] W. F. Vevers, A. N. Jha, Ecotoxicology 17 (2008) 410.
242
[21] C. A. J. Dick, D. M. Brown, K. Donaldson, V. Stone, Inhalation Toxicol.
243
15 (2003) 39.
244
[22] T. Xia, M. Kovochich, Nano Lett. 6 (2006) 1794.
[23] C. M. Sayes, R. Wahi, P. A. Kurian, Y. Liu, J. L. West, K. D. Ausman,
246
D. B. Warheit, , V. L. Colvin, Toxicol. Sci. 92 (2006) 174.
247
[24] I. Fenoglio, G. Greco, S. Livraghi, B. Fubini, Chem. Eur. J. 15 (2009)
248
4614.
249
[25] P. Bogaerts, J. Bohatier, F. Bonnemoy, Ecotoxicol. Environ. Saf. 49
250
(2001) 292.