Any correspondence concerning this service should be sent
to the repository administrator:
tech-oatao@listes-diff.inp-toulouse.fr
This is an author’s version published in:
http://oatao.univ-toulouse.fr/226853
Official URL :
http://ceur-ws.org/Vol-1766/oaei16_paper0.pdf
Open Archive Toulouse Archive Ouverte
OATAO is an open access repository that collects the work of Toulouse
researchers and makes it freely available over the web where possible
To cite this version: Achichi, Manel and Cheatham, Michelle and
Dragisic, Zlatan and Euzenat, Jérôme and Faria, Daniel and Ferrara,
Alfio and Flouris, Giorgos and Fundulaki, Irini and Harrow, Ian and
Ivanova, Valentina and Jiménez-Ruiz, Ernesto and Kuss, Elena and
Lambrix, Patrick and Leopold, Henrik and Li, Huanyu and Meilicke,
Christian and Montanelli, Stefano and Pesquita, Catia and Saveta,
Tzanina and Shvaiko, Pavel and Splendiani, Andrea and
Stuckenschmidt, Heiner and Todorov, Konstantin and Trojahn, Cassia
and Zamazal, Ondrej Results of the Ontology Alignment Evaluation
Initiative 2016. (2016) In: 11th International Workshop on Ontology
Matching co-located with the 15th International Semantic Web
Conference (OM 2016), 18 October 2016 (Kobe, Japan).
Results of the
Ontology Alignment Evaluation Initiative 2016
⋆Manel Achichi1 , Michelle Cheatham2 , Zlatan Dragisic3 , J´erˆome Euzenat4 , Daniel Faria5 , Alfio Ferrara6 , Giorgos Flouris7 , Irini Fundulaki7 , Ian Harrow8 , Valentina Ivanova3
, Ernesto Jim´enez-Ruiz9,10, Elena Kuss11
, Patrick Lambrix3 , Henrik Leopold12 , Huanyu Li3 , Christian Meilicke11 , Stefano Montanelli6 , Catia Pesquita13, Tzanina Saveta7, Pavel Shvaiko14, Andrea Splendiani15, Heiner Stuckenschmidt11
, Konstantin Todorov1
, C´assia Trojahn16
, and Ondˇrej Zamazal17
1 LIRMM/University of Montpellier, France
lastname@lirmm.fr
2 Data Semantics (DaSe) Laboratory, Wright State University, USA
michelle.cheatham@wright.edu
3 Link¨oping University & Swedish e-Science Research Center, Link¨oping, Sweden
{zlatan.dragisic,valentina.ivanova,patrick.lambrix}@liu.se
4 INRIA & Univ. Grenoble Alpes, Grenoble, France
Jerome.Euzenat@inria.fr
5 Instituto Gulbenkian de Ciˆencia, Lisbon, Portugal
dfaria@igc.gulbenkian.pt
6 Universit`a degli studi di Milano, Italy
{alfio.ferrara,stefano.montanelli}@unimi.it
7 Institute of Computer Science-FORTH, Heraklion, Greece
{jsaveta,fgeo,fundul}@ics.forth.gr
8 Pistoia Alliance Inc., USA
ian.harrow@pistoiaalliance.org
9 Department of Informatics, University of Oslo, Norway
ernestoj@ifi.uio.no
10 Department of Computer Science, University of Oxford, UK 11 University of Mannheim, Germany
{christian,elena,heiner}@informatik.uni-mannheim.de
12 Vrije Universiteit Amsterdam, The Netherlands
h.leopold@vu.nl
13 LASIGE, Faculdade de Ciˆencias, Universidade de Lisboa, Portugal
cpesquita@di.fc.ul.pt
14 TasLab, Informatica Trentina, Trento, Italy
pavel.shvaiko@infotn.it
15 Novartis Institutes for Biomedical Research, Basel, Switzerland
andrea.splendiani@novartis.com
16 IRIT & Universit´e Toulouse II, Toulouse, France
{cassia.trojahn}@irit.fr
17 University of Economics, Prague, Czech Republic
ondrej.zamazal@vse.cz
Abstract. Ontology matching consists of finding correspondences between se-mantically related entities of two ontologies. OAEI campaigns aim at comparing
ontology matching systems on precisely defined test cases. These test cases can use ontologies of different nature (from simple thesauri to expressive OWL on-tologies) and use different modalities, e.g., blind evaluation, open evaluation, or consensus. OAEI 2016 offered 9 tracks with 22 test cases, and was attended by 21 participants. This paper is an overall presentation of the OAEI 2016 campaign.
1
Introduction
The Ontology Alignment Evaluation Initiative1 (OAEI) is a coordinated international initiative, which organises the evaluation of an increasing number of ontology matching systems [18,21]. Its main goal is to compare systems and algorithms openly and on the same basis, in order to allow anyone to draw conclusions about the best matching strategies. Furthermore, our ambition is that, from such evaluations, tool developers can improve their systems.
Two first events were organised in 2004: (i) the Information Interpretation and Integration Conference (I3CON) held at the NIST Performance Metrics for Intelli-gent Systems (PerMIS) workshop and (ii) the Ontology Alignment Contest held at the Evaluation of Ontology-based Tools (EON) workshop of the annual International Semantic Web Conference (ISWC) [41]. Then, a unique OAEI campaign occurred in 2005 at the workshop on Integrating Ontologies held in conjunction with the Inter-national Conference on Knowledge Capture (K-Cap) [4]. From 2006 until now, the OAEI campaigns were held at the Ontology Matching workshop, collocated with ISWC [19,17,6,14,15,16,2,9,12,8], which this year took place in Kobe, JP2.
Since 2011, we have been using an environment for automatically processing eval-uations (§2.2), which has been developed within the SEALS (Semantic Evaluation At Large Scale) project3. SEALS provided a software infrastructure, for automatically exe-cuting evaluations, and evaluation campaigns for typical semantic web tools, including ontology matching. In the OAEI 2016, all systems were executed under the SEALS client in all tracks, and evaluated with the SEALS client in all tracks. This year we welcomed two new tracks: the Disease and Phenotype track, sponsored by the Pistoia Alliance Ontologies Mapping project, and the Process Model Matching track. Addi-tionally, the Instance Matching track featured a total of 7 matching tasks based on all new data sets. On the other hand, the OA4QA track was discontinued this year.
This paper synthesises the 2016 evaluation campaign. The remainder of the paper is organised as follows: in Section 2, we present the overall evaluation methodology that has been used; Sections 3-11 discuss the settings and the results of each of the test cases; Section 12 overviews lessons learned from the campaign; and finally, Section 13 concludes the paper.
2
General methodology
We first present the test cases proposed this year to the OAEI participants (§2.1). Then, we discuss the resources used by participants to test their systems and the execution
1http://oaei.ontologymatching.org 2http://om2016.ontologymatching.org 3http://www.development.seals-project.eu
environment used for running the tools (§2.2). Finally, we describe the steps of the OAEI campaign (§2.3-2.5) and report on the general execution of the campaign (§2.6). 2.1 Tracks and test cases
This year’s OAEI campaign consisted of 9 tracks gathering 22 test cases, and different evaluation modalities:
The benchmark track (§3): Like in previous campaigns, a systematic benchmark se-ries has been proposed. The goal of this benchmark sese-ries is to identify the areas in which each matching algorithm is strong or weak by systematically altering an ontology. This year, we generated a new benchmark based on the original biblio-graphic ontology and another benchmark using a film ontology.
The expressive ontology track offers alignments between real world ontologies ex-pressed in OWL:
Anatomy (§4): The anatomy test case is about matching the Adult Mouse Anatomy (2744 classes) and a small fragment of the NCI Thesaurus (3304 classes) describing the human anatomy.
Conference (§5): The goal of the conference test case is to find all correct crespondences within a collection of ontologies describing the domain of or-ganising conferences. Results were evaluated automatically against reference alignments and by using logical reasoning techniques.
Large biomedical ontologies (§6): The largebio test case aims at finding align-ments between large and semantically rich biomedical ontologies such as FMA, SNOMED-CT, and NCI. The UMLS Metathesaurus has been used as the basis for reference alignments.
Disease & Phenotype (§7): The disease & phenotype test case aims at finding alignments between two disease ontologies (DOID and ORDO) as well as be-tween human (HPO) and mammalian (MP) phenotype ontologies. The evalua-tion was semi-automatic: consensus alignments were generated based on those produced by the participating systems, and the unique mappings found by each system were evaluated manually.
Multilingual
Multifarm (§8): This test case is based on a subset of the Conference data set, translated into ten different languages (Arabic, Chinese, Czech, Dutch, French, German, Italian, Portuguese, Russian, and Spanish) and the corresponding alignments between these ontologies. Results are evaluated against these align-ments.
Interactive matching
Interactive (§9): This test case offers the possibility to compare different match-ing tools which can benefit from user interaction. Its goal is to show if user interaction can improve matching results, which methods are most promising and how many interactions are necessary. Participating systems are evaluated on the conference data set using an oracle based on the reference alignment, which can generate erroneous responses to simulate user errors.
Instance matching (§10). The track aims at evaluating the performance of match-ing tools when the goal is to detect the degree of similarity between pairs of
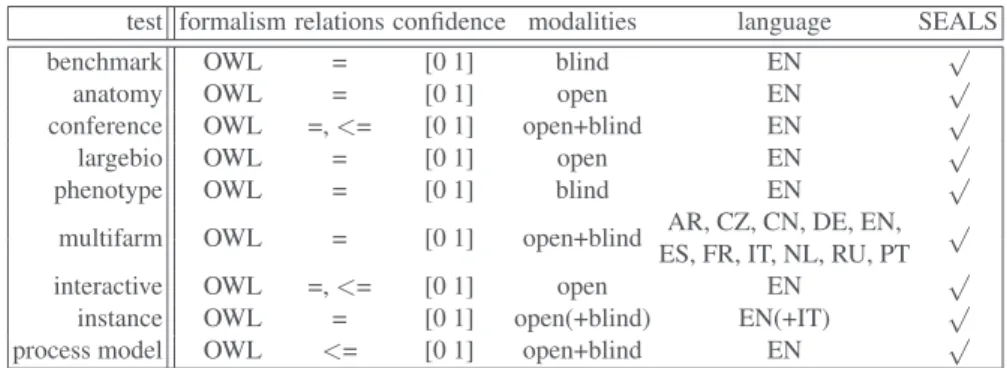
test formalism relations confidence modalities language SEALS
benchmark OWL = [0 1] blind EN √
anatomy OWL = [0 1] open EN √
conference OWL =, <= [0 1] open+blind EN √
largebio OWL = [0 1] open EN √
phenotype OWL = [0 1] blind EN √
multifarm OWL = [0 1] open+blind AR, CZ, CN, DE, EN, √
ES, FR, IT, NL, RU, PT
interactive OWL =, <= [0 1] open EN √
instance OWL = [0 1] open(+blind) EN(+IT) √
process model OWL <= [0 1] open+blind EN √
Table 1.Characteristics of the test cases (open evaluation is made with already published refer-ence alignments and blind evaluation is made by organisers from referrefer-ence alignments unknown to the participants).
items/instances expressed in the form of OWL Aboxes. Three independent tasks are defined:
SABINE: The task is articulated in two sub-tasks called inter-lingual mapping and data linking. Both sub-tasks are based on OWL ontologies containing topics as instances of the class “Topic”. In inter-lingual mapping, two ontologies are given, one containing topics in the English language and one containing topics in the Italian language. The goal is to discover mappings between English and Italian topics. In data linking, the goal is to discover the DBpedia entity which better corresponds to each topic belonging to a source ontology.
SYNTHETIC: The task is articulated in two sub-tasks called UOBM and SPIM-BENCH. In UOBM, the goal is to recognize when two OWL instances be-longing to different data sets, i.e., ontologies, describe the same individual. In SPIMBENCH, the goal is to determine when two OWL instances describe the same Creative Work. Data Sets are produced by altering a set of original data. DOREMUS: The DOREMUS task contains real world data coming from the
French National Library (BnF) and the Philharmonie de Paris (PP). Data are about classical music work and follow the DOREMUS model (one single vo-cabulary for both datasets). Three sub-tasks are defined called nine hetero-geneities, four heterohetero-geneities, and false-positive trap characterized by differ-ent degrees of heterogeneity in work descriptions.
Process Model Matching (§11): The track is concerned with the application of ontol-ogy matching techniques to the problem of matching process models. It is based on a data set used in the Process Model Matching Campaign 2015 [3], which has been converted to an ontological representation. The data set contains nine process models which represent the application process for a master program of German universities as well as reference alignments between all pairs of models.
Table 1 summarises the variation in the proposed test cases. 2.2 The SEALS client
Since 2011, tool developers had to implement a simple interface and to wrap their tools in a predefined way including all required libraries and resources. A tutorial for tool
wrapping was provided to the participants, describing how to wrap a tool and how to use the SEALS client to run a full evaluation locally. This client is then executed by the track organisers to run the evaluation. This approach ensures the reproducibility and comparability of the results of all systems.
2.3 Preparatory phase
Ontologies to be matched and (where applicable) reference alignments have been pro-vided in advance during the period between June 1st and June 30th, 2016. This gave potential participants the occasion to send observations, bug corrections, remarks and other test cases to the organisers. The goal of this preparatory period is to ensure that the delivered tests make sense to the participants. The final test base was released on July 15th, 2016. The (open) data sets did not evolve after that.
2.4 Execution phase
During the execution phase, participants used their systems to automatically match the test case ontologies. In most cases, ontologies are described in OWL-DL and serialised in the RDF/XML format [11]. Participants can self-evaluate their results either by com-paring their output with reference alignments or by using the SEALS client to compute precision and recall. They can tune their systems with respect to the non blind evalua-tion as long as the rules published on the OAEI web site are satisfied. This phase has been conducted between July 15thand August 31st, 2016. Unlike previous years, we requested a mandatory registration of systems and a preliminary evaluation of wrapped systems by July 31st. This reduced the cost of debugging systems with respect to issues with the SEALS client during the Evaluation phase as it happened in the past.
2.5 Evaluation phase
Participants were required to submit their wrapped tools by August 31st, 2016. Tools were then tested by the organisers and minor problems were reported to some tool developers, who were given the opportunity to fix their tools and resubmit them.
Initial results were provided directly to the participants between September 23rdand October 15th, 2016. The final results for most tracks were published on the respective pages of the OAEI website by October 15th, although some tracks were delayed.
The standard evaluation measures are usually precision and recall computed against the reference alignments. More details on the evaluation are given in the sections for the test cases.
2.6 Comments on the execution
Following the recent trend, the number of participating systems has remained approx-imately constant at slightly over 20 (see Figure 1). This year was no exception, as we counted 21 participating systems (out of 30 registered systems). Remarkably, partic-ipating systems have changed considerably between editions, and new systems keep emerging. For example, this year 10 systems had not participated in any of the previ-ous OAEI campaigns. The list of participants is summarised in Table 2. Note that some systems were also evaluated with different versions and configurations as requested by developers (see test case sections for details).
Fig. 1.Number of systems participating in OAEI per year.
3
Benchmark
The goal of the benchmark data set is to provide a stable and detailed picture of each algorithm. For that purpose, algorithms are run on systematically generated test cases. 3.1 Test data
The systematic benchmark test set is built around a seed ontology and many variations of it. Variations are artificially generated by discarding and modifying features from a seed ontology. Considered features are names of entities, comments, the specialisation hierarchy, instances, properties and classes. This test focuses on the characterisation of the behaviour of the tools rather than having them compete on real-life problems. Full description of the systematic benchmark test set can be found on the OAEI web site.
Since OAEI 2011.5, the test sets are generated automatically from different seed ontologies [20]. This year, we used two ontologies:
biblio The bibliography ontology used in the previous years which concerns biblio-graphic references and is inspired freely from BibTeX;
film A movie ontology developed in the MELODI team at IRIT (FilmographieV14). It uses fragments in French and labels in French and English.
The characteristics of these ontologies are described in Table 3.
The film data set was not available to participants when they submitted their sys-tems. The tests were also blind for the organisers since we did not look into them before running the systems.
The reference alignments are still restricted to named classes and properties and use the “=” relation with confidence of 1.
4https://www.irit.fr/recherches/MELODI/ontologies/
System Alin AML CroLOM CroMatcher DiSMatch DKP-A
OM
DKP-A
OM-Lite
FCA-Map Lily LogMap LogMap-Bio LogMapLt LPHOM Lyam++ NAISC PhenoMF PhenoMM PhenoMP RiMOM SimCat XMap Total=21
Confidence √ √ √ √ √ √ √ √ √ √ √ √ √ 13 benchmarks √ √ √ √ √ √ 6 anatomy √ √ √ √ √ √ √ √ √ √ √ √ √ 13 conference √ √ √ √ √ √ √ √ √ √ √ √ √ 13 largebio √ √ √ √ √ √ √ √ √ √ √ √ √ 13 phenotype √ √ √ √ √ √ √ √ √ √ √ 11 multifarm √ √ √ √ √ √ √ 7 interactive √ √ √ √ 4 process model √ √ √ √ 4 instance √ √ √ √ 4 total 9 1 4 1 4 4 4 4 9 3 6 4 5 1 1 1 1 1 1 7 77
Table 2.Participants and the state of their submissions. Confidence stands for the type of results returned by a system: it is ticked when the confidence is a non-boolean value.
Test set biblio film classes+prop 33+64 117+120
instances 112 47
entities 209 284
triples 1332 1717
3.2 Results
In order to avoid the discrepancy of last year, all systems were run in the most simple homogeneous setting. So, this year, we can write anew: All tests have been run entirely in the same conditions with the same strict protocol.
Evaluations were run on a Debian Linux virtual machine configured with four pro-cessors and 8GB of RAM running under a Dell PowerEdge T610 with 2*Intel Xeon Quad Core 2.26GHz E5607 processors and 32GB of RAM, under Linux ProxMox 2 (Debian). All matchers where run under the SEALS client using Java 1.8 and a maxi-mum heap size of 8GB.
As a result, many systems were not able to properly match the benchmark. Evalua-tors availability is not unbounded and it was not possible to pay attention to each system as much as necessary.
Participation From the 21 systems participating to OAEI this year, only 10 systems were providing results for this track. Several of these systems encountered problems:
However we encountered problems with one very slow matcher (LogMapBio) that has been run anyway.RiMOMdid not terminate, but was able to provide (empty) align-ments for biblio, not for film. No timeout was explicitly set.
Reported figures are the average of 5 runs. As has already been shown in [20], there is not much variance in compliance measures across runs.
Compliance Table 4 synthesises the results obtained by matchers.
biblio film
Matcher Prec. F-m. Rec. Prec. F-m. Rec.
edna .35(.58) .41(.54) .51(.50) .43 (.68) .47 (.58) .50 (.50) AML 1.0 .38 .24 1.0 .32 .20 CroMatcher .96 (.60) .89 (.54) .83 (.50) NaN Lily .97 (.45) .89 (.40) .83 (.36) .97 (.39) .81 (.31) .70 (.26) LogMap .93 (.90) .55 (.53) .39 (.37) .83 (.79) .13 (.12) .07 (.06) LogMapLt .43 .46 .50 .62 .51 .44 PhenoMF .03 .01 .01 .03 .01 .01 PhenoMM .03 .01 .01 .03 .01 .01 PhenoMP .02 .01 .01 .03 .01 .01 XMap .95 (.98) .56 (.57) .40 (.40) .78 (.84) .60 (.62) .49 (.49) LogMapBio .48 (.48) .32 (.30) .24 (.22) .59 (.58) .07 (.06) .03 (.03)
Table 4.Aggregated benchmark results: Harmonic means of precision, F-measure and recall, along with their confidence-weighted values.
Systems that participated previously (AML,CroMatcher,Lily,LogMap,LogMapLite,
XMap) still obtain the best results withLilyandCroMatcherstill achieving an impressive .89 F-measure (against .90 and .88 last year). They combine very high precision (.96 and .97) with high recall (.83). ThePhenoXX suite of systems return huge but poor alignments. It is surprising that some of the systems (AML,LogMapLite) do not clearly outperformedna(our edit distance baseline).
On the film data set (which was not known from the participants when submitting their systems, and actually have been generated afterwards), the results of biblio are
fully confirmed: (1) those system able to return results were still able to do it besides
CroMatcherand those unable, were still not able; (2) the order between these systems and their performances are commensurate. Point (1) shows that these are robust sys-tems. Point (2) shows that the performances of these system are consistent across data sets, hence we are indeed measuring something. However, (2) has for exceptionLogMap
andLogMapBio whose precision is roughly preserved but whose recall dramatically drops. A tentative explanation is that film contains many labels in French and these two systems rely too much on WordNet. Anyway, these andCroMatcherseem to show some overfit to biblio.
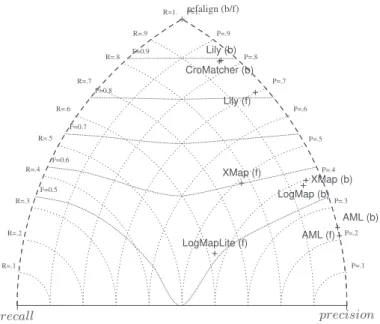
Polarity BesidesLogMapLite, all systems have higher precision than recall as usual and usually very high precision as shown on the triangle graph for biblio (Figure 2). This can be compared with last year.
R=1. R=.9 R=.8 R=.7 R=.6 R=.5 R=.4 R=.3 R=.2 R=.1 P=1. P=.9 P=.8 P=.7 P=.6 P=.5 P=.4 P=.3 P=.2 P=.1 F=0.5 F=0.6 F=0.7 F=0.8 F=0.9 recall precision refalign (b/f) AML (b) CroMatcher (b) Lily (b) LogMap (b) XMap (b) AML (f) Lily (f) LogMapLite (f) XMap (f)
Fig. 2.Triangle view on the benchmark data sets (biblio=(b), film=(f), run 5, non present systems have too low F-measure, below .5).
The precision/recall graph (Figure 3) confirms that, as usual, there are a level of recall unreachable by any system and this is where some of them go to catch their good F-measure.
Concerning confidence-weighted measures, there are two types of systems: those (CroMatcher,Lily) which obviously threshold their results but keep low confidence val-ues and those (LogMap,XMap,LogMapBio) which provide relatively faithful measures. The former shows a strong degradation of the measured values while the latters resist
recall 0. 1. 0. p r e c is io n 1. refalign 1.00 edna 0.50 AML 0.24 XMap 0.40 CroMatcher 0.81 Lily 0.82 LogMap 0.38 LogMapLite 0.50 LogMapBio 0.19 PhenoMF 0.01 PhenoMM 0.01 PhenoMP 0.01
Fig. 3.Precision/recall plots on biblio.
very well withXMapeven improving its score. This measure which is supposed to re-ward systems able to provide accurate confidence values is beneficial to these faithful systems.
Speed Beside LogMapBio which uses alignment repositories on the web to find matches, all matchers do the task in less than 40 min (for biblio and 12h for film). There is still a large discrepancy between matchers concerning the time spent from less than two minutes forLogMapLite,AMLandXMapto nearly two hours forLogMapBio
(on biblio).
biblio film
Matcher time stdev F-m./s. time stdev F-m./s.
AML 120 ±13% .32 183 ±1% .17 CroMatcher 1100 ±3% .08 NaN Lily 2211 ±1% .04 2797 ±1% .03 LogMap 194 ±5% .28 40609 ±33% .00 LogMapLt 96 ±10% .48 116 ±0% .44 PhenoMF 1632 ±8% .00 1798 ±7% .00 PhenoMM 1743 ±7% .00 1909 ±7% .00 PhenoMP 1833 ±7% .00 1835 ±7% .00 XMap 123 ±9% .46 2981 ±21% .02 LogMapBio 54439 ±6% .00 193763419±32% .00
Table 5.Aggregated benchmark results: Time (in second), standard deviation on time and points of F-measure per second spent on the three data sets.
Table 5 provides the average time, time standard deviation and 1/100e F-measure point provided per second by matchers. The F-measure point provided per second shows
that efficient matchers are, like two years ago,LogMapLiteandXMapfollowed byAML
andLogMap. The correlation between time and F-measure only holds for these systems. Time taken by systems is, for most of them, far larger on film than biblio and the deviation from average increased as well.
3.3 Conclusions
This year, there is no increase or decrease of the performance of the best matchers which are roughly the same as previous years. Precision is still preferred to recall by the best systems. It seems difficult to other matchers to catch up both in terms of robustness and performances. This confirms the trend observed last year.
4
Anatomy
The anatomy test case confronts matchers with a specific type of ontologies from the biomedical domain. We focus on two fragments of biomedical ontologies which de-scribe the human anatomy5and the anatomy of the mouse6. This data set has been used since 2007 with some improvements over the years.
4.1 Experimental Setting
We conducted experiments by executing each system in its standard setting and we compare precision, recall, F-measure and recall+. The measure recall+ indicates the amount of detected non-trivial correspondences. The matched entities in a non-trivial correspondence do not have the same normalised label. The approach that generates only trivial correspondences is depicted as baselineStringEquivin the following section. We ran the systems on a server with 3.46 GHz (6 cores) and 8GB RAM allocated to each matching system. Further, we used the SEALS client to execute our evaluation. However, we slightly changed the way precision and recall are computed, i.e., the results generated by the SEALS client vary in some cases by 0.5% compared to the results presented below. In particular, we removed trivial correspondences in the oboInOwl namespace like:
http://...oboInOwl#Synonym = http://...oboInOwl#Synonym
as well as correspondences expressing relations different from equivalence. Using the Pellet reasoner we also checked whether the generated alignment is coherent, i.e., that there are no unsatisfiable classes when the ontologies are merged with the alignment. 4.2 Results
Table 6 reports all the 13 participating systems that could generate an alignment. As previous years some of the systems participated with different versions.LogMap partic-ipated withLogMap,LogMapBioand a lightweight versionLogMapLitethat uses only some core components. Similarly,DKP-AOMalso participated with two versions, DKP-AOMandDKP-AOM-Lite. Several systems participate in the anatomy track for the first time. These areAlin,FCA Map,DLPHOM andLYAM. There are also systems having been participant for several years in a row.LogMapis a constant participant since 2011.
5http://www.cancer.gov/cancertopics/cancerlibrary/
terminologyresources/
AMLandXMap joined the track in 2013.DKP-AOM,LilyandCroMatcherparticipate for the second year in a row in this track.Lilyparticipated in the track back in 2011.
CroMatcherparticipated in 2013 but did not produce an alignment within the given time frame. Thus, this year we have 10 different systems (not counting different ver-sions) which generated an alignment. For more details, we refer the reader to the papers presenting the systems.
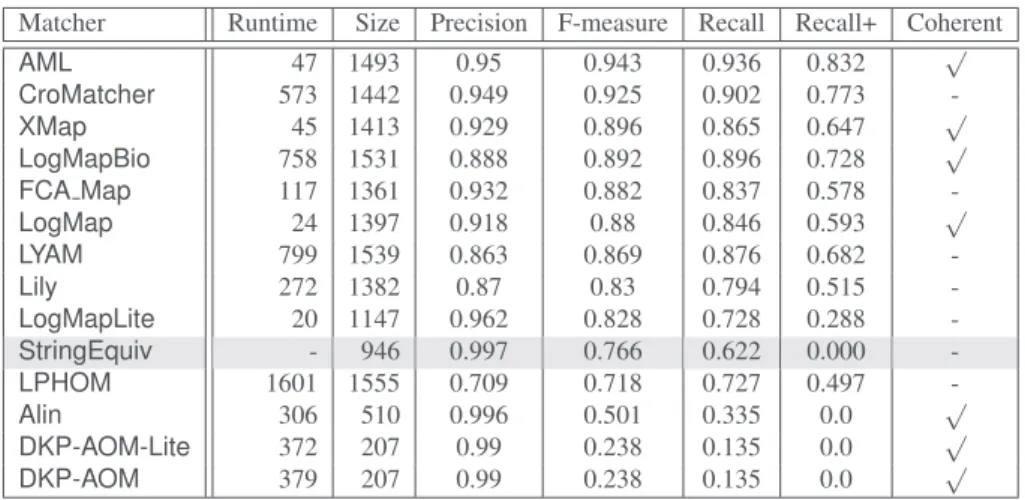
Matcher Runtime Size Precision F-measure Recall Recall+ Coherent
AML 47 1493 0.95 0.943 0.936 0.832 √ CroMatcher 573 1442 0.949 0.925 0.902 0.773 -XMap 45 1413 0.929 0.896 0.865 0.647 √ LogMapBio 758 1531 0.888 0.892 0.896 0.728 √ FCA Map 117 1361 0.932 0.882 0.837 0.578 -LogMap 24 1397 0.918 0.88 0.846 0.593 √ LYAM 799 1539 0.863 0.869 0.876 0.682 -Lily 272 1382 0.87 0.83 0.794 0.515 -LogMapLite 20 1147 0.962 0.828 0.728 0.288 -StringEquiv - 946 0.997 0.766 0.622 0.000 -LPHOM 1601 1555 0.709 0.718 0.727 0.497 -Alin 306 510 0.996 0.501 0.335 0.0 √ DKP-AOM-Lite 372 207 0.99 0.238 0.135 0.0 √ DKP-AOM 379 207 0.99 0.238 0.135 0.0 √
Table 6.Comparison, ordered by F-measure, against the reference alignment, runtime is mea-sured in seconds, the “size” column refers to the number of correspondences in the generated alignment.
Unlike the last two editions of the track when 6 systems generated an alignment in less than 100 seconds, this year only 4 of them were able to complete the alignment task in this time frame. These areAML,XMap,LogMapandLogMapLite. Similarly to the last 4 yearsLogMapLitehas the shortest runtime, followed byLogMap,XMapand
AML. Depending on the specific version of the systems, they require between 20 and 50 seconds to match the ontologies. The table shows that there is no correlation between quality of the generated alignment in terms of precision and recall and required runtime. This result has also been observed in previous OAEI campaigns.
The table also shows the results for precision, recall and F-measure. In terms of F-measure, the top 5 ranked systems are AML,CroMatcher, XMap, LogMapBio and
FCA Map.LogMapis sixth with a F-measure very close toFCA Map. All the long-term participants in the track showed comparable results (in term or F-measure) to their last year’s results and at least as good as the results of the best systems in OAEI 2007-2010.
LogMapandXMapgenerated the same number of correspondences in their alignment (XMapgenerated one correspondence more).AMLandLogMapBiogenerated a slightly different number—16 correspondences more forAMLand 18 less forLogMapBio.
The results for theDKP-AOMsystems are identical this year; by contrast, last year the lite version performed significantly better in terms of the observed measures. While
0.870, recall: from 0.734 to 0.793, and F-measure: from 0.772 to 0.830), this year it performed similarly to last year.CroMatcherimproved its results in comparison to last year. Out of all systems participating in the anatomy trackCroMatchershowed the largest improvement in the observed measures in comparison to its values from the previous edition of the track.
Comparing the F-measures of the new systems,FCA Map(0.882) scored very close to one of the tracks’ long-term participantsLogMap. Another of the new systems—
LYAM—also achieved a good F-measure (0.869) which ranked sixth. As for the other two systems,LPHOMachieved a slightly lower F-measure than the baseline ( StringE-quiv) whereasAlinwas considerably below the baseline.
This year, 9 out of 13 systems achieved an F-measure higher than the baseline which is based on (normalised) string equivalence (StringEquivin the table). This is a slightly better result (percentage-wise) than last year’s (9 out of 15) and similar to 2014’s (7 out of 10). Two of the new participants in the track and the twoDKP-AOMsystems achieved an F-measure lower than the baseline.LPHOMscored under theStringEquivbaseline but at the same time it is the system that produced the highest number of correspondences. Its precision is significantly lower than the other three systems which scored under the baseline and generated only trivial correspondences.
This year seven systems produced coherent alignments which is comparable to the last two years, when 7 out of 15 and 5 out of 10 systems achieved this. From the five best systems onlyFCA Mapproduced an incoherent alignment.
4.3 Conclusions
Like for OAEI in general, the number of participating systems in the anatomy track this year was lower than in 2015 and 2013 but higher than in 2014, and there was a combination of newly-joined systems and long-term participants.
The systems that participated in the previous edition scored similarly to their pre-vious results, indicating that no substantial developments were made with regard to this track. Of the newly-joined systems, (FCA MapandLYAM) ranked 4th and 6th with respect to the F-measure.
5
Conference
The conference test case requires matching several moderately expressive ontologies from the conference organisation domain.
5.1 Test data
The data set consists of 16 ontologies in the domain of organising conferences. These ontologies have been developed within the OntoFarm project7.
The main features of this test case are:
– Generally understandable domain. Most ontology engineers are familiar with or-ganising conferences. Therefore, they can create their own ontologies as well as evaluate the alignments among their concepts with enough erudition.
– Independence of ontologies. Ontologies were developed independently and based on different resources, they thus capture the issues in organising conferences from different points of view and with different terminologies.
– Relative richness in axioms. Most ontologies were equipped with OWL DL axioms of various kinds; this opens a way to use semantic matchers.
Ontologies differ in their numbers of classes and properties, in expressivity, but also in underlying resources.
5.2 Results
We provide results in terms of F-measure, comparison with baseline matchers and re-sults from previous OAEI editions and precision/recall triangular graph based on sharp reference alignments. This year we can provide comparison between OAEI editions of results based on the uncertain version of reference alignment and on violations of consistency and conservativity principles.
Evaluation based on sharp reference alignments We evaluated the results of partic-ipants against blind reference alignments (labelled as rar2). This includes all pairwise combinations between 7 different ontologies, i.e., 21 alignments.
These reference alignments have been made in two steps. First, we have generated them as a transitive closure computed on the original reference alignments. In order to obtain a coherent result, conflicting correspondences, i.e., those causing unsatisfiabil-ity, have been manually inspected and removed by evaluators. The resulting reference alignments are labelled as ra2. Second, we detected violations of conservativity us-ing the approach from [39] and resolved them by an evaluator. The resultus-ing reference alignments are labelled as rar2. As a result, the degree of correctness and completeness of the new reference alignments is probably slightly better than for the old one. How-ever, the differences are relatively limited. Whereas the new reference alignments are not open, the old reference alignments (labeled as ra1 on the conference web page) are available. These represent close approximations of the new ones.
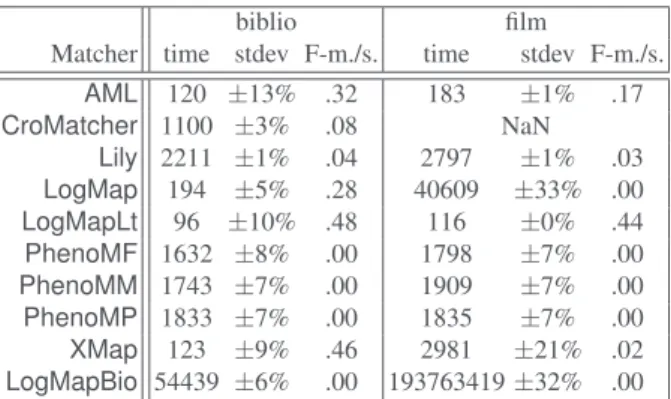
Table 7 shows the results of all participants with regard to the reference alignment rar2. F0.5-measure, F1-measure and F2-measure are computed for the threshold that provides the highest average F1-measure. F1 is the harmonic mean of precision and recall where both are equally weighted; F2 weights recall higher than precision and F0.5weights precision higher than recall. The matchers shown in the table are ordered according to their highest average F1-measure. We employed two baseline matchers.
edna(string edit distance matcher) is used within the benchmark test case and with regard to performance it is very similar as the previously used baseline2 in the con-ference track;StringEquivis used within the anatomy test case. This year these base-lines divide matchers into two performance groups. The first group consists of match-ers (CroMatcher,AML,LogMap,XMap,LogMapBio,FCA Map,DKP-AOM,NAISCand
LogMapLite) having better (or the same) results than both baselines in terms of highest average F1-measure. Other matchers (Lily,LPHOM,AlinandLYAM) performed worse than both baselines. The performance of all matchers (except LYAM) regarding their precision, recall and F1-measure is visualised in Figure 4. Matchers are represented as squares or triangles. Baselines are represented as circles.
Further, we evaluated the performance of matchers separately on classes and prop-erties. We compared the position of tools within overall performance groups and within only classes and only properties performance groups. We observed that while the posi-tion of matchers changed slightly in overall performance groups in comparison with
Matcher Prec. F0.5-m. F1-m. F2-m. Rec. Inc.Align. Conser.V. Consist.V. CroMatcher 0.74 0.72 0.69 0.67 0.65 8 98 25 AML 0.78 0.74 0.69 0.65 0.62 0 52 0 LogMap 0.77 0.72 0.66 0.6 0.57 0 30 0 XMap 0.8 0.73 0.65 0.59 0.55 0 23 0 LogMapBio 0.72 0.67 0.61 0.56 0.53 0 30 0 FCA Map 0.71 0.65 0.59 0.53 0.5 12 46 150 DKP-AOM 0.76 0.68 0.58 0.51 0.47 0 35 0 NAISC 0.77 0.67 0.57 0.49 0.45 20 321 701 edna 0.74 0.66 0.56 0.49 0.45 LogMapLite 0.68 0.62 0.56 0.5 0.47 6 99 81 StringEquiv 0.76 0.65 0.53 0.45 0.41 Lily 0.54 0.53 0.52 0.51 0.5 13 148 167 LPHOM 0.69 0.57 0.46 0.38 0.34 0 0 0 Alin 0.87 0.59 0.4 0.3 0.26 0 0 0 LYAM 0.4 0.31 0.23 0.18 0.16 1 75 3
Table 7.The highest average F[0.5|1|2]-measure and their corresponding precision and recall for each matcher with its F1-optimal threshold (ordered by F1-measure). Inc.Align. means number
of incoherent alignments. Conser.V. means total number of all conservativity principle violations. Consist.V. means total number of all consistency principle violations.
only classes performance groups, a couple of matchers (DKP-AOM and FCA Map) worsen their position from overall performance groups with regard to their position in only properties performance groups due to the fact that they do not match proper-ties at all (AlinandLilyalso fall into this category). More details about these evaluation modalities are on the conference web page.
Comparison with previous years with regard to rar2 Seven matchers also participated in this test case in OAEI 2015. The largest improvement was achieved byCroMatcher
(precision increased from .57 to .74 and recall increased from .47 to .65).
Evaluation based on uncertain version of reference alignments The confidence val-ues of all matches in the sharp reference alignments for the conference track are all 1.0. For the uncertain version of this track, the confidence value of a match has been set equal to the percentage of a group of people who agreed with the match in question (this uncertain version is based on the reference alignment labeled ra1). One key thing to note is that the group was only asked to validate matches that were already present in the existing reference alignments – so some matches had their confidence value reduced from 1.0 to a number near 0, but no new match was added.
There are two ways that we can evaluate matchers according to these “uncertain” reference alignments, which we refer to as discrete and continuous. The discrete evalu-ation considers any match in the reference alignment with a confidence value of 0.5 or greater to be fully correct and those with a confidence less than 0.5 to be fully incorrect. Similarly, a matcher’s match is considered a “yes” if the confidence value is greater than or equal to the matcher’s threshold and a “no” otherwise. In essence, this is the same as the “sharp” evaluation approach, except that some matches have been removed because less than half of the crowdsourcing group agreed with them. The continuous evaluation
rec=1.0 rec=.8 rec=.6 pre=.6 pre=.8 pre=1.0 F1-measure=0.5 F1-measure=0.6 F1-measure=0.7 Alin AML CroMatcher DKP-AOM FCA-Map Lily LogMap LogMapBio LogMapLite LPHOM NAISC XMap edna StringEquiv
Fig. 4.Precision/recall triangular graph for the conference test case. Dotted lines depict level of precision/recall while values of F1-measure are depicted by areas bordered by corresponding
lines F1-measure=0.[5|6|7].
strategy penalises a matcher more if it misses a match on which most people agree than if it misses a more controversial match. For instance, if A ≡ B with a confidence of 0.85 in the reference alignment and a matcher gives that correspondence a confidence of 0.40, then that is counted as 0.85 × 0.40 = 0.34 of a true positive and 0.85–0.40 = 0.45 of a false negative.
Out of the 13 matchers, three (DKP-AOM,FCA-MapandLogMapLite) use 1.0 as the confidence values for all matches they identify. Two of the remaining ten (Alinand Cro-Matcher) have some variation in confidence values, though the majority are 1.0. The rest of the systems have a fairly wide variation of confidence values. Last year, the majority of these values were near the upper end of the [0,1] range. This year we see much more variation in the average confidence values. For example,LopMap’sconfidence values range from 0.29 to 1.0 and average 0.78 whereasLily’srange from 0.22 to 0.41 with an average of 0.33.
Discussion When comparing the performance of the matchers on the uncertain refer-ence alignments versus that on the sharp version, we see that in the discrete case all matchers performed slightly better. Improvement in F-measure ranged from 1 to 8 per-centage points over the sharp reference alignment. This was driven by increased recall, which is a result of the presence of fewer “controversial” matches in the uncertain ver-sion of the reference alignment.
The performance of most matchers is similar regardless of whether a discrete or continuous evaluation methodology is used (provided that the threshold is optimised to achieve the highest possible F-measure in the discrete case). The primary exceptions
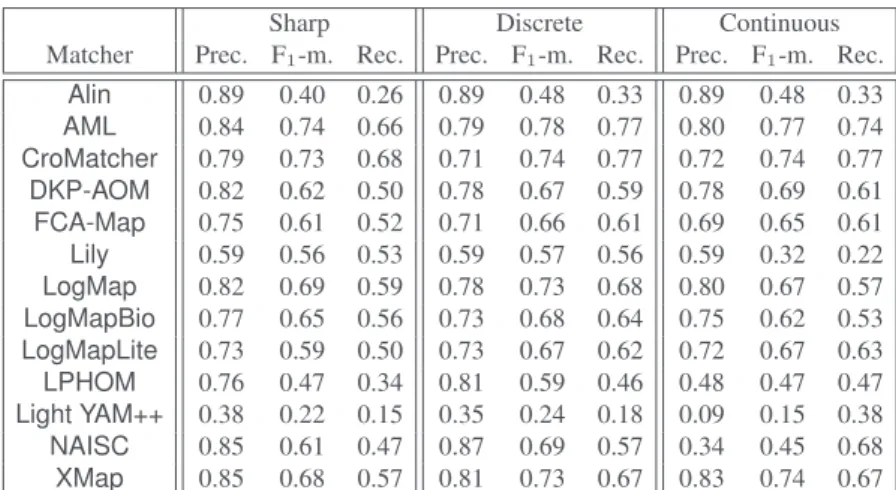
Sharp Discrete Continuous Matcher Prec. F1-m. Rec. Prec. F1-m. Rec. Prec. F1-m. Rec.
Alin 0.89 0.40 0.26 0.89 0.48 0.33 0.89 0.48 0.33 AML 0.84 0.74 0.66 0.79 0.78 0.77 0.80 0.77 0.74 CroMatcher 0.79 0.73 0.68 0.71 0.74 0.77 0.72 0.74 0.77 DKP-AOM 0.82 0.62 0.50 0.78 0.67 0.59 0.78 0.69 0.61 FCA-Map 0.75 0.61 0.52 0.71 0.66 0.61 0.69 0.65 0.61 Lily 0.59 0.56 0.53 0.59 0.57 0.56 0.59 0.32 0.22 LogMap 0.82 0.69 0.59 0.78 0.73 0.68 0.80 0.67 0.57 LogMapBio 0.77 0.65 0.56 0.73 0.68 0.64 0.75 0.62 0.53 LogMapLite 0.73 0.59 0.50 0.73 0.67 0.62 0.72 0.67 0.63 LPHOM 0.76 0.47 0.34 0.81 0.59 0.46 0.48 0.47 0.47 Light YAM++ 0.38 0.22 0.15 0.35 0.24 0.18 0.09 0.15 0.38 NAISC 0.85 0.61 0.47 0.87 0.69 0.57 0.34 0.45 0.68 XMap 0.85 0.68 0.57 0.81 0.73 0.67 0.83 0.74 0.67
Table 8.F-measure, precision, and recall of the different matchers when evaluated using the sharp (ra1), discrete uncertain and continuous uncertain metrics.
to this areLilyandNAISC. These matchers perform significantly worse when evaluated using the continuous version of the metrics. InLily’scase, this is because it assigns very low confidence values to some matches in which the labels are equivalent strings, which many crowdsourcers agreed with unless there was a compelling technical reason not to. This hurts recall, but using a low threshold value in the discrete version of the evaluation metrics “hides” this problem.NAISChas the opposite issue: it assigns relatively high confidence values to some matches that most people disagree with, such as “Assistant” and “Listener” (confidence value of 0.89). This hurts precision in the continuous case, but is taken care of by using a high threshold value (1.0) in the discrete case.
Seven matchers from this year also participated last year, and thus we are able to make some comparisons over time. The F-measures of all matchers either held constant or improved when evaluated against the uncertain reference alignments. Most matchers made modest gains (in the neighborhood of 1 to 6 percentage points).CroMatchermade the largest improvement, and it is now the second-best matcher when evaluated in this way.AgreementMakerLightremains the top performer.
Perhaps more importantly, the difference in the performance of most matchers be-tween the discrete and continuous evaluation has shrunk bebe-tween this year and last year. This is an indication that more matchers are providing confidence values that reflect the disagreement of humans on various matches.
Evaluation based on violations of consistency and conservativity principles We performed evaluation based on detection of conservativity and consistency violations [39,40]. The consistency principle states that correspondences should not lead to un-satisfiable classes in the merged ontology; the conservativity principle states that cor-respondences should not introduce new semantic relationships between concepts from one of the input ontologies.
Table 7 summarises statistics per matcher. The table shows the number of unsat-isfiable TBoxes after the ontologies are merged (Inc. Align.), the total number of all
conservativity principle violations within all alignments (Conser.V.) and the total num-ber of all consistency principle violations (Consist.V.).
Seven tools (Alin,AML,DKP-AOM,LogMap,LogMapBio,LPHOMandXMap) have no consistency principle violations (in comparison to five last year) and one tool (LYAM) generated only one incoherent alignment. There are two tools (Alin,LPHOM) that have no conservativity principle violations, and four more that have an average of only one conservativity principle violation (XMap,LogMap,LogMapBioandDKP-AOM). We should note that these conservativity principle violations can be “false positives” since the entailment in the aligned ontology can be correct although it was not derivable in the single input ontologies.
In conclusion, this year eight matchers performed better than both baselines on ref-erence alignments which is not only consistent but also conservative. Further, this year seven matchers generated coherent alignments (against five matchers last year and four matchers the year before). This confirms the trend that increasingly matchers gener-ate coherent alignments. Based on the uncertain reference alignments, more matchers are providing confidence values that reflect the disagreement of humans on various matches.
6
Large biomedical ontologies (largebio)
The largebio test case requires to match the large and semantically rich biomedical ontologies FMA, SNOMED-CT, and NCI, which contain 78,989, 306,591 and 66,724 classes, respectively.
6.1 Test data
The test case has been split into three matching problems: FMA-NCI, FMA-SNOMED and SNOMED-NCI. Each matching problem has been further divided in 2 tasks involv-ing differently sized fragments of the input ontologies: small overlappinvolv-ing fragments versus whole ontologies (FMA and NCI) or large fragments (SNOMED-CT).
The UMLS Metathesaurus [5] has been selected as the basis for reference align-ments. UMLS is currently the most comprehensive effort for integrating independently-developed medical thesauri and ontologies, including FMA, SNOMED-CT, and NCI.
Although the standard UMLS distribution does not directly provide alignments (in the sense of [21]) between the integrated ontologies, it is relatively straightforward to extract them from the information provided in the distribution files (see [25] for details). It has been noticed, however, that although the creation of UMLS alignments com-bines expert assessment and auditing protocols they lead to a significant number of logical inconsistencies when integrated with the corresponding source ontologies [25]. Since alignment coherence is an aspect of ontology matching that we aim to pro-mote, in previous editions we provided coherent reference alignments by refining the UMLS mappings using the Alcomo (alignment) debugging system [31], LogMap’s (alignment) repair facility [24], or both [26].
However, concerns were raised about the validity and fairness of applying auto-mated alignment repair techniques to make reference alignments coherent [35]. It is clear that using the original (incoherent) UMLS alignments would be penalising to on-tology matching systems that perform alignment repair. However, using automatically repaired alignments would penalise systems that do not perform alignment repair and
also systems that employ a repair strategy that differs from that used on the reference alignments [35].
Thus, as of the 2014 edition, we arrived at a compromising solution that should be fair to all ontology matching systems. Instead of repairing the reference alignments as normal, by removing correspondences, we flagged the incoherence-causing correspon-dencesin the alignments by setting the relation to “?” (unknown). These “?” corre-spondences will neither be considered as positive nor as negative when evaluating the participating ontology matching systems, but will simply be ignored. This way, systems that do not perform alignment repair are not penalised for finding correspondences that (despite causing incoherences) may or may not be correct, and systems that do perform alignment repair are not penalised for removing such correspondences.
To ensure that this solution was as fair as possible to all alignment repair strategies, we flagged as unknown all correspondences suppressed by any ofAlcomo,LogMapor
AML[?], as well as all correspondences suppressed from the reference alignments of last year’s edition (usingAlcomoandLogMapcombined). Note that, we have used the (incomplete) repair modules of the above mentioned systems.
The flagged UMLS-based reference alignment for the OAEI 2016 campaign is sum-marised in Table 9.
Reference alignment “=” corresp. “?” corresp.
FMA-NCI 2,686 338
FMA-SNOMED 6,026 2,982
SNOMED-NCI 17,210 1,634
Table 9.Respective sizes of reference alignments
6.2 Evaluation setting, participation and success
We have run the evaluation on a Ubuntu Laptop with an Intel Core i7-4600U CPU @ 2.10GHz x 4 and allocating 15Gb of RAM. Precision, recall and F-measure have been computed with respect to the UMLS-based reference alignment. Systems have been ordered in terms of F-measure.
This year, out of the 21 systems participating in OAEI 2016, 13 were registered to participate in the largebio track, and 11 of these were able to cope with at least one of the largebio tasks within a 2 hour time frame. However, only 6 systems were able to complete more than one task, and only 4 systems completed all 6 tasks in this time frame.
6.3 Background knowledge
Regarding the use of background knowledge,LogMap-Biouses BioPortal as a mediating ontology provider, that is, it retrieves from BioPortal the most suitable top-10 ontologies for the matching task.
LogMap uses normalisations and spelling variants from the general (biomedical) purpose UMLS Lexicon.
AMLhas three sources of background knowledge which can be used as mediators between the input ontologies: the Uber Anatomy Ontology (Uberon), the Human Dis-ease Ontology (DOID) and the Medical Subject Headings (MeSH).
System FMA-NCI FMA-SNOMED SNOMED-NCI Average # Task 1 Task 2 Task 3 Task 4 Task 5 Task 6
LogMapLite 1 10 2 18 8 18 10 6 AML 35 72 98 166 537 376 214 6 LogMap 10 80 60 433 177 699 243 6 LogMapBio 1,712 1,188 1,180 2,156 3,757 4,322 2,386 6 XMap 17 116 54 366 267 - 164 5 FCA-Map 236 - 1,865 - - - 1,051 2 Lily 699 - - - 699 1 LYAM 1,043 - - - 1,043 1 DKP-AOM 1,547 - - - 1,547 1 DKP-AOM-Lite 1,698 - - - 1,698 1 Alin 5,811 - - - 5,811 1 # Systems 11 6 5 5 5 4 1,351 36
Table 10.System runtimes (s) and task completion.
XMapuses synonyms provided by the UMLS Metathesaurus. Note that matching systems using UMLS Metathesaurus as background knowledge will have a notable advantagesince the largebio reference alignment is also based on the UMLS Metathe-saurus.
6.4 Alignment coherence
Together with precision, recall, F-measure and run times we have also evaluated the coherence of alignments. We report (1) the number of unsatisfiabilities when reasoning with the input ontologies together with the computed alignments, and (2) the ratio of unsatisfiable classes with respect to the size of the union of the input ontologies.
We have used the OWL 2 reasoner HermiT [33] to compute the number of unsatis-fiable classes. For the cases in which HermiT could not cope with the input ontologies and the alignments (in less than 2 hours) we have provided a lower bound on the number of unsatisfiable classes (indicated by ≥) using the OWL 2 EL reasoner ELK [27].
In this OAEI edition, only three distinct systems have shown alignment repair fa-cilities:AML,LogMapand itsLogMap-Biovariant, andXMap(which reuses the repair techniques fromAlcomo[31]). Tables 11-12 (see last two columns) show that even the most precise alignment sets may lead to a huge number of unsatisfiable classes. This proves the importance of using techniques to assess the coherence of the generated alignments if they are to be used in tasks involving reasoning. We encourage ontology matching system developers to develop their own repair techniques or to use state-of-the-art techniques such asAlcomo[31], the repair module ofLogMap(LogMap-Repair) [24] or the repair module ofAML[?], which have worked well in practice [26,22]. 6.5 Runtimes and task completion
Table 10 shows which systems were able to complete each of the matching tasks in less than 24 hours and the required computation times. Systems have been ordered with respect to the number of completed tasks and the average time required to complete them. Times are reported in seconds.
The last column reports the number of tasks that a system could complete. For example, 8 system were able to complete all six tasks. The last row shows the number
Task 1: small FMA and NCI fragments
System Time (s) # Corresp. Scores Incoherence
Prec. F-m. Rec. Unsat. Degree
XMap8 17 2,649 0.98 0.94 0.90 2 0.019% FCA-Map 236 2,834 0.95 0.94 0.92 4,729 46.0% AML 35 2,691 0.96 0.93 0.90 2 0.019% LogMap 10 2,747 0.95 0.92 0.90 2 0.019% LogMapBio 1,712 2,817 0.94 0.92 0.91 2 0.019% LogMapLite 1 2,483 0.97 0.89 0.82 2,045 19.9% Average 1,164 2,677 0.85 0.80 0.78 2,434 23.7% LYAM 1,043 3,534 0.72 0.80 0.89 6,880 66.9% Lily 699 3,374 0.60 0.66 0.72 9,273 90.2% Alin 5,811 1,300 1.00 0.62 0.46 0 0.0% DKP-AOM-Lite 1,698 2,513 0.65 0.61 0.58 1,924 18.7% DKP-AOM 1,547 2,513 0.65 0.61 0.58 1,924 18.7%
Task 2: whole FMA and NCI ontologies
System Time (s) # Corresp. Scores Incoherence
Prec. F-m. Rec. Unsat. Degree
XMap8 116 2,681 0.90 0.87 0.85 9 0.006% AML 72 2,968 0.84 0.85 0.87 10 0.007% LogMap 80 2,693 0.85 0.83 0.80 9 0.006% LogMapBio 1,188 2,924 0.82 0.83 0.84 9 0.006% Average 293 2,948 0.82 0.82 0.84 5,303 3.6% LogMapLite 10 3,477 0.67 0.74 0.82 26,478 18.1%
Table 11.Results for the FMA-NCI matching problem.
of systems that could finish each of the tasks. The tasks involving SNOMED were also harder with respect to both computation times and the number of systems that completed the tasks.
6.6 Results for the FMA-NCI matching problem
Table 11 summarises the results for the tasks in the FMA-NCI matching problem.
XMap and FCA-Mapachieved the highest F-measure in Task 1; XMapand AML
in Task 2. Note however that the use of background knowledge based on the UMLS Metathesaurus has an important impact in the performance ofXMap8. The use of back-ground knowledge led to an improvement in recall fromLogMap-BiooverLogMapin both tasks, but this came at the cost of precision, resulting in the two variants of the system having identical F-measures.
Note that the effectiveness of the systems decreased from Task 1 to Task 2. One rea-son for this is that with larger ontologies there are more plausible mapping candidates, and thus it is harder to attain both a high precision and a high recall. Another reason is that the very scale of the problem constrains the matching strategies that systems can
8Uses background knowledge based on the UMLS Metathesaurus which is the base of the
Task 3: small FMA and SNOMED fragments
System Time (s) # Corresp. Scores Incoherence
Prec. F-m. Rec. Unsat. Degree
XMap8 54 7,311 0.99 0.91 0.85 0 0.0% FCA-Map 1,865 7,649 0.94 0.86 0.80 14,603 61.8% AML 98 6,554 0.95 0.82 0.73 0 0.0% LogMapBio 1,180 6,357 0.94 0.80 0.70 1 0.004% LogMap 60 6,282 0.95 0.80 0.69 1 0.004% Average 543 5,966 0.96 0.76 0.66 2,562 10.8% LogMapLite 2 1,644 0.97 0.34 0.21 771 3.3%
Task 4: whole FMA ontology with SNOMED large fragment
System Time (s) # Corresp. Scores Incoherence
Prec. F-m. Rec. Unsat. Degree
XMap8 366 7,361 0.97 0.90 0.84 0 0.0% AML 166 6,571 0.88 0.77 0.69 0 0.0% LogMap 433 6,281 0.84 0.72 0.63 0 0.0% LogMapBio 2,156 6,520 0.81 0.71 0.64 0 0.0% Average 627 5,711 0.87 0.69 0.60 877 0.4% LogMapLite 18 1,822 0.85 0.34 0.21 4,389 2.2%
Table 12.Results for the FMA-SNOMED matching problem.
employ:AMLfor example, foregoes its matching algorithms that are computationally more complex when handling very large ontologies, due to efficiency concerns.
The size of Task 2 proves a problem for several systems, which were unable to complete it within the allotted time:FCA-Map,LYAM,LiLy,Alin,DKP-AOM-Lite and
DKP-AOM.
6.7 Results for the FMA-SNOMED matching problem
Table 12 summarises the results for the tasks in the FMA-SNOMED matching problem.
XMap produced the best results in terms of both recall and F-measure in Task 3 and Task 4, but again, we must highlight that it uses background knowledge based on the UMLS Metathesaurus. Among the other systems,FCA-MapandAMLachieved the highest F-measure in Tasks 3 and 4, respectively.
Overall, the quality of the results was lower than that observed in the FMA-NCI matching problem, as the matching problem is considerably larger. Indeed, several sys-tems were unable to complete even the smaller Task 3 within the allotted time:LYAM,
LiLy,Alin,DKP-AOM-LiteandDKP-AOM.
Like in the FMA-NCI matching problem, the effectiveness of all systems decreases as the ontology size increases from Task 3 to Task 4;FCA-Map could complete the former but not the latter.
6.8 Results for the SNOMED-NCI matching problem
Table 13 summarises the results for the tasks in the SNOMED-NCI matching problem.
AMLachieved the best results in terms of both recall and F-measure in Tasks 5 and 6, whileLogMapandAMLachieved the best results in terms of precision in Tasks 5 and 6, respectively.
Task 5: small SNOMED and NCI fragments
System Time (s) # Corresp. Scores Incoherence
Prec. F-m. Rec. Unsat. Degree
AML 537 13,584 0.90 0.80 0.71 0 0.0% LogMap 177 12,371 0.92 0.77 0.66 0 0.0% LogMapBio 3,757 12,960 0.90 0.77 0.68 0 0.0% Average 949 13,302 0.91 0.75 0.64 ≥12,090 ≥16.1% XMap8 267 16,657 0.91 0.70 0.56 0 0.0% LogMapLite 8 10,942 0.89 0.69 0.57 ≥60,450 ≥80.4%
Task 6: whole NCI ontology with SNOMED large fragment
System Time (s) # Corresp. Scores Incoherence
Prec. F-m. Rec. Unsat. Degree
AML 376 13,175 0.90 0.77 0.67 ≥2 ≥0.001%
LogMapBio 4,322 13,477 0.84 0.72 0.64 ≥6 ≥0.003%
Average 1,353 12,942 0.85 0.72 0.62 37,667 19.9%
LogMap 699 12,222 0.87 0.71 0.60 ≥4 ≥0.002%
LogMapLite 18 12,894 0.80 0.66 0.57 ≥150,656 ≥79.5%
Table 13.Results for the SNOMED-NCI matching problem.
The overall performance of the systems was lower than in the FMA-SNOMED case, as this test case is even larger. As such,LiLy,DKP-AOM-Lite,DKP-AOM,FCA-Map,Alin
andLYAMcould not complete even the smaller Task 5 within 2 hours.
As in the previous matching problems, effectiveness decreases as the ontology size increases, andXMapcompleted Task 5 but failed to complete Task 6 within the given time frame.
Unlike in the FMA-NCI and FMA-SNOMED matching problems, the use of the UMLS Metathesaurus did not positively impact the performance ofXMap, which ob-tained lower results than expected.
7
Disease and Phenotype Track (phenotype)
The Pistoia Alliance Ontologies Mapping project team9has organised this track based on a real use case where it is required to find alignments between disease and pheno-type ontologies. Specifically, the selected ontologies are the Human Phenopheno-type Ontol-ogy (HPO), the Mammalian Phenotype OntolOntol-ogy (MP), the Human Disease OntolOntol-ogy (DOID), and the Orphanet and Rare Diseases Ontology (ORDO).
7.1 Test data
There are two tasks in this track which comprise the pairwise alignment of:
– Human Phenotype Ontology (HPO) to Mammalian Phenotype Ontology (MP), and – Human Disease Ontology (DOID) to Orphanet and Rare Diseases Ontology
(ORDO).
The first task is important for translational science, since mammal model animals such as mice are widely used to study human diseases and their underlying genetics.
Mapping human phenotypes to mammalian phenotypes greatly facilitates the extrapo-lation from model animals to humans.
The second task is critical to ensure interoperability between two disease ontolo-gies: the more generic DOID and the more specific ORDO, in the domain of rare hu-man diseases. These are fundamental for understanding how genetic variation can cause disease.
Currently, mappings between these ontologies are mostly curated by bioinformatics and disease experts who would benefit from the use of automated ontology matching algorithms into their workflows.
7.2 Evaluation setting
We have run the evaluation on a Ubuntu Laptop with an Intel Core i7-4600U CPU @ 2.10GHz x 4, allocating 15Gb of RAM.
In the OAEI 2016 phenotype track, 11 out of the 21 participating OAEI 2016 sys-tems have been able to cope with at least one of the tasks within a 24 hour time frame. 7.3 Evaluation criteria
Systems have been evaluated according to the following criteria:
– Semantic precision and recall with respect to silver standards automatically gen-erated by voting based on the outputs of all participating systems (we have used vote=2 and vote=3)10.
– Semantic recall with respect to manually generated correspondences for three areas (carbohydrate, obesity and breast cancer).
– Manual assessment of a subset of the generated correspondences, specially the ones that are not suggested by other systems, i.e., unique mapping.
We have used the OWL 2 reasoner HermiT to calculate the semantic precision and recall. For example, a positive hit will mean that a mapping in the reference has been (explicitly) included in the output mappings or it can be inferred using reasoning from the input ontologies and the output mappings. The use of semantic values for preci-sion and recall also allowed us to provide a fair comparison for the systems PhenoMF, PhenoMM and PhenoMP which discover many subsumption mappings that are not ex-plicitly in the silver standards but may still be valid, i.e., inferred.
7.4 Use of background knowledge
LogMapBiouses BioPortal as a mediating ontology provider, that is, it retrieves from BioPortal the most suitable top-10 ontologies for the matching task.
LogMap uses normalisations and spelling variants from the general (biomedical) purpose UMLS Lexicon.
AMLhas three sources of background knowledge which can be used as mediators between the input ontologies: the Uber Anatomy Ontology (Uberon), the Human Dis-ease Ontology (DOID) and the Medical Subject Headings (MeSH). Additionally, for the HPO-MP test case, it uses the logical definitions of both ontologies, which define
10When there are several systems of the same family, only one of them votes for avoiding bias.
Table 14.Results against silver standard with vote 2 and 3.
some of their classes as being a combination of an anatomic term, i.e., a class from ei-ther FMA or Uberon, with a phenotype modifier term, i.e., a class from the Phenotypic Quality Ontology.
XMapuses synonyms provided by the UMLS Metathesaurus.
PhenoMM, PhenoMF and PhenoMP rely on different versions of the Phe-nomeNET11ontology with variable complexity.
7.5 Results
AML,FCA-Map,LogMap,LogMapBio, andPhenoMFproduced the most complete re-sults according to both the automatic and manual evaluation.
Results against the silver standardsThe silver standards with vote 2 and 3 for HP-MP contain 2,308 and 1,588 mappings, respectively; while for DOID-ORDO they include 1,883 and 1,617 mappings respectively. Table 14 shows the results achieved by each of the participating systems. We deliberately did not rank the systems since the silver standards only allow us to assess how systems perform in comparison with one another. On the one hand, some of the mappings in the silver standard may be erroneous (false positives), as all it takes for that is that 2 or 3 systems agree on part of the erroneous mappings they find. On the other hand, the silver standard is not complete, as there will likely be correct mappings that no system is able to find, and as we will show in the manual evaluation, there are a number of mappings found by only one system (and therefore not in the silver standard) which are correct. Nevertheless, the results with respect to the silver standards do provide some insights into the performance of the systems, which is why we highlighted in the table the 5 systems that produce results closest to the silver standards:AML,FCA-Map,LogMap,LogMapBio, andPhenoMF. Results against manually created mappings The manually generated mappings for three areas (carbohydrate, obesity and breast cancer) include 29 mappings between HP and MP and 60 mappings between DOID and ORDO. Most of them representing sub-sumption relationships. Table 15 shows the results in terms of recall for each of the sys-tems.PhenoMF,PhenoMPandPhenoMMachieve very good results for HP-MP since
Table 15.Recall against manually created mappings.
Table 16.Unique mappings in the HP-MP task.
Table 17.Unique mappings in the DOID-ORDO task.
they discover a large number of subsumption mappings. However, for DOID-ORDO onlyLogMap,LogMapBioandDisMatchdiscover some of the mappings in the curated set.
Manual assessment of unique mappings Tables 16 and 17 show the precision results of the manual assessment of the unique mappings generated by the participating sys-tems. Unique mappings are correspondences that no other system (explicitly) provided in the output. We manually evaluated up to 30 mappings and we focused the assessment on unique equivalence mappings.
For exampleDiSMatch’s output contains 291 unique mappings in the HP-MP task. The manual assessment revealed an (estimated) precision of 0.8333. In order to also take into account the number of unique mappings that a system is able to discover, Tables 16
and 17 also include the positive and negative contribution of the unique mappings with respect to the total unique mappings discovered by all participating systems.
8
MultiFarm
The MultiFarm data set [32] aims at evaluating the ability of matching systems to deal with ontologies in different natural languages. This data set results from the translation of 7 ontologies from the conference track (cmt, conference, confOf, iasted, sigkdd, ekaw and edas) into 10 languages: Arabic, Chinese, Czech, Dutch, French, German, Italian, Portuguese, Russian, and Spanish. It is composed of 55 pairs of languages (see [32] for details on how the original MultiFarm data set was generated). For each pair, taking into account the alignment direction (cmten–confOfdeand cmtde–confOfen, for instance, as two distinct matching tasks), we have 49 matching tasks. The whole data set is composed of 55 × 49 matching tasks.
8.1 Experimental setting
Part of the data set is used for blind evaluation. This subset includes all matching tasks involving the edas and ekaw ontologies (resulting in 55 × 24 matching tasks). This year, we have conducted a minimalistic evaluation and focused on the blind data set. Participants were able to test their systems on the available subset of matching tasks (open evaluation), available via the SEALS repository. The open subset covers 45 × 25 tasks. The open subset does not include Italian translations.
We distinguish two types of matching tasks: (i) those tasks where two different ontologies (cmt–confOf, for instance) have been translated into two different languages; and (ii) those tasks where the same ontology (cmt–cmt) has been translated into two different languages. For the tasks of type (ii), good results are not directly related to the use of specific techniques for dealing with cross-lingual ontologies, but on the ability to exploit the identical structure of the ontologies.
For the sake of simplicity, we refer in the following to cross-lingual systems those implementing cross-lingual matching strategies and non-cross-lingual systems those without that feature.
This year, there were on 7 cross-lingual systems (out of 21): AML,CroLOM-Lite,
IOMAP(renamedSimCat-Lite), LogMap,LPHOM,LYAM++, andXMap. Among these systems, onlyCroLOM-LiteandSimCat-Liteare specifically designed to this task. The reader can refer to the OAEI papers for a detailed description of the strategies adopted by each system.
The number of participants in fact increased with respect to the last campaign (5 in 2015, 3 in 2014, 7 in 2013, and 7 in 2012).
Following the OAEI evaluation rules, all systems should be evaluated in all tracks although it is expected that some system produce bad or no results. For this track, we observed different behaviours:
– CroMatcherandLYAMhave experimented internal errors but were able to generated alignments for less than half of the tasks;
– AlinandLilyhave generated no errors but empty alignments for all tasks;
– DKP-AOMandDKP-AOM-Litewere executed without errors but generated align-ments for less than half of the tasks;
– NAISChas mostly generated erroneous correspondences (for very few tasks) and
RiMOMhas basically generated correspondences between ontology annotations; – Dedicated systems (FCA-Map,LogMapBio,PhenoMF,PhenoMMand PhenoMP)
required more than 30 minutes (in average) for completing a single task and were not evaluated;
In the following, we report the results for the systems dedicated to the task or that have been able to provide non-empty alignments for some tasks. We count on 12 sys-tems (out of 21 participants).
8.2 Execution setting and runtime
The systems have been executed on a Ubuntu Linux machine configured with 8GB of RAM running under a Intel Core CPU 2.00GHz x4 processors. All measurements are based on a single run. As Table 18, we can observe large differences in the time required for a system to complete the 55 x 24 matching tasks. Note as well that the concurrent access to the SEALS repositories during the evaluation period may have an impact in the time required for completing the tasks.
8.3 Evaluation results
Table 18 presents the aggregated results for the matching tasks involving edas and ekaw ontologies. They have been computed using the Alignment API 4.6 and can slightly differ from those computed with the SEALS client. We haven’t applied any threshold on the generated alignments. They are measured in terms of classical precision and recall (future evaluations should include weighted and semantic metrics).
For both types of tasks, most systems favor precision to the detriment of recall. The exception isLPHOM that has generated huge sets of correspondences (together withLYAM). As expected, (most) systems cross-lingual systems outperform the non-cross-lingual ones (the exceptions areLPHOM,LYAMandXMap, which have low per-formance for different reasons, i.e., many internal exceptions or poor ability to deal with the specifics of the task). On the other hand, this year, many non-cross-lingual systems dealing with matching at schema level have been executed with errors ( Cro-Matcher,GA4OM) or were not able to deal at with the tasks (Alin,Lily,NAISC). Hence, their structural strategies could not be in fact evaluated (tasks of type ii). For both tasks,
DKP-AOMandDKP-AOM-Litehave good performance in terms of precision but gener-ating few correspondences for less than half of the matching tasks.
In particular, for the tasks of type (i),AMLoutperforms all other systems in terms of F-measure, followed byLogMap,CroLOM-LiteandSimCat-Lite. However,LogMap
outperforms all systems in terms of precision, keeping a relatively good performance in terms of recall. For tasks of type (ii),AMLdecreases in performance withLogMap
keeping its good results and outperforming all systems, followed byCroLOM-Liteand
SimCat-Lite.
With respect to the pairs of languages for test cases of type (i), for the sake of brevity, we do not present them here. The reader can refer to the OAEI results web page for detailed results for each of the 55 pairs. While non-cross-lingual systems were not able to deal with many pairs of languages (in particular those involving the ar, cn, and ru languages), only 4 cross-lingual systems were able to deal with all pairs of languages

![Table 7. The highest average F [0.5|1|2] -measure and their corresponding precision and recall for each matcher with its F 1 -optimal threshold (ordered by F 1 -measure)](https://thumb-eu.123doks.com/thumbv2/123doknet/3162196.90152/16.892.202.697.218.484/highest-average-measure-corresponding-precision-matcher-optimal-threshold.webp)