HAL Id: hal-01978077
https://hal.archives-ouvertes.fr/hal-01978077
Submitted on 11 Jan 2019HAL is a multi-disciplinary open access
archive for the deposit and dissemination of sci-entific research documents, whether they are pub-lished or not. The documents may come from teaching and research institutions in France or abroad, or from public or private research centers.
L’archive ouverte pluridisciplinaire HAL, est destinée au dépôt et à la diffusion de documents scientifiques de niveau recherche, publiés ou non, émanant des établissements d’enseignement et de recherche français ou étrangers, des laboratoires publics ou privés.
A graph-based method to detect and correct invalid
features in subsurface structural models
Pierre Anquez, Jeanne Pellerin, Guillaume Caumon
To cite this version:
Pierre Anquez, Jeanne Pellerin, Guillaume Caumon. A graph-based method to detect and correct invalid features in subsurface structural models. 80th EAGE Conference & Exhibition 2018, Jun 2018, Copenhague, Denmark. �10.3997/2214-4609.201801233�. �hal-01978077�
structural models
Pierre Anquez1, Jeanne Pellerin2, and Guillaume Caumon1
1Universit´e de Lorraine, CNRS, GeoRessources, F-54000 Nancy, France 2Universit´e Catholique de Louvain, MEMA, B-1348 Louvain-la-Neuve, Belgium
80th EAGE Conference and Exhibition 2018 Copenhagen, Denmark
June 2018
Abstract
We introduce a method to process boundary defined geological models and ease their meshing. Our method detects and fixes geological model invalid features, (e.g. small gaps breaking model watertightness) and complex features (e.g. thin layers, unconformities and small fault throws) which constrain mesh element resolutions and angles making mesh generation challenging. These features are modeled by a graph that provides a formal framework to operate and correct the input model. The possible operations to fix the geometrical and topological issues are equivalent to graph elementary operations. Our method then first operates on the graph aiming at removing all the edges representing invalid features. The second step is to account for these topological changes in the geometrical model. The procedure is illustrated on an invalid 2D subsurface cross-section characterized by many small gaps and several intersections between the faults and the horizons.
1
Introduction
Meshing a 3D geological model is often essential in integrative subsurface modeling, but it is often a time-consuming task that typically requires a lot of user interaction. The challenges are twofold: (i) the invalidity of the models and (ii) their geometrical complexity. The main cause of invalidity for 2D or 3D boundary models is the non-watertightness, e.g. a small gap between a fault and a displaced horizon (e.g.,Caumon et al.,2004;Zehner et al.,2015). Watertightness is required by most meshing
methods. As shown by Pellerin et al. (2015), the inherent geometrical complexity of geological
model has multiple causes, thin layers, unconformities, or small fault displacements. Since these small features constrain the edge lengths as well as the angles of the mesh elements, they strongly constrain the quality of the mesh cells to generate. To have a good mesh quality and ensure the accuracy of geomechanichal or flow simulations, one solution is to highly increase the number mesh elements. But when a maximum of the number of mesh elements is set, or when the meshing method fails because of the small features, a second solution is to modify the geological model by merging locally or displacing its boundaries before generating the mesh (e.g.,Mustapha & Dimitrakopoulos,2011;Mustapha et al.,2011;Pellerin et al.,2014;Karimi-Fard & Durlofsky,2016).
We propose such a method in this work. We formalize the local invalidity and geometrical complex-ity of a geological model by a graph. The nodes of the graph are individual model components. The edges connect two components in invalid relationship such as a gap between a fault and an horizon, or an overlap between two horizons. This graph represents all invalid features of the model and provides a framework in which simplification operations are well defined. Each operation aims at removing an edge, the final goal being to remove all edges. The final step is to actually simplify the input structural B-Rep models. This is an extremely challenging task in 3D, and so our present objective is to perform the geometrical modifications very robustly in 2D.
80th EAGE Conference and Exhibition 2018
2
Method
We define a graph to describe all the invalid features in the initial geological model. Each node of this graph represents one or several parts of the initial model entities. A node stores information about which portion of the model it stands for, i.e. one or several model entities in whole or in part. Each edge links two distinct nodes representing one or several issues between the corresponding two model entities. This allows to translate repair and simplification strategies in terms of simple graph operations.
Our method for analyzing and correcting invalid features is presented and illustrated on 2D struc-tural models such as 2D cross-sections. These 2D section models are composed of three types of entities: the lines and the corners, e.g. particular points as triple-points between lines and line tips, delimiting the surfaces. But the framework aims to be general enough to be applicable in 3D.
2.1 Graph initialization: analysis of the input geological model
The first step is to analyze the initial model geometry to build the graph. A node is added into the graph for each corner and each line of the initial model. During the initialization of the graph nodes, each node corresponds to a complete model entity: e.g. for a line, the node information contains only one part corresponding to the line from one corner to the other one.
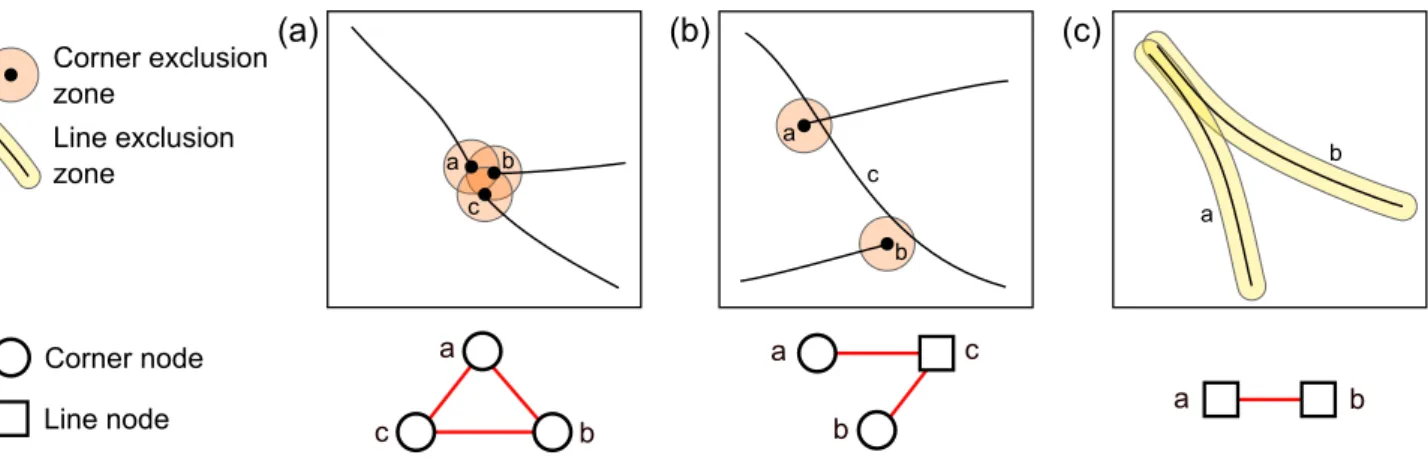
Edges are then added into the graph if there is an issue, i.e. invalid feature or complex feature, between two model entities. This analysis is based on the definition of exclusion zones around model corners and lines (Figure1). These exclusion zones are set by user-defined minimum feature size and/or minimum angle between entities (typically between model lines). Exclusion zones depict areas where other entities and exclusion zones should not be located. An intersection between exclusion zones indicates that the two entities are too close. In this case an edge is added into the graph between the nodes standing for the two model entities (Figure 1). Information on the edge stores for the two linked nodes which entity parts are affected by the exclusion zone intersection. Several parts can be stored on the same edge in the case exclusion zones intersect at several non-connected components.
(a) (b) (c) Line node Corner node Corner exclusion zone Line exclusion zone a b c a b c a b c a b c a b a b
Figure 1: Model analysis and graph initialization. Intersections between exclusion zones and entities are represented by graph edges (red). (a) Corner-Corner edges. (b) Corner-Line edges.
(c) Line-Line edge.
Once all the couples of model corners and model lines (including corner-line couples) are analyzed, the initial graph is set. The next step is to manipulate and modify this graph to determine how to correct model invalid features.
2.2 Graph edge removal: correction of input model invalid features
As the graph edges represent the issues in the input model, the correction of these issues consists in the removal of all the edges. We perform graph elementary operations on nodes and edges to remove all the edges. There are two ways to remove edges from the graph (Figure 2). The first way is to perform an edge deletion (Figure2-b). The edge is simply removed from the graph without affecting the nodes which had been linked by the edge. However additional information is added on the nodes
80th EAGE Conference and Exhibition 2018 Anquez et al.
in order to effectively and geometrically correct the invalid feature represented by the deleted edge. As an example, two model entities with intersecting exclusion zones are represented by an edge in the graph. Moving these two entities away one from another till their exclusion zones do not intersect corresponds to the deletion of the edge. The second way to remove edges from the graph is edge contraction (Figure2-c). When an edge between two nodes is contracted, these two nodes are merged and the edge is removed. An edge contraction corresponds to the merger between two model entities. The different options are partly constrained by geological information on the entities. The choice will depend on the entity geological types, e.g. edge contraction is the unique solution to solve horizon free-border invalid configurations.
Graph edge removal step is performed in two phases (Figure3). In the first phase, graph nodes are split to strictly represent the individual entity parts involved in the node incident edges (Figure3-b). These edges are reallocated to the new nodes depending of the parts they concern. New nodes are inserted: they correspond to the corners to insert between line parts. Edges are added between all the pairs of nodes standing for added close corners. As a consequence the number of nodes and edges increase during this phase. Edges are removed during the second phase either by edge deletion or by edge contraction (Figure 3-c). Edge contractions result in the reduction of the number of the graph nodes.
The final graph is an independent set, i.e. no edge connect two nodes. Nodes of the modified graph represent the entities of the corrected model. Nodes contain all the information necessary to the modified model generation, especially for finding the geometric embedding of the newly defined model entities. (a) (b) (c) Corner node Corner exclusion zone a b c a b c a b c a b c a,b,c a,b,c (d) a,c b b a,c
Figure 2: Graph edges are removed using either edge deletion or edge contraction. (a) Initial configuration. (b) Edge deletion (geometric modification). (c) Edge contraction (topology modification). (d) Using both edge deletion and edge contraction (between corners a and c).
(c) (a) (b) Line node Corner node Line exclusion zone a b c d a - c a - c a b c d a b d c a,b c,d a,c b d b d a,c Corner
Corner between line parts (not geometrically in the model)
Limit between line
parts e f e,f e,f f e
Figure 3: Model analysis and graph initialization. Intersections between exclusion zones and entities are represented by graph edges (red). (a) Initial configuration. (b) First phase: nodes are split and new nodes are added. (c) Second phase: edge are removed (using edge contraction
80th EAGE Conference and Exhibition 2018
3
Result on a 2D cross-section
(a) Initial cross-section model
(c) Repaired model Detail 1 Detail 2 Detail 1 Detail 2 Detail 2 Detail 2 Detail 1 Detail 1 400 m 1 150 m
(b) Graph of invalid features
Line node Corner node
Edge
Figure 4: Repair of a synthetic 2D cross-section. (a) Input model showing gaps and intersec-tions between faults and horizons. (b) Initial graph representing initial model invalid features.
(c) Repaired model.
We illustrate the results of our method on a 2D cross-section (Figure 4). Faults and horizons are represented by polyline meshes showing non conformities (Figure 4-a). There are small gaps and intersections at the extremities of lines representing horizons. Therefore the initial model is not watertight preventing 2D surface meshing. Analyzing the initial model, using a constant and circular exclusion zone primitive disk of radius r = 8 meters, lead to the initialization of the graph shown on Figure 4-b. This graph contains 63 nodes, 42 for model corners and 21 for model lines, and 38 edges. These edges correspond to the small gaps and intersections at the line extremities. Figure 4-c shows the repaired model after having editing the graph and remeshing the model entities. The final graph has 93 nodes, 38 for corners and 55 for the lines, and no more edges. There is no gaps nor intersections between the faults and the horizons allowing to define the several model watertight layers.
4
Conclusions
We introduce a method to formalize invalidity and geometrical complexity of geological models with a graph. The graph nodes stand for model individual components and edges of the graph repre-sents local invalid configurations between model components. Elementary editing operations on the graph characterize the potential options to remove graph edges and as final objective to correct given
80th EAGE Conference and Exhibition 2018 Anquez et al.
model. The framework of our method is general enough to believe that it is also applicable on 3D structural models by introducing their surface components into the graph formalism. However, this implies to manage more configurations especially for correcting surface-line and surface-surface invalid interactions.
5
Acknowledgements
This research was performed in the frame of the RING project at the Universit´e de Lorraine. We would like to thank for their support the industrial and academic sponsors of the RING-GOCAD Consortium managed by ASGA. J. Pellerin is supported by ERC project Hextreme [ERC-2015-AdG-694020]. We also acknowledge Inria for the Geogram library used in RINGMesh and Paradigm for the SKUA-GOCAD software.
References
G. Caumon, F. Lepage, C. H. Sword & J.-L. Mallet [2004]. Building and editing a sealed geological model. Mathematical Geology, 36(4):405–424.
M. Karimi-Fard & L. J. Durlofsky [2016]. A general gridding, discretization, and coarsening methodology for modeling flow in porous formations with discrete geological features. Advances in Water Resources, 96:354–372.
H. Mustapha & R. Dimitrakopoulos [2011]. Discretizing two-dimensional complex fractured fields for incompressible two-phase flow. International Journal for Numerical Methods in Fluids, 65(7):764–780.
H. Mustapha, R. Dimitrakopoulos, T. Graf & A. Firoozabadi [2011]. An efficient method for discretizing 3D fractured media for subsurface flow and transport simulations. International Journal for Numerical Methods in Fluids, 67(5):651–670. doi:10.1002/fld.2383.
J. Pellerin, G. Caumon, C. Julio, P. Mejia-Herrera & A. Botella [2015]. Elements for measuring the complexity of 3D structural models: Connectivity and geometry. Computers & Geosciences, 76:130–140. doi:10.1016/j.cageo.2015.01.002.
J. Pellerin, B. L´evy, G. Caumon & A. Botella [2014]. Automatic surface remeshing of 3d structural models at specified resolution: A method based on voronoi diagrams. Computers & Geosciences, 62:103–116.
B. Zehner, J. H. B¨orner, I. G¨orz & K. Spitzer [2015]. Workflows for generating tetrahedral meshes for finite element simulations on complex geological structures. Computers & Geosciences, 79:105–117.